Elastic Observability 7.6.0 released
Elastic Observability 7.6 expands multicloud monitoring to include support for Google Cloud Platform (GCP) and doubles down on open standards with native support for Jaeger traces. This release also takes an important step in helping organizations wrangle unstructured logs using ML-assisted log categorization, and brings operations and infosec closer together by making insights from APM directly available in the SIEM application.
If you can’t wait to get started with your Elastic Observability journey, check out our latest version with a free 14-day trial of our Elasticsearch Service on Elastic Cloud or install the latest version of the Elastic Stack. Otherwise, read on!
Strengthening multicloud monitoring support with addition of GCP
We are expanding our integrations into the cloud ecosystem and helping users keep better tabs on their cloud operations. On the heels of AWS and Azure cloud monitoring, the 7.6 release adds support for monitoring Google Cloud Platform (GCP) infrastructure and services. New GCP modules let you directly monitor VMs as well as any GCP service monitored by Stackdriver. As always, out-of-the-box Kibana dashboards included with the product mean that you can go from ingest to insight with minimal effort and in no time. These new cloud data integrations, along with several others added in recent releases, bring deeper visibility into multicloud operations.
Other cloud monitoring highlights in the 7.6 release include:
- Addition of a new AWS Inventory view in the Metrics UI, which offers custom views for AWS EC2 instances, S3 buckets, RDS databases, and SQS queues
- Support for analyzing AWS VPC flow logs, inclusive of a built-in dashboard that can help monitor traffic composition and diagnose overly restrictive security group rules
- Addition of a new Azure Storage monitoring capability suitable for monitoring usage and health of Azure Blobs, Azure Files, Azure Queues, and Azure Tables
Learn more about cloud monitoring in Elastic Metrics and Elastic Logs blog posts.
Doubling down on open standards with native Jaeger support in Elastic APM
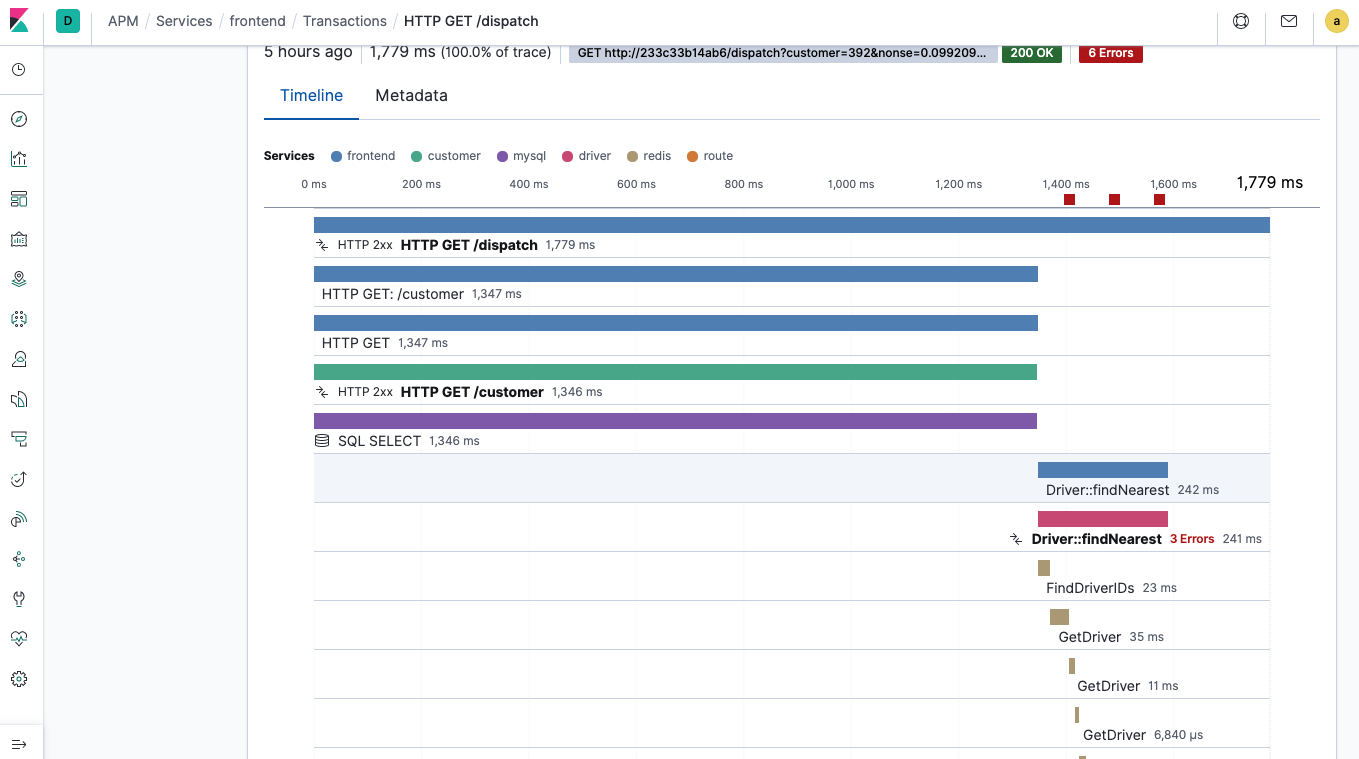
From open source to open code, openness is at the heart of everything we do. It’s exciting to see the observability community develop and embrace open standards with initiatives like OpenTracing and OpenTelemetry, and we are committed to supporting these open standards in Elastic Observability. Jaeger, a CNCF graduated project, is a popular choice for end-to-end request tracing that is compatible with OpenTracing standards. Elastic APM agents have been OpenTracing-compatible since the early days. We are thrilled to provide an even more direct bridge between Elastic APM and Jaeger, with Jaeger intake support in version 7.6.
Elastic APM now acts as a Jaeger intake, enabling customers to ingest Jaeger-instrumented traces directly into Elasticsearch via the APM server without needing to change existing Jaeger instrumented code. Users can now bring their Jaeger instrumented traces into Elastic APM and explore them alongside their logs and metrics in no time, and with very little effort.
Other APM highlights include:
- Release annotation in Elastic APM detects when new versions of services are released and automatically annotates the timeline in the APM app
- Support for passing the distributed trace ID through common messaging frameworks, such as Kafka and JMS in the Java agent
Learn about all the new features in Elastic APM in the detailed blog post.
Speeding up root cause analysis with logs categorization
Unstructured application logs can be hard to analyze in a centralized monitoring system. You can’t always parse them upfront, but you still have to make sense of them. Log categorization can help! Because many of these messages are the same or very similar, putting them in categories can condense millions of log lines into just a few categories, and allow analysts to get to the root cause of problems much faster.
In 7.6 the Logs UI introduces a Categories tab, which allows you to turn on this analysis and run it on the body of logs you are already searching in the Stream app. The log categories visualization UI helps you to sort and search the categories, and you can dive into the Machine Learning app to learn more about anomalies per category.
Learn about all the new features in Elastic Logs in the detailed blog post.
Containing costs with billing and usage analysis for AWS
In this release we’ve added another lens into observability of your AWS accounts. The new Metricbeat billing and usage metricsets help you answer questions such as: What will my bill look like? Am I using my quota efficiently? Is there room for improvement?
Both metricsets come with dashboards where all of these metrics are visualized in a simple way. You can reuse these visualizations by putting them side by side with your other operational data points, like service metrics, to see how your operations correlate with the incurred cost.
Learn about this and other new features in the Elastic Metrics blog post.
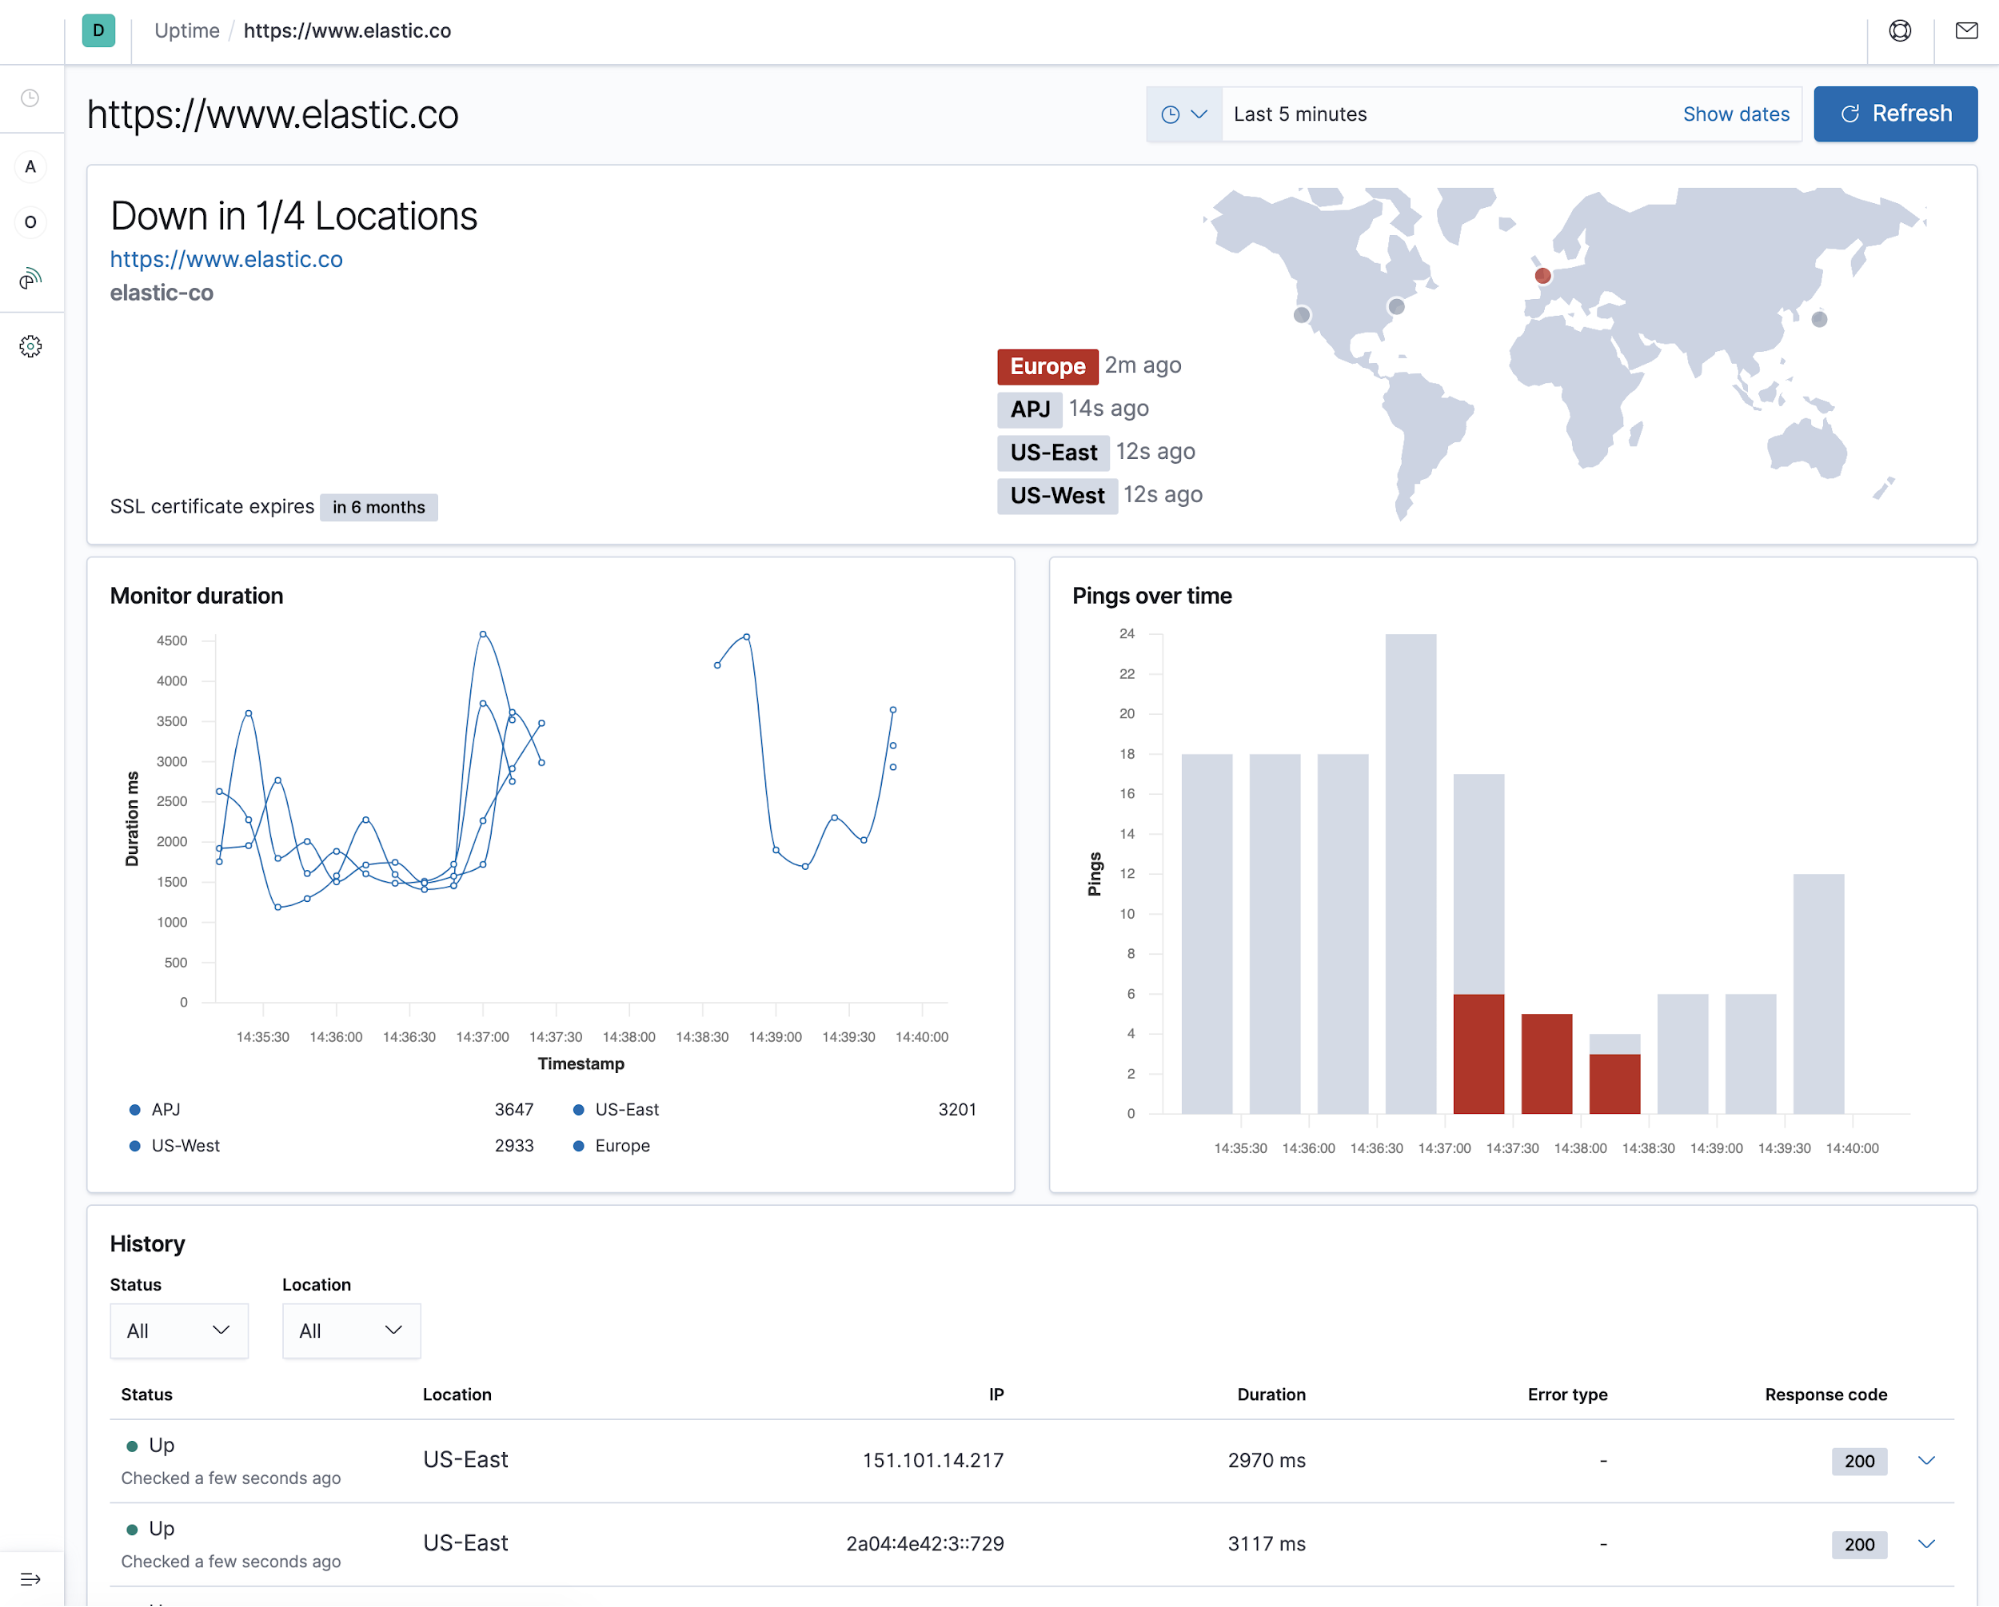
Visualizing globally distributed uptime checks
Elastic Uptime has gained popularity as a no-frills way to understand availability of your websites and services using active checks. In 7.6, the addition of world map to the Uptime UI enables visualization of user-perceived performance on a global scale. Our new world map allows an at-a-glance way to see the status of your monitors without having to dig into individual test results.
Learn about this and other new features in the Elastic Uptime blog post.
APM + SIEM = <3
Organizations are looking for more ways to share data between observability and security teams. With the Elastic Stack being a common platform for both, our users already benefit from every data point being “just another index” in an open data platform. In earlier releases, we added integration between Elastic Metrics and Elastic Endpoint, allowing users to take advantage of the Inventory view on top of their endpoint data.
In 7.6, we take the value of the common data platform further by introducing a dedicated integration for sharing data between APM and SIEM applications. HTTP data collected with your APM agents will now be available in the SIEM app. This will enable you to look for security threats in your APM data. We also included SIEM detection rules that can run against this data and apprise you when a security threat is detected. These rules can help iIdentify requests with suspicious User-Agent strings, unauthorized HTTP methods, or suspicious combinations of methods and responses.
Learn about what’s new in Elastic Security in the Elastic Security 7.6 blog post.
Get started today
Want to give Elastic Observability a spin? Check out our latest version with a free 14-day trial of our Elasticsearch Service on Elastic Cloud or install the latest version of the Elastic Stack.