Elastic SIEM 7.4.0 released
Editor’s Note — August 19, 2020: The Elastic SIEM solution mentioned in this post is now referred to as Elastic Security. The broader Elastic Security solution delivers SIEM, endpoint security, threat hunting, cloud monitoring, and more. If you're looking for more specific information on Elastic Security for SIEM use cases, visit our SIEM solution page.
We introduced Elastic SIEM as a beta in version 7.2, and we are already seeing strong adoption and receiving positive feedback from our community. Five weeks later, we released version 7.3, and now in 7.4, we have even more to share.
If you’d like to give Elastic SIEM a try, version 7.4 is available on our Elasticsearch Service on Elastic Cloud, and for download in the default distribution of the Elastic Stack.
Where in the world are my SIEM events coming from?
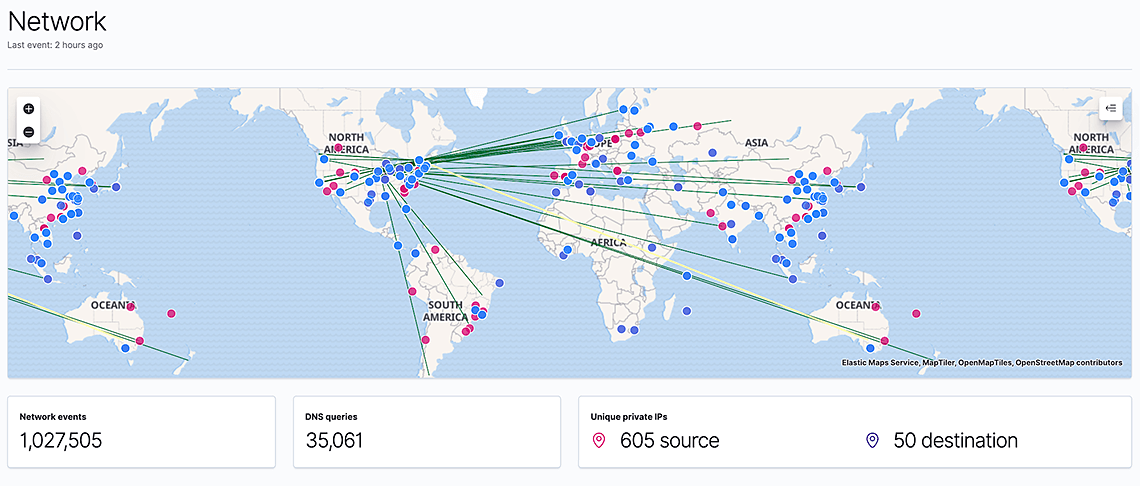
When looking at network data, being able to visually see where IP addresses are located provides valuable context for an investigation. Following our integration with Elastic machine learning features in 7.3, we integrated a map from the Elastic Maps app in 7.4 to allow that. Placed at the top of the Network page, it shows where in the world any geolocated source and destination IPs are, and any connections between them.
The map responds to the global date and query filters, allowing you to filter down on specific devices, protocols, or other attributes. Filtering on event types such as alerts and attacks turns it into an effective alert or cyber attack map. As with all Kibana visualizations, you can narrow down the data on the entire page by clicking on any of the map points.
To enrich IP addresses with their location, you can use the geoIP processor as part of an Elasticsearch ingest pipeline or the geoIP filter plugin in Logstash. We have conveniently already updated all ingest pipelines in Filebeat modules to geolocate IP addresses by default.
Doubling down on anomaly detection
With today's data volumes and the speed at which the cybersecurity landscape of adversaries changes, it's hard to maintain an effective defense using static rule sets. Automated analysis and detection, on the other hand, can help.
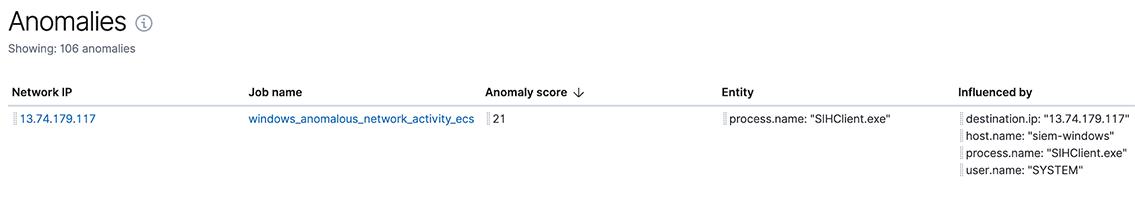
We introduced our machine learning integration into Elastic SIEM in 7.3 and shipped with three built-in anomaly detection jobs. In 7.4, we are doubling down on it and adding a further thirteen, bringing the total up to sixteen jobs.
We have developed these jobs based on real data and found meaningful anomalies with them. We hope they work well for you as well.
The new jobs focus on detecting anomalies in network connections and process executions that could indicate command-and-control, lateral movement, persistence, or data exfiltration activity. I'll describe just a few of them here:
- Anomalous network activity (Linux, Windows): Two jobs - one for Linux, one for Windows - looking for network connections by processes that do not usually use the network.
- Anomalous process (Linux, Windows): Two jobs - one for Linux, one for Windows - looking for processes started with unusual (e.g., previously not seen) executable paths or names.
- Anomalous network port activity (Linux only): Looks for network connections to unusual or rare destination ports.
- Anomalous network service (Linux only): Looks for unusual open listening ports on a host.
- Anomalous path activity (Windows only): Looks for processes started from an unusual working directory.
- Anomalous process creation (Windows only): Looks for processes started with an unusual parent process.
- Anomalous Powershell script (Windows only): Looks for unusual Powershell script contents that could indicate a malicious script.
The integration between Elastic machine learning capabilities and Elastic SIEM is extensible: You can add your own jobs to the siem job group and their anomalies will show up inside the SIEM app.
You can find a full list of built-in anomaly detection jobs in the documentation.
End-to-end support for DNS and ASN data
At Elastic, we believe in putting more data at the analyst's fingertips. So for every release, we think about what data we can add to the SIEM. In 7.4, we have significantly improved how we work with DNS and Autonomous System information.
Because of their high volume, DNS logs are often not ingested into traditional SIEMs, even though DNS is a protocol known to be used for malware command-and-control and data exfiltration, and DNS requests can often provide valuable context for an incident investigation.
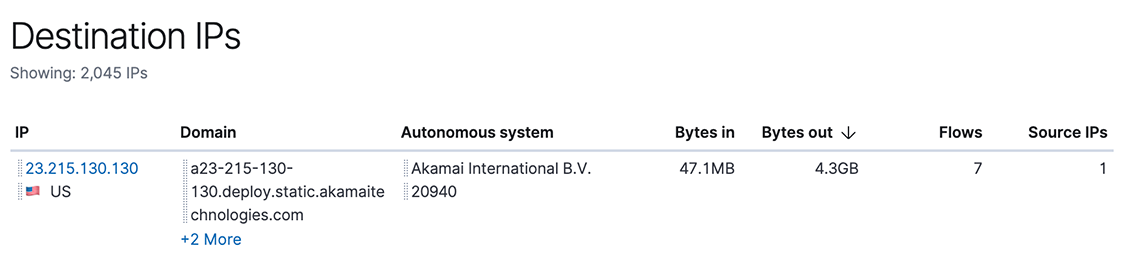
Autonomous Systems are groups of IP addresses that belong to a single entity such as GitHub, for example. Knowing if an IP address you are seeing in your data belongs to a well known and respected organization, rather than a hosting service that anybody (including adversaries) can use, allows you to quickly determine if something is worth investigating further.
To get these two pieces of data into Elastic SIEM, we first defined common field names in the Elastic Common Schema (ECS). We agreed on storing DNS data in a dns object, and autonomous system data in an as object (see ECS documentation for DNS and Autonomous System for the details).
We then updated Packetbeat, Filebeat, and Winlogbeat to populate these fields, and adjusted the queries used by the SIEM app. As a result, there are now multiple places in the SIEM app that give you additional context about an IP address that you are looking at.
Data source update: sockets, CEF, NetFlow, and Cisco FTD
Work on adding more built-in data sources continues. In 7.4, we have added several modules that we hope prove useful to you.
The rewritten Auditbeat Socket dataset now collects data using Linux KProbes. This way, it can report all - even short-lived - sockets, while consuming fewer system resources than Auditd. In addition to collecting source and destination IPs and ports, it also collects information about the user, the process, and byte and packet counts. Having all this information is very exciting - it connects host and network data. For example, you might discover that the same user that triggered an alert in your firewall also logged in to a server at an unusual time - indicating a compromised user account.
Filebeat has new and improved support for several data sources:
- Common Event Format (CEF) - A new module and
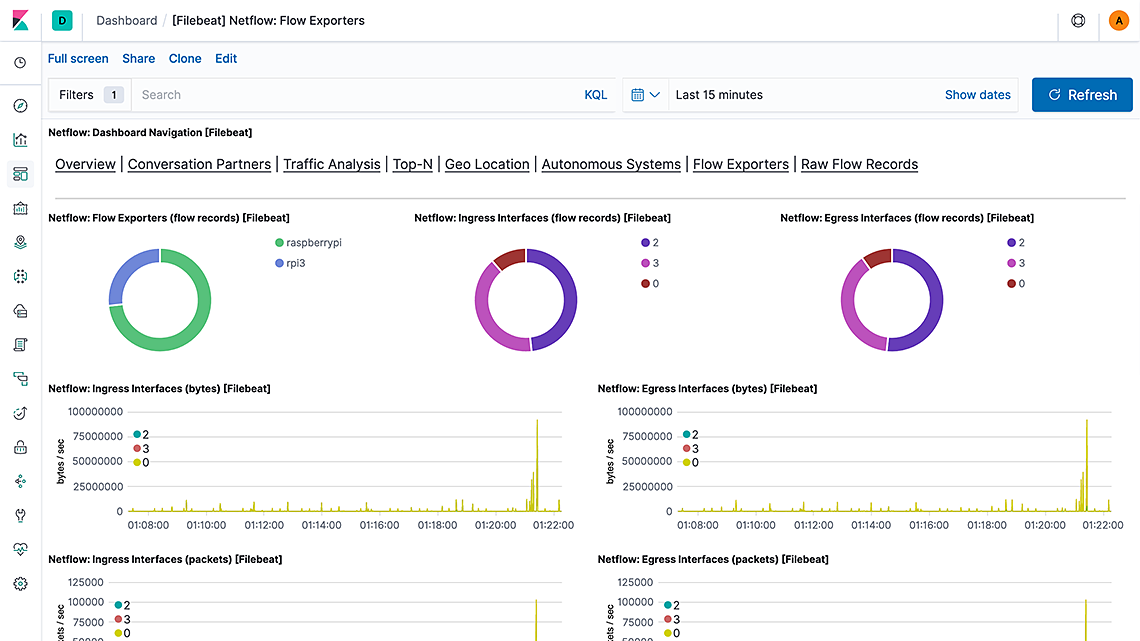
decode_cefprocessor to parse CEF messages from tools such as ArcSight and translate them into the Elastic Common Schema (ECS). - NetFlow - The module now comes with built-in dashboards. This closes the feature gap relative to the older Logstash NetFlow module which did not support ECS and is now deprecated.
- Cisco Firepower Threat Defense (FTD) - This new fileset parses IPv4 and IPv6 access list log messages as well as Security Event Syslog Messages for Intrusion, Connection, File and Malware events. It sits alongside the existing Cisco ASA and IOS filesets.
Get started today
If you haven’t tried Elastic SIEM yet, feel free to spin up a cluster on our Elasticsearch Service or install the latest version of the Elastic Stack.
If you already have Elastic Common Schema (ECS) data in Elasticsearch, just upgrade your cluster to 7.4 and click on SIEM in Kibana’s left hand side navigation bar.
To simplify your getting started journey, we have some great material to get you started:
-
Elastic SIEM solutions page: https://www.elastic.co/products/siem
-
Elastic SIEM documentation: https://www.elastic.co/guide/en/siem/guide/current/index.html
-
Elastic SIEM community forum: https://discuss.elastic.co/c/siem
-
Elastic SIEM webinar recording: https://www.elastic.co/webinars/introducing-elastic-siem