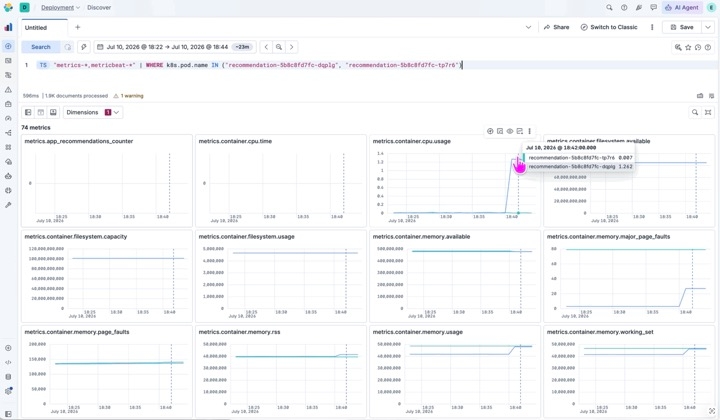
Four clicks from alert to root cause: how Elastic Observability links APM services to Kubernetes infrastructure
Check service dependencies and compare per-pod CPU, memory and network trends on the Infrastructure tab to find which instance is causing trouble, all without leaving the alert investigation.
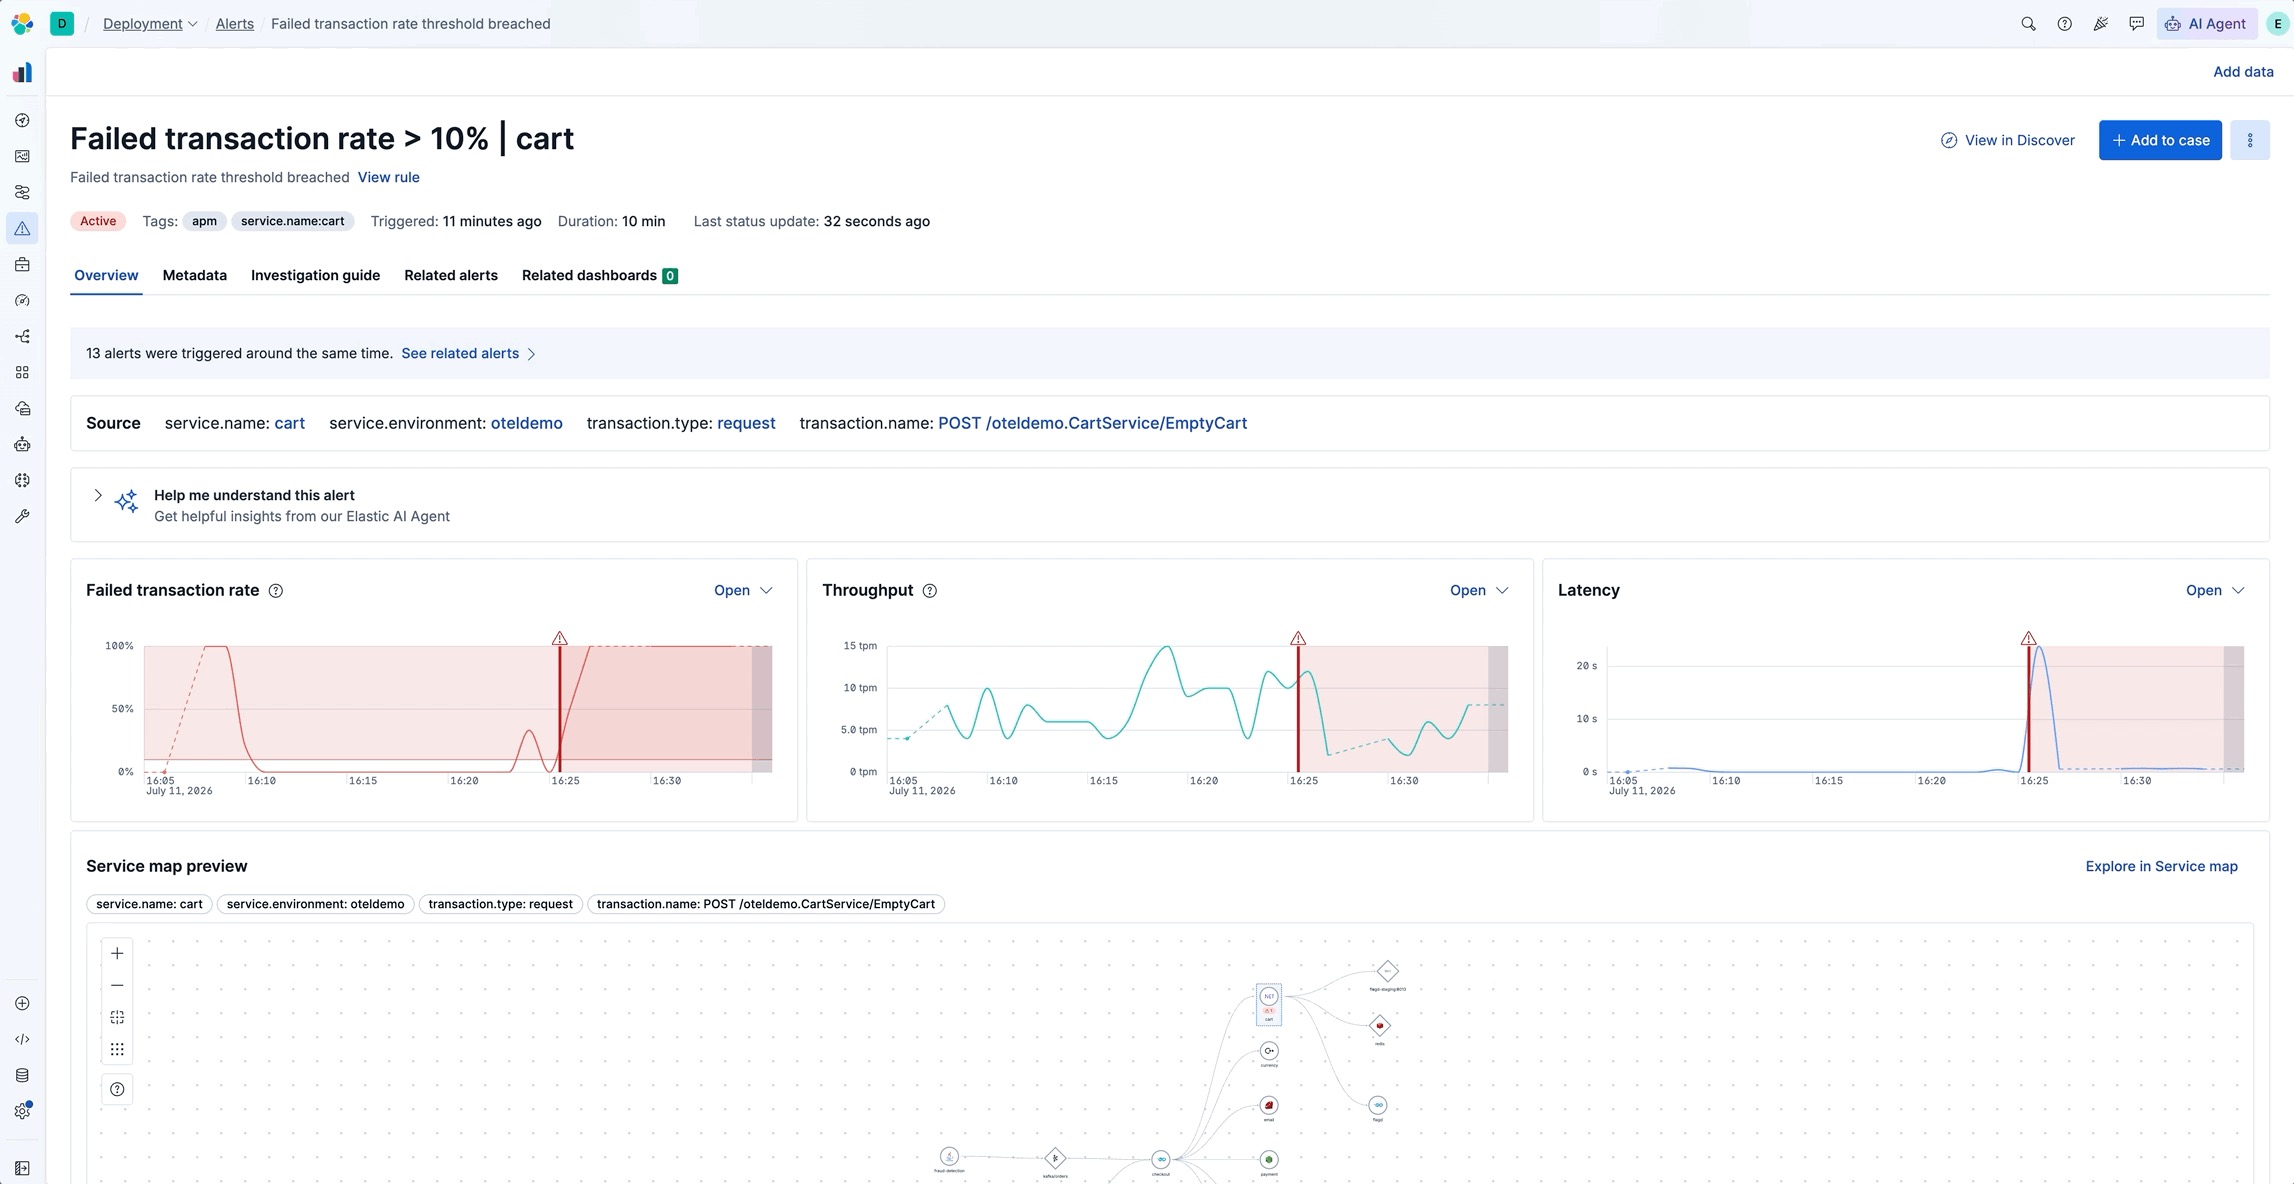
Three clicks from alert to error log: breaking down RED metrics by any span attribute in Elastic Observability
See which pod, deployment or version is driving a RED metrics change by breaking down span attributes in Discover, then trace a failing span to the error log behind it.
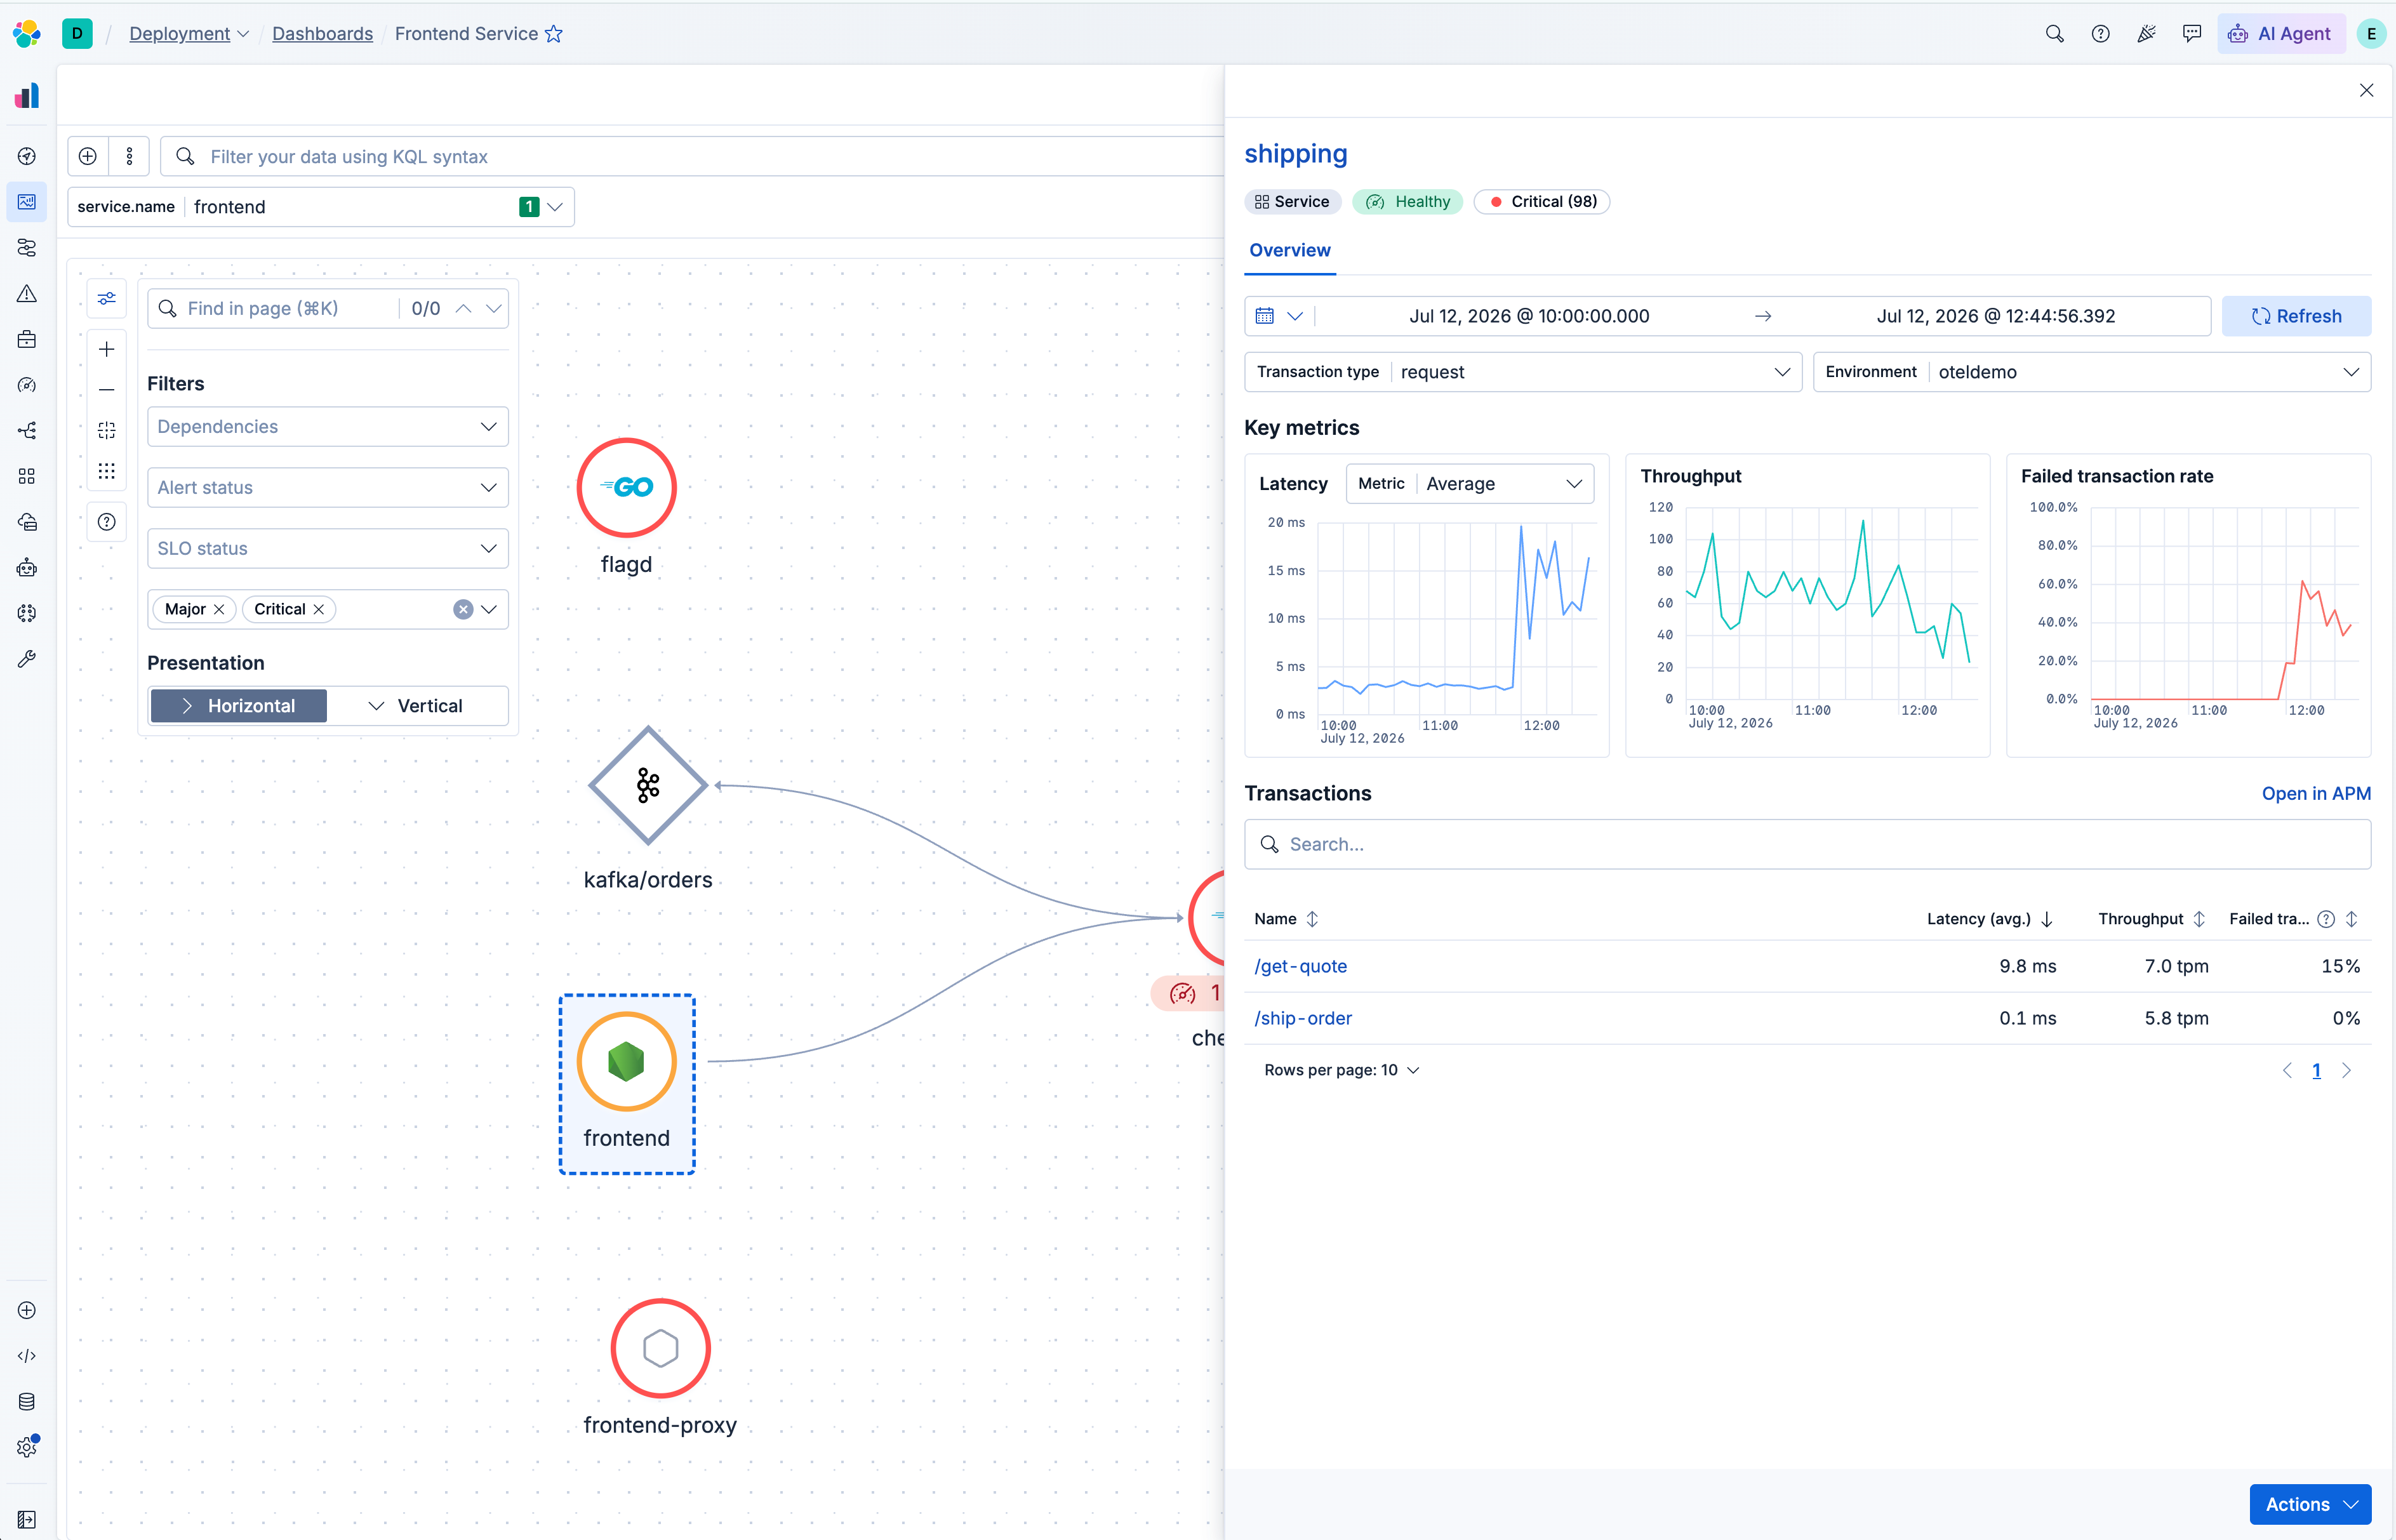
From alert to failing dependency in four clicks: Elastic APM's embedded service map
The APM service map is now embedded on alert pages with filters, connection metrics and a service fly-out so you can analyse dependencies and find the root cause without leaving the alert.
How Elastic cut OpenTelemetry tail sampling memory by 65% with disk-backed trace storage
Elastic contributed two features upstream to the OTel Collector's tail sampling processor. The span-ingest strategy lets sampling decisions happen earlier, and Pebble tail storage moves trace buffering to disk. It costs more CPU, but operators can raise decision_wait and num_traces without OOM kills.

Common ES|QL queries for Kubernetes monitoring
Copy-paste ES|QL queries for Elasticsearch that turn memory pressure and error spikes into a five-minute diagnosis.
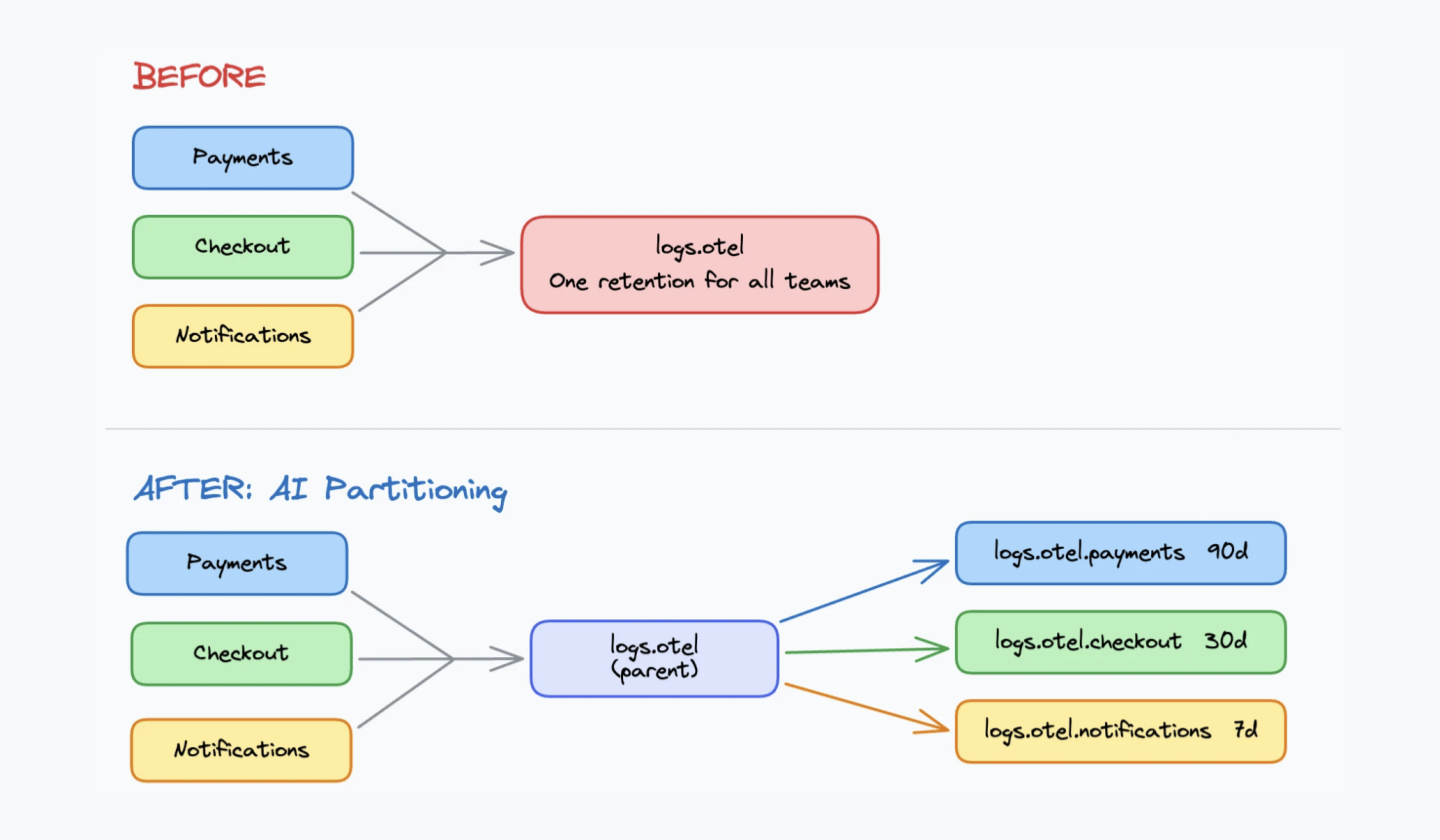
One OTLP endpoint, three teams, zero routing rules: Elasticsearch Streams AI Partitioning
Stop writing log routing rules upfront. See how Streams AI Partitioning reads your data, proposes child streams, and lets you set per-team retention in minutes.
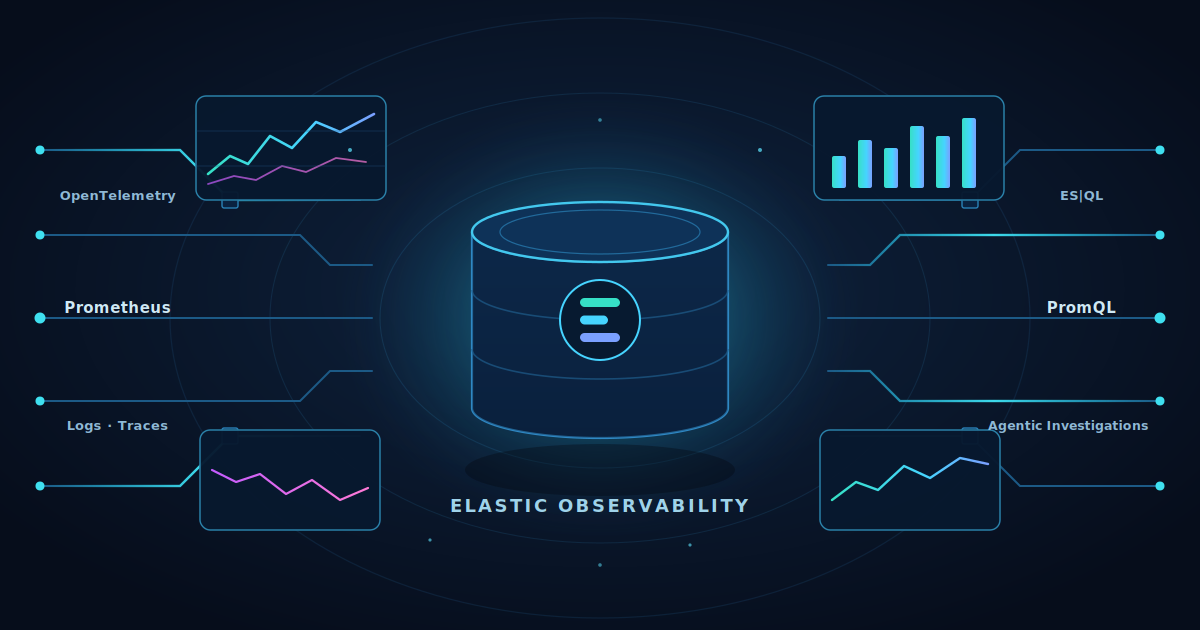
Elasticsearch: best-in-class for logs, now best-in-class for metrics
Elasticsearch is now best-in-class for metrics: 30× faster than Prometheus, up to 2.5× more storage-efficient, 50% less than Datadog. Learn about all the capabilities we’ve added.
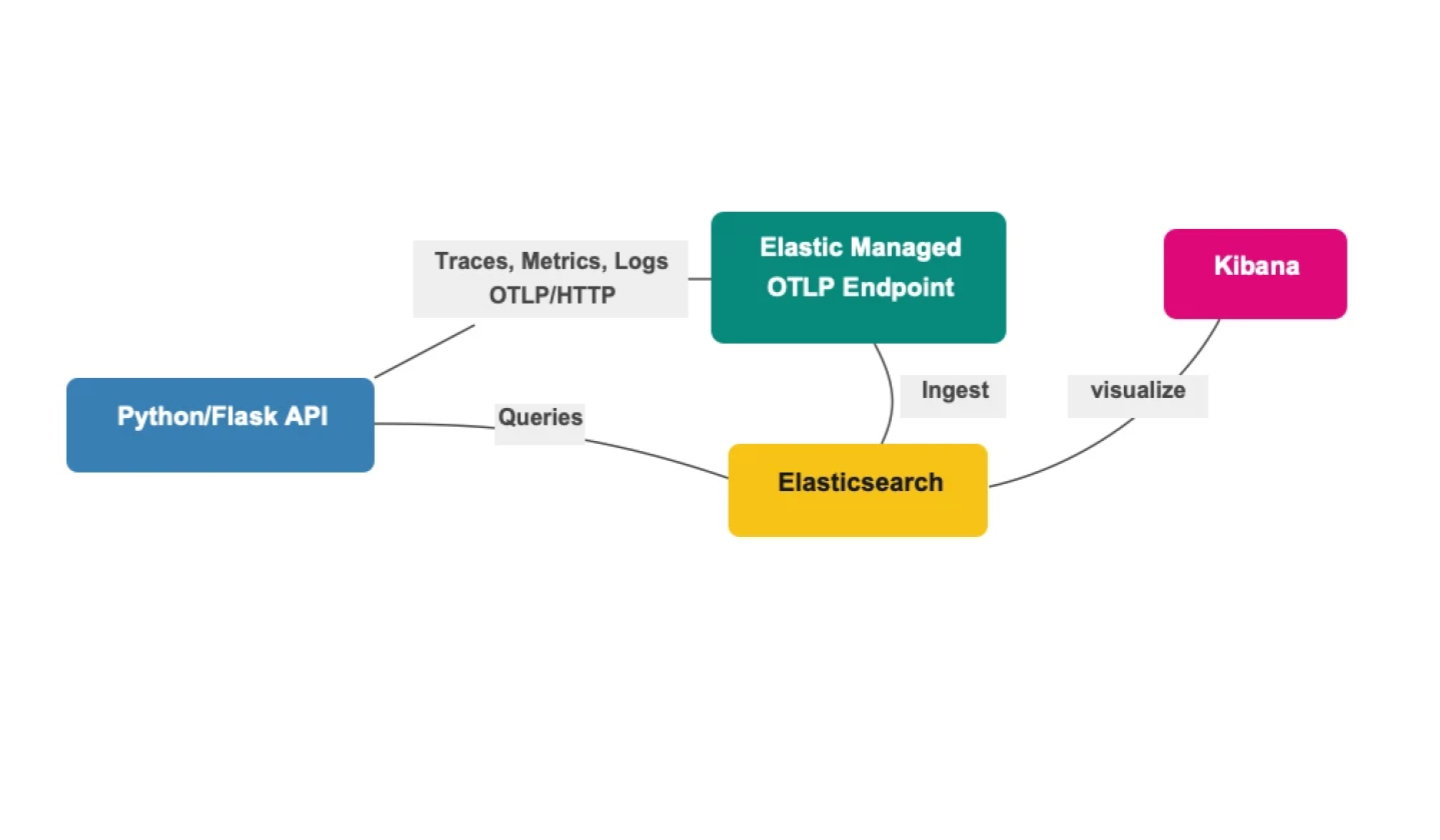
3 signals, 2 env vars, 0 collectors: OpenTelemetry with Python and Elastic's Managed OTLP Endpoint
Instrument a Flask API with OpenTelemetry and ship traces, metrics, and logs to Elastic Cloud using just 2 environment variables, no collector needed.
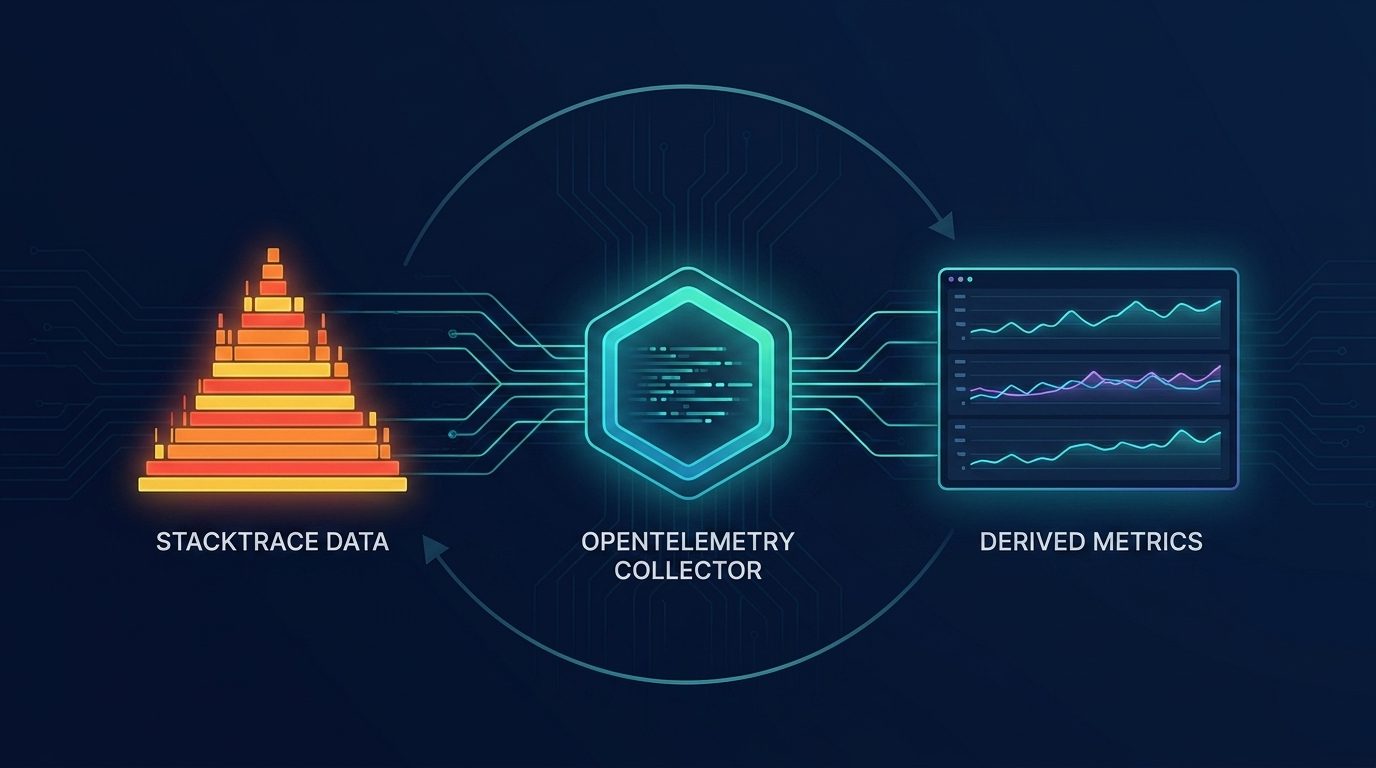
Self-Driving Observability: From Stacktraces to Profiling-Derived Metrics
Profiling-derived metrics turn raw stacktraces into time-series KPIs, unlock continuous profiling for every user and lay the foundation for an observability system that detects, investigates, and acts on its own.
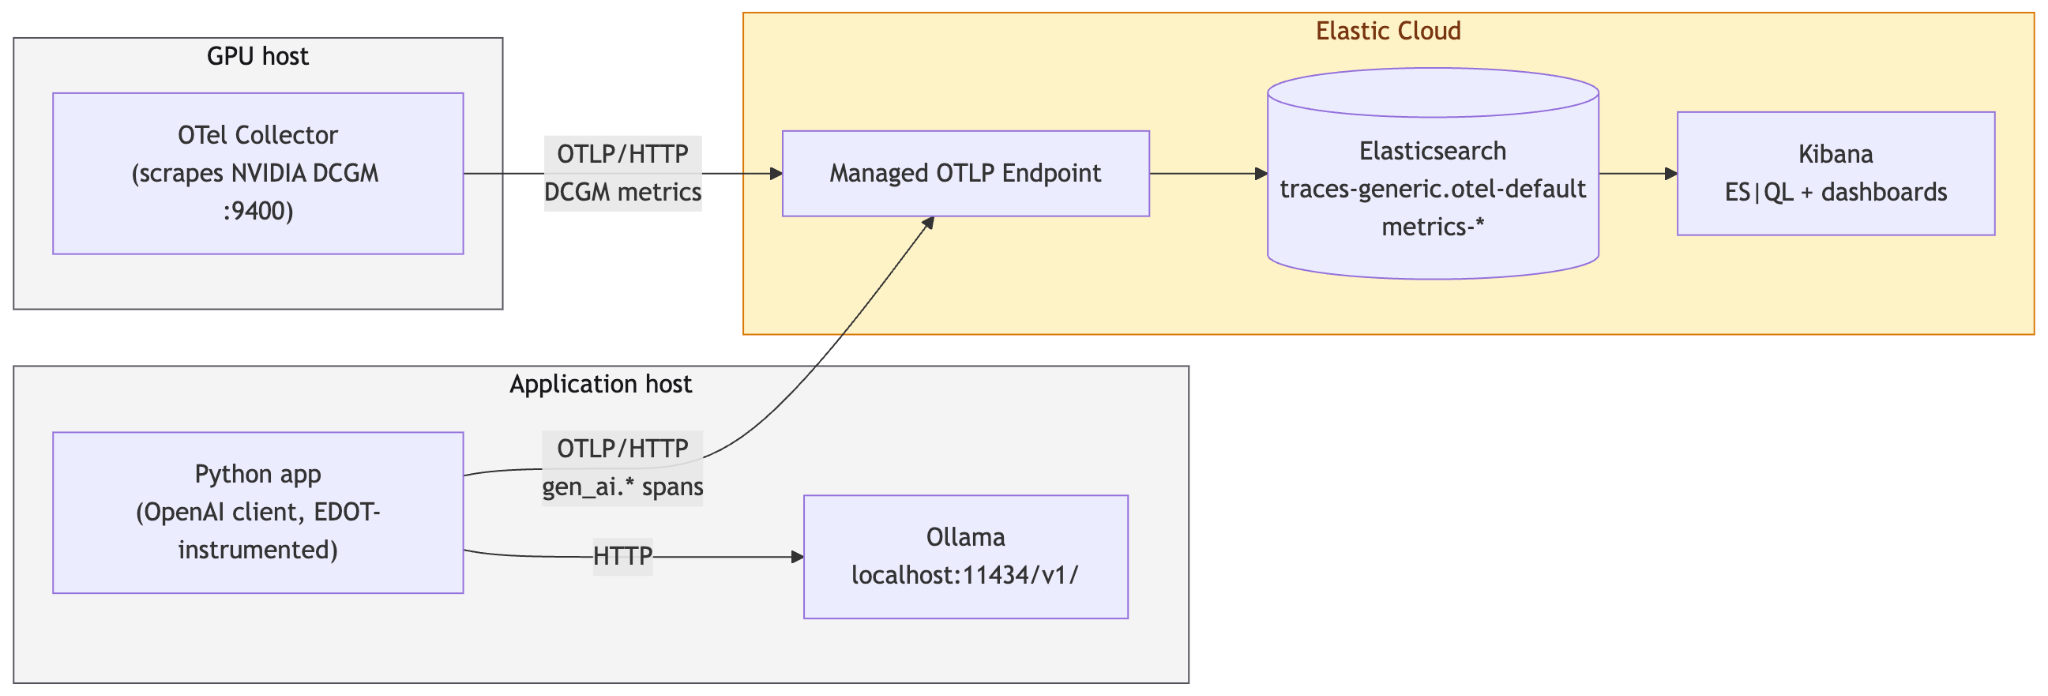
ES|QL queries for debugging LLM latency, cost and GPU saturation
Learn how to investigate LLM latency, token cost and GPU saturation using ES|QL against OpenTelemetry traces and get a root cause, not just a symptom.

30x faster than Prometheus: how we rebuilt Elasticsearch as a leading columnar metrics datastore
Elasticsearch now stores OTel metrics at 3.75 bytes per data point and queries them up to 30x faster than Prometheus. Here's how we rebuilt TSDS and ES|QL.

How Elastic's ML and AI Assistant cut 802.1x triage from 20 minutes to seconds in the NOC
Find out how Network Operations Center (NOC) teams use Elasticsearch, ML, and the Elastic AI Assistant to cut MTTR, tame alert fatigue, and solve network issues fast.