Elastic SIEM for home and small business: Getting started
Note: The “SIEM for home and small business” blog series contains configurations relevant to the beta release of Elastic SIEM using Elastic Stack 7.4. We recommend using Elastic Stack 7.6 and newer, as Elastic SIEM was made generally available in 7.6. Please also note the Elastic SIEM solution mentioned in this post is now referred to as Elastic Security.
With the increase in cyber attacks and data breaches, we’re told to be vigilant in regards to keeping sensitive data safe. But when it comes to cybersecurity, being proactive is just as important. Knowing what is happening to our information systems helps us identify how we should improve our information security posture. This is why security analytics are important.
For medium to large businesses, cybersecurity requires a budget, adequate staff, and appropriate tools to protect and defend against cyber attacks. These tools include a security information and event management (SIEM) solution to analyze logs from devices in their environment. But for small businesses and homes, having access to effective security analytics can come at a high cost of either time or money. Well, until now.
Introduced in 7.2, Elastic SIEM is a great way to provide security analytics and monitoring capabilities to small businesses and homes with limited time and resources. It’s also great for large businesses, but for the sake of this blog series, we’re going to stay focused on smaller implementations.
In this Elastic SIEM for home networks and small business blogs series, we’ll cover two use cases:
- A small business with 15 employees that normally work in a centralized office, where employees also have remote access
- A home user, who is also an “IT guru,” that monitors security at home and also helps out family members (including relatives who do not live nearby)
To make this as simple as possible, we will use the Elasticsearch Service. You’ll be able to spin up a free 14-day trial if you don’t already have a cluster. It is worth noting that in Elasticsearch Service, your cluster is referred to as a deployment. Alternatively, you can install the Elastic Stack locally, since Elastic SIEM is free with our default distribution — but this blog won’t cover that install.
Meet Elastic SIEM
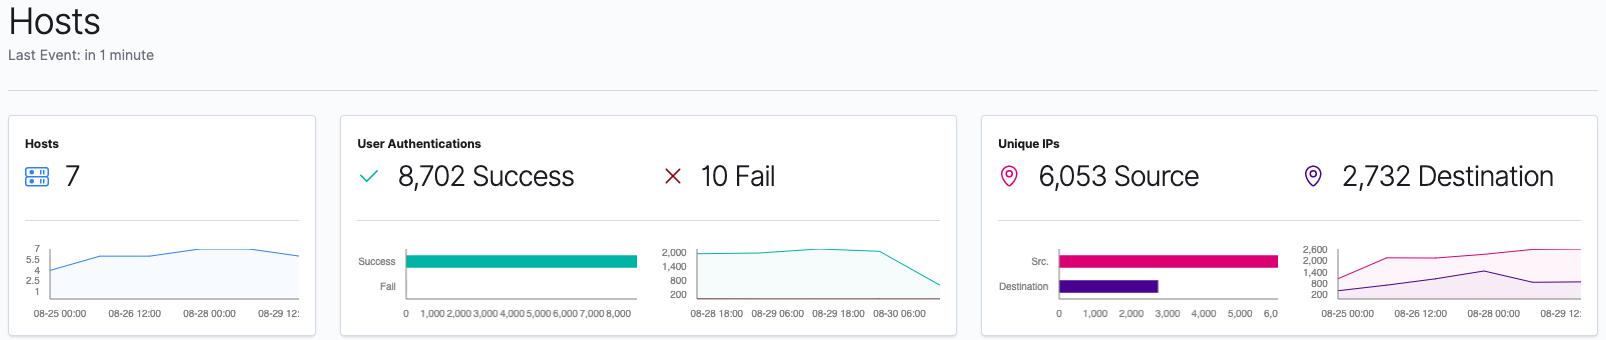
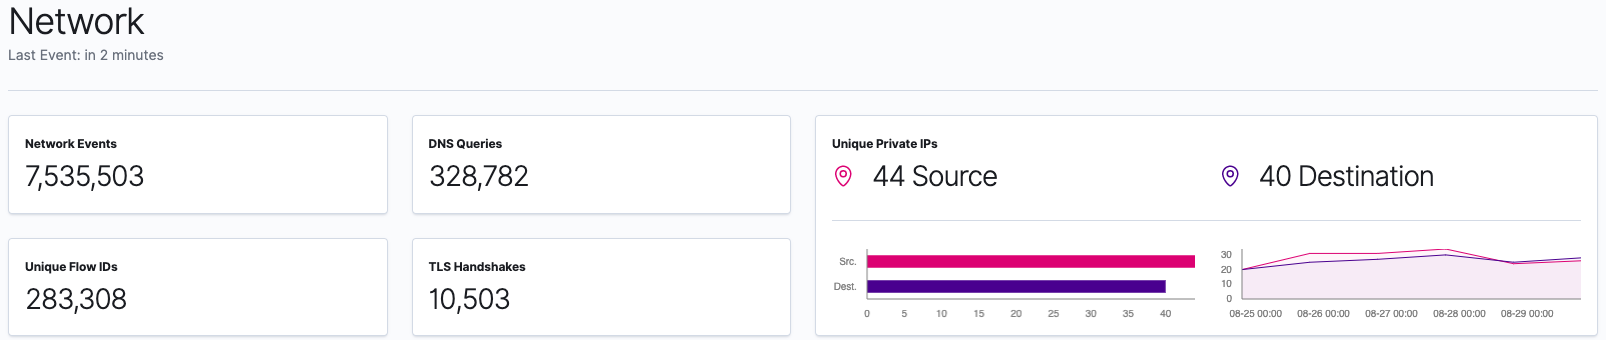
As we go through the blog series and add devices to our Elasticsearch Service deployment, we will be able to see data in the new SIEM app. Here is an example of the Hosts and Network pages from an environment with seven systems:
As we go through the series, we will walk through how to collect data from different devices and ship them to our Elasticsearch Service deployment. Over the next few posts, we’ll explore that data within Elastic SIEM. Our goal is to cover the following topics:
- Adding GeoIP data to our network events
- Securing access to our Elastic cluster
- Configuring data collection from Windows and Linux devices
- Collecting firewall and DNS Server data
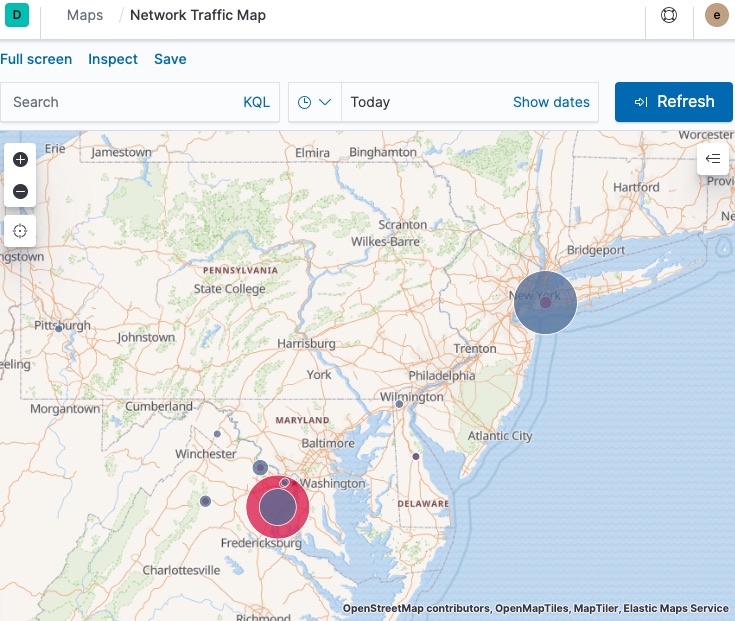
- Visualizing GeoIP data in Elastic Maps. We will also leverage the Elastic Maps app for more advanced visualizations of our data (even though version 7.4 of the Elastic Stack includes maps in the SIEM app).
- Configuring additional data sources and tackling more advanced use cases
Here’s an example of one of the visualizations that you’ll be able to create after running through these blogs:
Ok, let’s learn more about the environments of our two use cases, create our Elasticsearch Service deployment, and finalize a few technical items that will be relevant. Once our Elasticsearch Service deployment is ready, we will go over the process of configuring data collection from our workstations, laptops, and network devices in follow-up blogs in this series.
Identifying our data collection needs
Before we download, install, or configure anything, we need to determine our data collection needs. We also need to determine our GeoIP data so we will be able to leverage maps capabilities in either the Elastic SIEM app or the Elastic Maps app. For devices in scope, we will include all desktop computers and laptops, and also include the Windows and Linux servers our small business has.
For data collection from our servers, workstations, and laptops, we will use some of the Elastic Beats applications. We need to collect log files, activities of users and processes, and network data. We need to determine which of the Beats applications meet our needs, since our use cases have both Windows and Linux devices. At a high level, here is an overview of each of the Elastic Beats:
- Auditbeat - Audit the activities of users and processes (mainly for Linux systems)
- Filebeat - Monitors the log files or locations that you specify, collects log events
- Heartbeat - Monitor services for their availability with active probing
- Metricbeat - Collect metrics from the operating system and running services
- Packetbeat - Real-time network packet analyzer
- Winlogbeat - Windows-specific event log shipping agent
Based on this overview, we will need to collect data using Auditbeat, Filebeat, Packetbeat, and Winlogbeat by downloading and configuring these data shipping applications.
The first device we will configure is a Windows computer for our small business use case, this system is located in a shared office where users sign in with their own personal account. For our home setup use case, we will start with the device my kids use. In this blog, we will configure default collection of Windows events using Winlogbeat; later on in the blog series, we will update the configuration to cover our use cases.
Regarding Beats configurations, we need to keep in mind that the configurations for Beats have shared general configurations (each with their own specific settings in addition to the general configurations), so we will use the configurations from our first system when we deploy Beats to our other systems.
Now that we have determined our initial data collection needs, we can create our Elasticsearch Service deployment.
Creating our Elasticsearch Service deployment
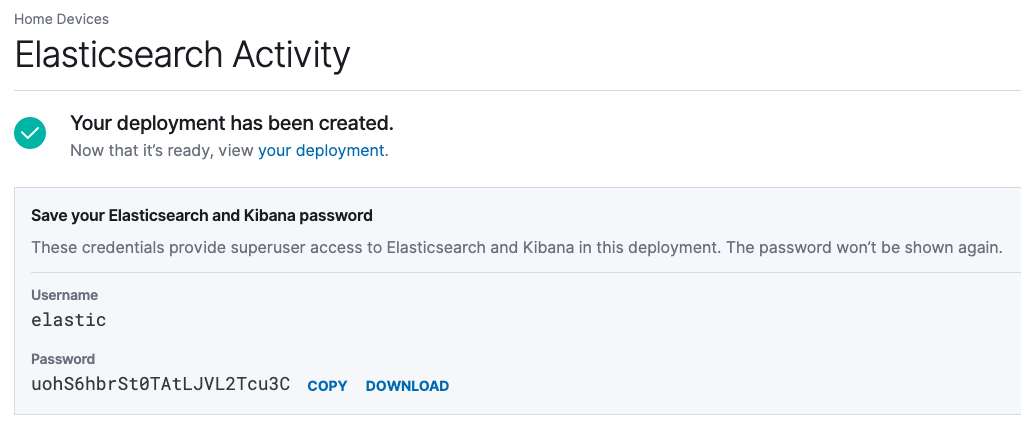
First, we will sign up for Elasticsearch Service and create our first deployment. We will start the 14-day free trial that starts the moment we create our cluster. It is worth noting that in Elasticsearch Service, your cluster is referred to as a deployment. Upon logging in and launching our trial successfully, we will create our first deployment, select our cloud platform, and select a region. Next, we will select the latest available version, then select I/O Optimized, then we will click ‘Create deployment’. During deployment creation, we’re given the credentials to access Elasticsearch and Kibana. Save these credentials locally for future use.
| If you are already a non-trial Elasticsearch Service user, you have access to hot-warm templates during deployment. Hot-warm is the recommended deployment model for Elastic SIEM. As your deployment grows, you should review some guidance around sizing your cluster, over time consider migrating your deployment to the hot/warm template, and review the Elasticsearch Service pricing calculator. |
Next, we click on the “your deployment” link. Since additional information is needed before configuring, we configure shipping data from our devices.
In addition to the endpoint to access the Kibana web UI, we’ll need to copy the Cloud ID as it is required to send data from Beats to our Elasticsearch Service deployment.
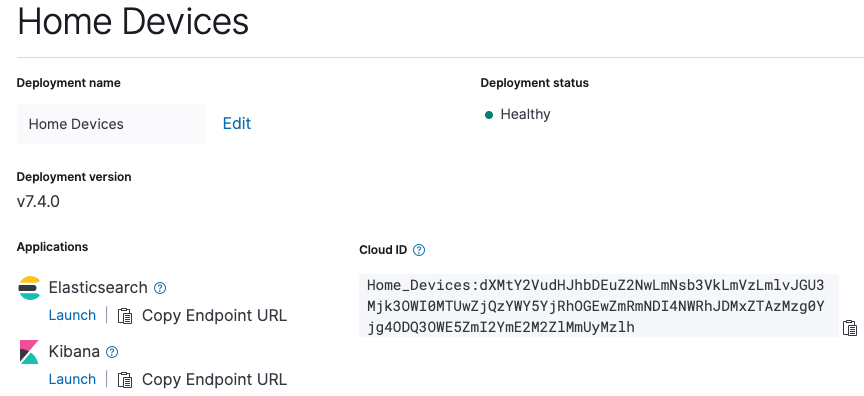
Before we configure any of our systems to send data to our Elasticsearch Service deployment, we have a few housekeeping items to take care of first. Let’s first make sure we have our elastic superuser credentials and our Cloud ID.
Determining our GeoIP data
Before we install and configure Beats, we’ll want to decide whether we’re going to add GeoIP data to each of the Beats configurations, since we will use this data in the configuration files. For the purpose of the blog, our small business (or home) is in New York City, our location is 40.7128 latitude and -74.0060 longitude, our continent is North America, our country’s ISO code is US, our region name is New York, and our region ISO code is US-NY.
With that said, the GeoIP information for our hosts will be:
processors:
  - add_host_metadata:
      netinfo.enabled: true
      Geo: # These Geo configurations are optional
        location: 40.7128, -74.0060
        continent_name: North America
        country_iso_code: US
        region_name: New York
        region_iso_code: US-NY
        city_name: New York City
        name: myLocation
  - add_locale: ~
  - add_cloud_metadata: ~
  - add_fields:
      when.network.source.ip: private
      fields:
        source.geo.location:
          lat: 40.7128
          lon: -74.0060
        source.geo.continent_name: North America
        source.geo.country_iso_code: US
        source.geo.region_name: New York
        source.geo.region_iso_code: US-NY
        source.geo.city_name: New York City
        source.geo.name: myLocation
      target: ''
  - add_fields:
      when.network.destination.ip: private
      fields:
        destination.geo.location:
          lat: 40.7128
          lon: -74.0060
        destination.geo.continent_name: North America
        destination.geo.country_iso_code: US
        destination.geo.region_name: New York
        destination.geo.region_iso_code: US-NY
        destination.geo.city_name: New York City
        destination.geo.name: myLocation
      target: ''
While we will see this repeated in our configuration files, they are important because they allow our Beats to tell Elasticsearch where our private networks exist on a map.
Now that we have our GeoIP data ready to go, let’s start installing and configuring Beats on our first home computer.
Our initial Winlogbeat configuration
Since we’ve downloaded Winlogbeat, we will read through the Winlogbeat installation guide to get started. We’ve extracted the files to C:\Program Files\Elastic\winlogbeat-7.4.0\ (I’ve kept the version number in the folder name for my own version control) and have opened an Administrative PowerShell session. We’ll install the service by issuing the .\install-service-winlogbeat.ps1 command (shown below).
After installing Winlogbeat, do not start the service until we finish initial configuration.
PS C:\> cd C:\Program Files\Elastic\winlogbeat-7.4.0\
PS C:\Program Files\Elastic\winlogbeat-7.4.0> .\install-service-winlogbeat.ps1
Security warning
Run only scripts that you trust. While scripts from the internet can be useful,
this script can potentially harm your computer. If you trust this script, use
the Unblock-File cmdlet to allow the script to run without this warning message.
Do you want to run C:\Program Files\Winlogbeat\install-service-winlogbeat.ps1?
[D] Do not run  [R] Run once [S] Suspend  [?] Help (default is “D”): R
Status   Name           DisplayName
------   ----           -----------
Stopped  winlogbeat         winlogbeat
PS C:\Program Files\Elastic\winlogbeat-7.4.0>
Error: cannot be loaded because running scripts is disabled on this system
| Note: If you receive a .\install-service-winlogbeat.ps1 : File C:\Program Files\Elastic\winlogbeat-7.4.0\install-service-winlogbeat.ps1 cannot be loaded because running scripts is disabled on this system. error, you will need to issue the Unblock-File command against the install-service-winlogbeat.ps1 file, as shown below, before issuing the .\install-service-winlogbeat.ps1 command. |
PS C:\Program Files\Elastic\winlogbeat-7.4.0> .\install-service-winlogbeat.ps1
.\install-service-winlogbeat.ps1 : File C:\Program Files\Elastic\winlogbeat-7.4.0\install-service-winlogbeat.ps1
cannot be loaded because running scripts is disabled on this system. For more information, see
about_Execution_Policies at https:/go.microsoft.com/fwlink/?LinkID=135170.
At line:1 char:1
+ .\install-service-winlogbeat.ps1
+ ~~~~~~~~~~~~~~~~~~~~~~~~~~~~~~~~
    + CategoryInfo          : SecurityError: (:) [], PSSecurityException
    + FullyQualifiedErrorId : UnauthorizedAccess
PS C:\Program Files\Elastic\winlogbeat-7.4.0> Unblock-File .\install-service-winlogbeat.ps1
PS C:\Program Files\Elastic\winlogbeat-7.4.0>
Sysmon module
Generally, we would use the Sysmon module in Winlogbeat, which requires that we install Sysinternals System Monitor (Sysmon). Note that Sysmon is not bundled with Windows or Winlogbeat and must be installed independently. The installation of Sysmon and configuration of the Sysmon module will be covered in a later blog.
Updating the Winlogbeat configuration
Once Winlogbeat is installed on this Windows computer, we will update the configuration file and initialize/setup Winlogbeat to ship to Elasticsearch Service (using our Cloud ID). We will also update the configuration file to include additional metadata to identify this computer. For authentication to our Elasticsearch Service deployment, we will use the default elastic superuser account; please note the format is “username:password” in the configuration file. In a later blog, we will update this to use an account with more restricted access and limit the use of our superuser account.
With that said, here is what I have set in winlogbeat.yml for our initial configuration:
#=== Winlogbeat specific options ===
winlogbeat.event_logs:
  - name: Application
    ignore_older: 72h
  - name: System
  - name: Security
    processors:
      - script:
          lang: javascript
          id: security
          file: ${path.home}/module/security/config/winlogbeat-security.js
#=== General ===
name: KidsPC
tags: [“Home”, “KidsPC”]
fields:
  env: home
#=== Top Level Processor ===
processors:
  - add_host_metadata:
      netinfo.enabled: true
      Geo: # These Geo configurations are optional
        location: 40.7128, -74.0060
        continent_name: North America
        country_iso_code: US
        region_name: New York
        region_iso_code: US-NY
        city_name: New York City
        name: myHomeLocation
  - add_locale: ~
  - add_cloud_metadata: ~
  - add_fields:
      #when.network.source.ip: 10.101.101.0/24
      when.network.source.ip: private
      fields:
        source.geo.location:
          lat: 40.7128
          lon: -74.0060
        source.geo.continent_name: North America
        source.geo.country_iso_code: US
        source.geo.region_name: New York
        source.geo.region_iso_code: US-NY
        source.geo.city_name: New York City
        source.geo.name: myLocation
      target: ''
  - add_fields:
      #when.network.destination.ip: 10.101.101.0/24
      when.network.destination.ip: private
      fields:
        destination.geo.location:
          lat: 40.7128
          lon: -74.0060
        destination.geo.continent_name: North America
        destination.geo.country_iso_code: US
        destination.geo.region_name: New York
        destination.geo.region_iso_code: US-NY
        destination.geo.city_name: New York City
        destination.geo.name: myLocation
      target: ''
#=== Elastic Cloud ===
# Use the Cloud ID to ship data from Beats to Elasticsearch Service
# /guide/en/cloud/current/ec-cloud-id.html#ec-cloud-id
# You can find the `cloud.id` in the Elasticsearch Service web UI.
cloud.id: “My_Elastic_Cloud_Deployment:abcdefghijklmnopqrstuvwxyz1234567890ABCDEFGHIJKLMNOPQRSTUVWXYZ”
# The cloud.auth format is `<user>:<pass>`
# For production, we should NOT use the elastic superuser
cloud.auth: “elastic:0987654321abcDEF” # example: “username:password”
#=== Xpack Monitoring ===
monitoring.enabled: true
As a reminder, let’s keep the settings in the General, Top Level Processor, Elastic Cloud, and Xpack Monitoring sections nearby so we can use them for configuring the other Beats. For reference, these example configurations can be found in the examples GitHub repo under Security Analytics/SIEM-at-Home. Once the file is updated, don’t forget to save the changes made to winlogbeat.yml.
Setting Winlogbeat up with Elasticsearch Service
Now that the configuration is updated with our Elasticsearch Service information and our host metadata, it is time to set up Winlogbeat with our Elasticsearch Service deployment. Running the setup command only needs to be performed once for each beat. In our Administrative PowerShell session, we’ll issue the .\winlogbeat.exe setup command then confirm we receive “Index setup finished” and “Loaded dashboards” messages (shown below).
PS C:\Program Files\Elastic\winlogbeat-7.4.0> .\winlogbeat.exe setup
Index setup finished.
Loading dashboards (Kibana must be running and reachable)
Loaded dashboards
PS C:\Program Files\Elastic\winlogbeat-7.4.0>
Running Winlogbeat as a service
Now that we’ve set up the index and loaded the dashboards, it is time to start the Winlogbeat service! In our Administrative PowerShell session, we will issue the Start-Service winlogbeat command (see below) to begin collecting the Windows application, system, and security logs from this device.
PS C:\Program Files\Elastic\winlogbeat-7.4.0> Start-Service winlogbeat
PS C:\Program Files\Elastic\winlogbeat-7.4.0> Get-Service winlogbeat
Status   Name           DisplayName
------   ----           -----------
Running  winlogbeat         winlogbeat
PS C:\Program Files\Elastic\winlogbeat-7.4.0> cd ..
PS C:\Program Files\Elastic>
We will navigate back to the C:\Program Files\Elastic folder in our Administrative PowerShell session, which we can use to continue installing and configuring Beats on this Windows device as we go through this blog series (and using the getting started guides).
Accessing our Elasticsearch Service deployment
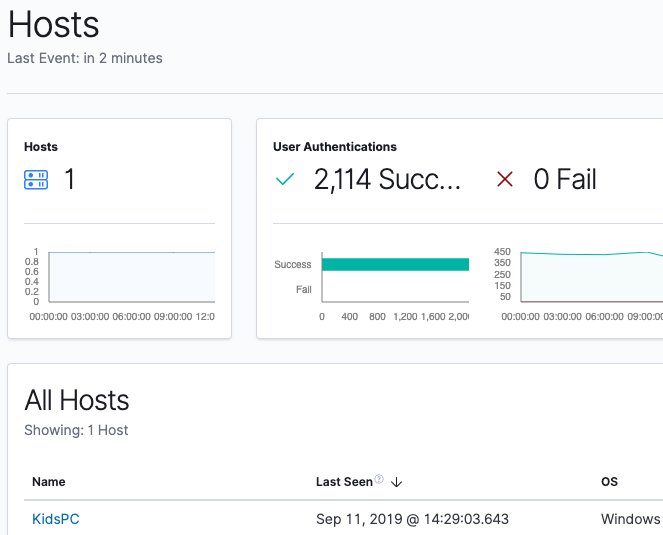
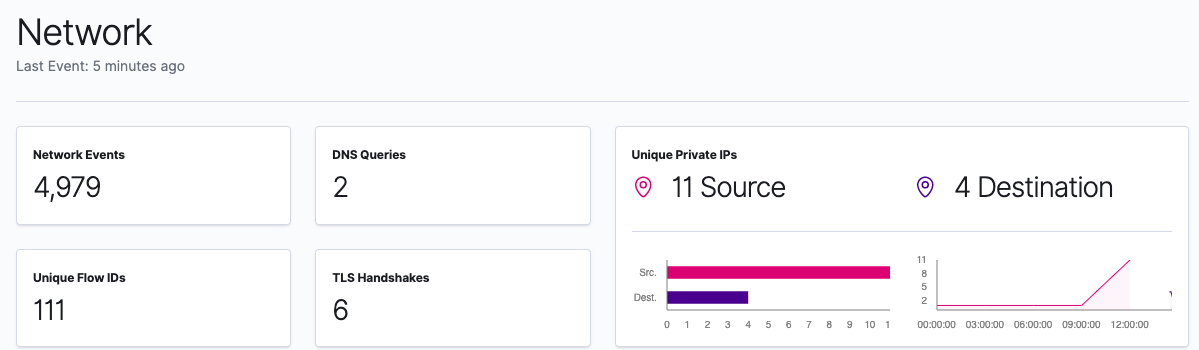
Now that we have our first data source shipping data to our Elasticsearch Service deployment, we can sign into the Kibana instance of our Elasticsearch Service deployment so we can see what data is available in the SIEM app. In Kibana, click on SIEM where we will be taken to the Overview page. Once in the Overview page, we can click on Hosts for more detail on the data populated in the SIEM app:
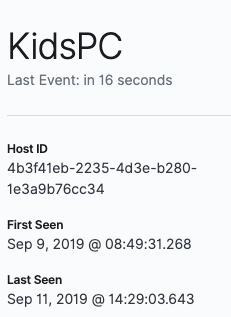
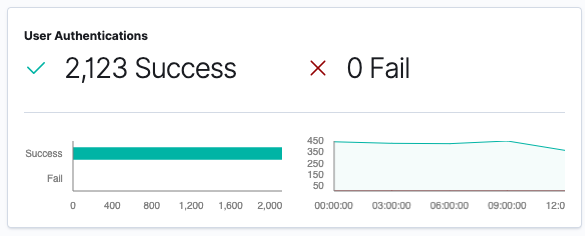
Now we’ll click on KidsPC so we can see more information specific to this system:
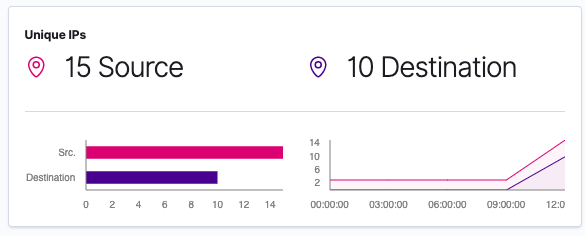
Next let’s click on the Network page within the SIEM app:
This is a great start to providing visibility into what our device is doing.
Coming up in Part 2: Securing cluster access
Our next steps are to complete a few prerequisites, which will secure access to our cluster by restricting privileges for users and Beats. Then we need to configure our cluster to enrich data with GeoIP information. After that, we will review our beats configurations. Once those items are complete, we will install and configure beats on the rest of our systems so we can see what is happening throughout our network.
Follow us through this Elastic SIEM for home networks and small business blog series as we develop a powerful, yet simple, security solution at home (or for your small business):
- Part 1: Getting started
- Part 2: Securing cluster access
- Part 3: GeoIP data and Beats config
- Part 4: Beats on Windows
- Part 5: Beats on CentOS
- Part 6: Beats on macOS
- Part 7: SIEM overview
A few last things...
If you run into any issues, the first place we’d recommend turning is to our documentation. It can help with many common issues. If you still have outstanding questions, check out our Elastic forums for additional help. Or, if you want to talk to the Elastic Support team directly, you have direct access to a team of experts if you’ve deployed on Elasticsearch Service. If you are self-hosting, you can start an Elastic subscription today and have direct access to a team of experts. Be safe out there!
To learn more, check out our What Is SIEM? Overview Guide.