
How we’re building a context engine to cut agent token use by 71%
With a context engine, the same agent and model answered in 64 seconds using 9 tool calls. The baseline took 213 seconds, 33 calls, and missed a key relationship entirely.
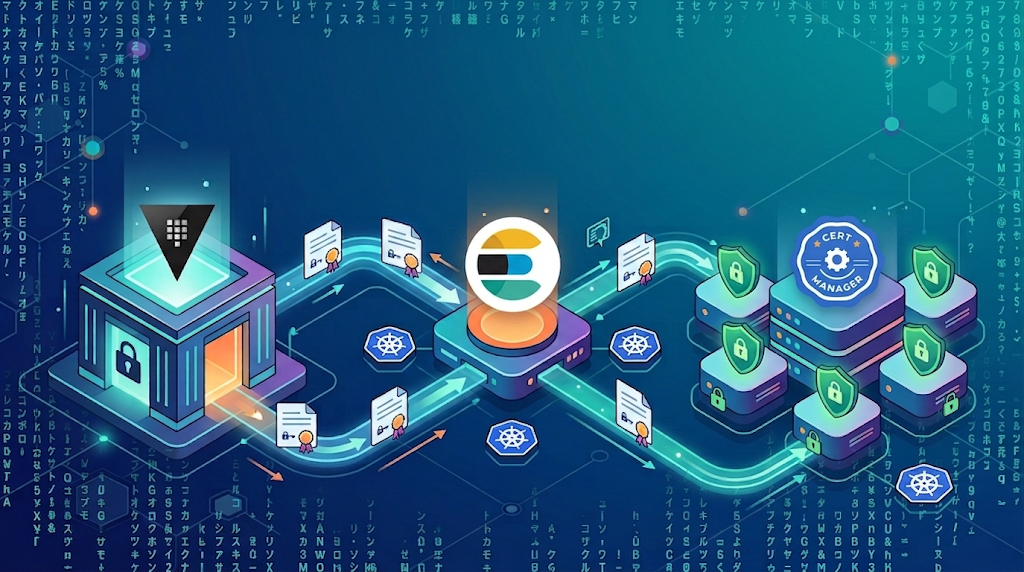
Signed, sealed, delivered: ECK certificate management with Vault and cert-manager
Replace ECK's self-signed certificates with your enterprise PKI without renewing a certificate by hand, as Vault signs with a CA key sealed outside Kubernetes and cert-manager delivers fresh certificates to every Elasticsearch pod.
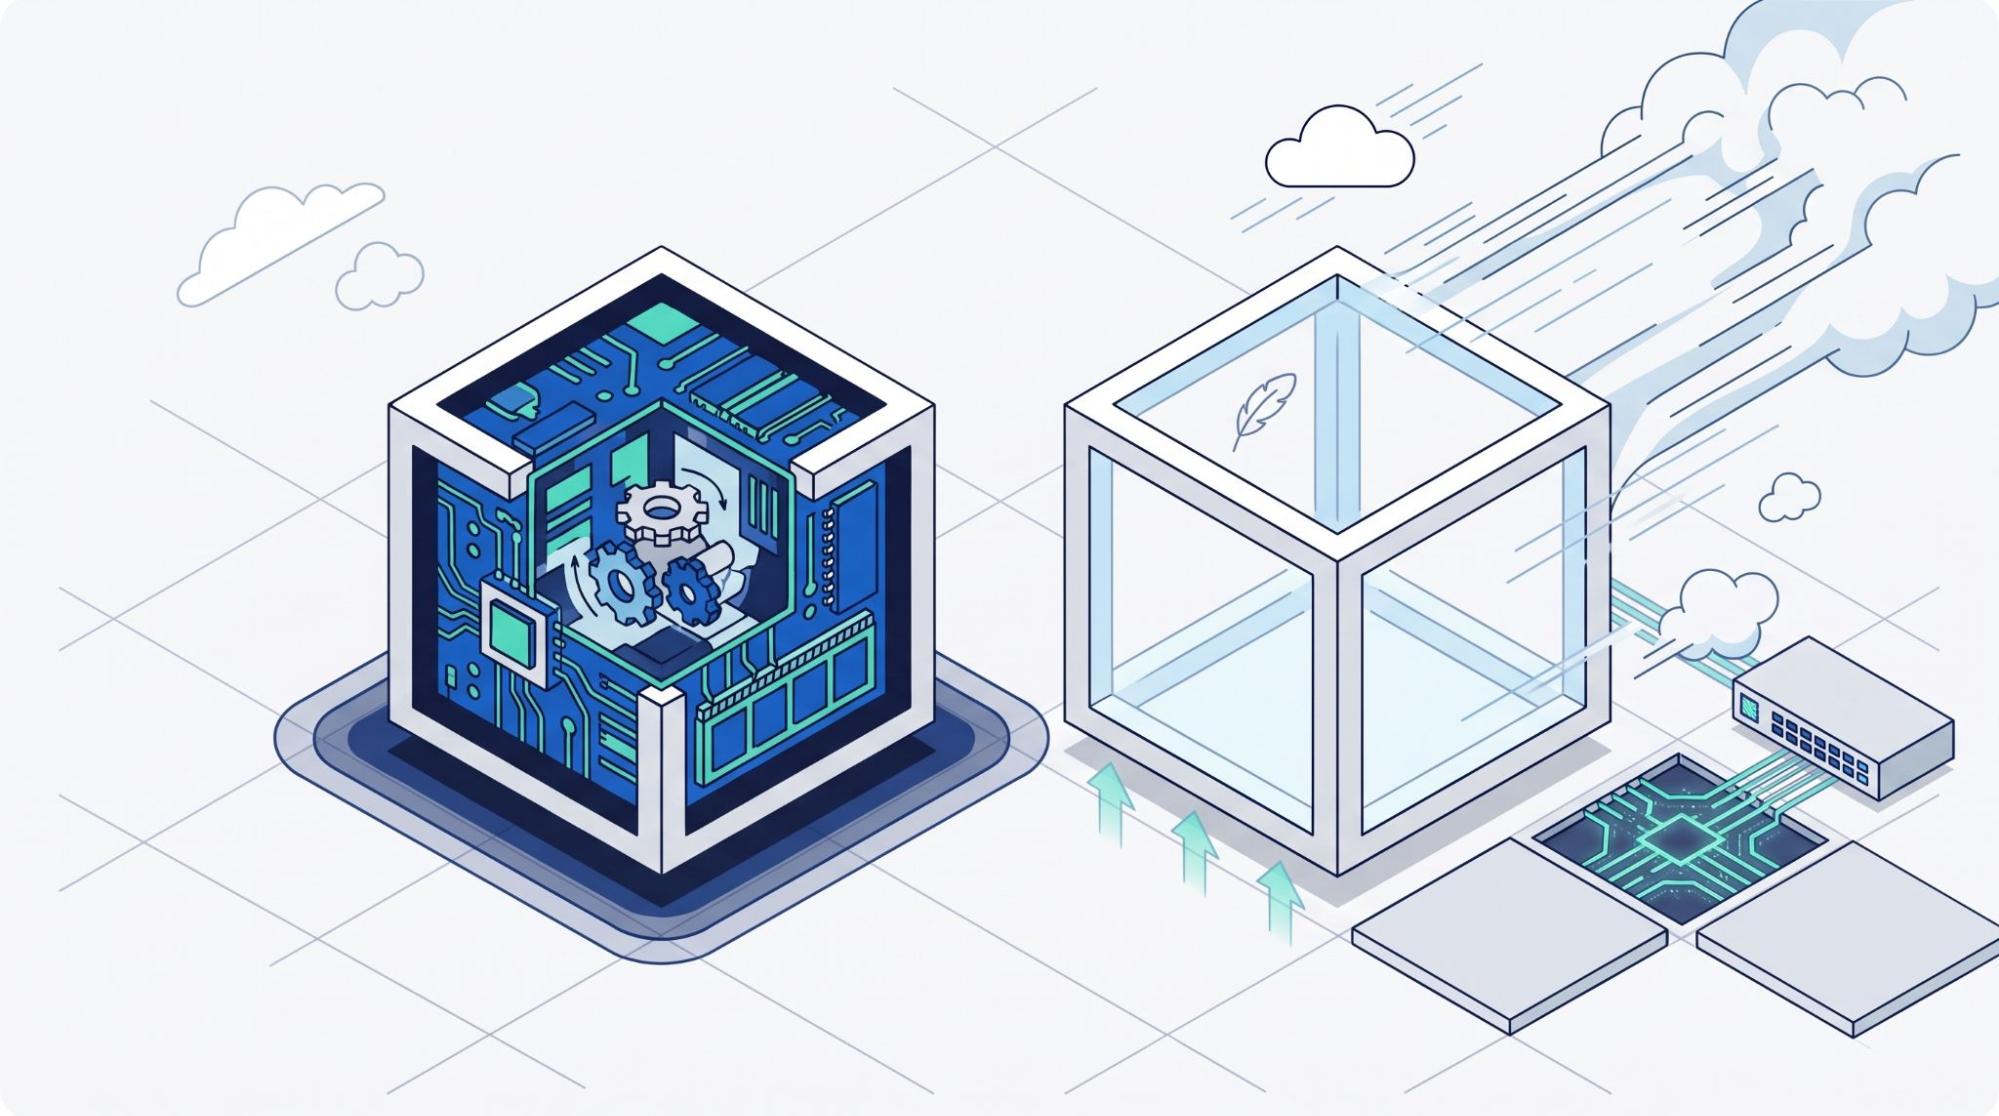
How Elasticsearch Serverless hollow shards cut indexing-node shutdowns by 30%
Idle indexing shards in Elasticsearch Serverless now drop their Lucene writers and segment readers from memory until the next write, freeing indexing-tier heap at the cost of a median 218ms wait on that first write.

Ask Elastic Agent Builder why it's slow: Natural-language trace analysis
Four agent performance questions your Agent Builder traces can answer, covering token spend by model, tool error rates, slow conversation turns, and recent prompts. The ES|QL for each is here, including the type cast SUM() needs.

Agentic workflows in Elasticsearch: pause an AI agent for human approval, resume 72 hours later
Build AI agent orchestration where the workflow waits for a human approval and then executes the fix on its own, with nothing extra to provision and the whole decision trail queryable in Elasticsearch.
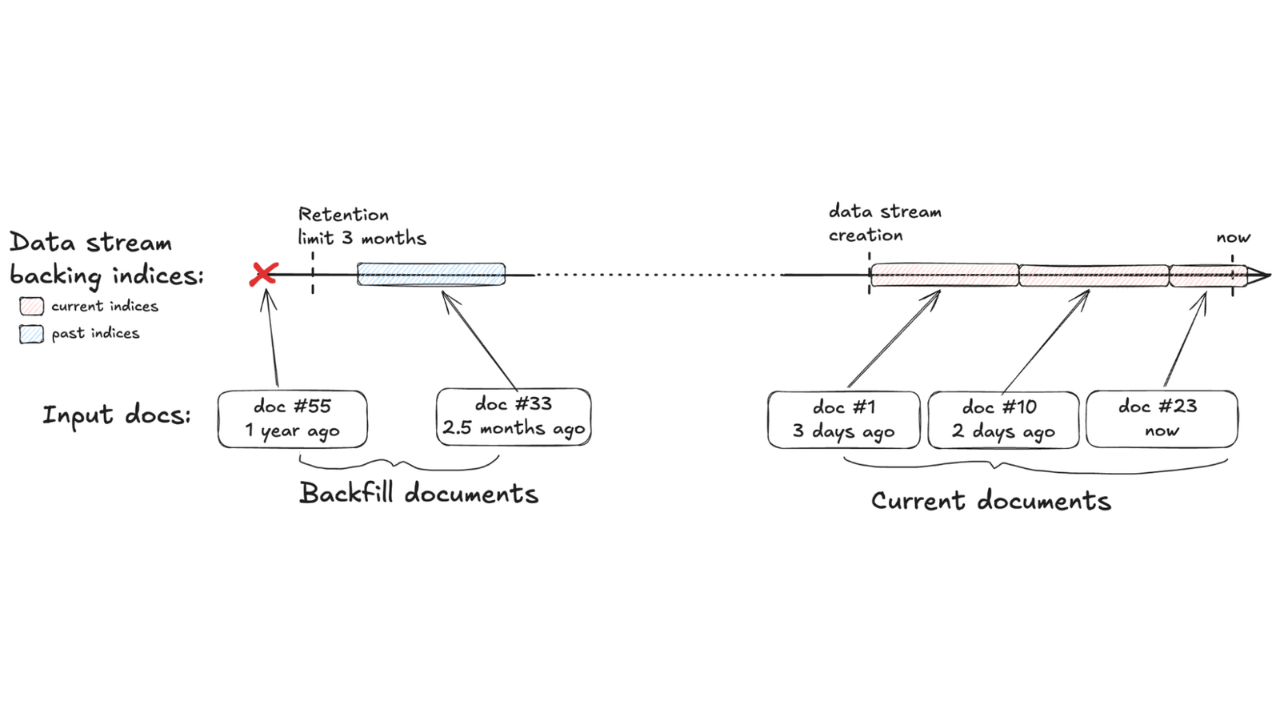
Backfill time series data in Elasticsearch: Load months of historical metrics through the bulk API
Elasticsearch works out the time boundaries and creates the past backing indices as the documents land, so a historical data migration runs on your normal ingest path.

No more allocation delays: Decoupling snapshots from shard relocation in stateless Elasticsearch
Clusters scale out under load without waiting for a snapshot to finish, because snapshots now read straight from the object store and no longer pin shards in place.

Dashboard activity logs: Find out which Kibana dashboards get used
Kibana now logs who viewed, edited or deleted each dashboard, how long it took and what failed, so you can catch a broken dashboard before anyone reports it.
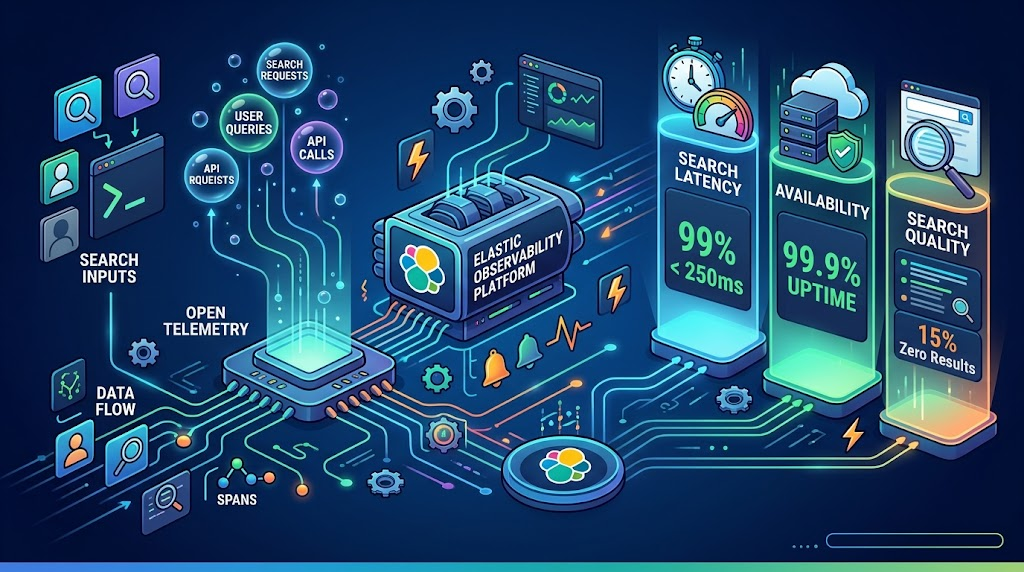
Three SLOs every search team needs: monitoring search latency, availability and quality with OpenTelemetry
Your OpenTelemetry search spans already carry the signals for SLOs, burn rate alerts, anomaly detection and incident response, and this post shows how to build all four in Elastic Observability.
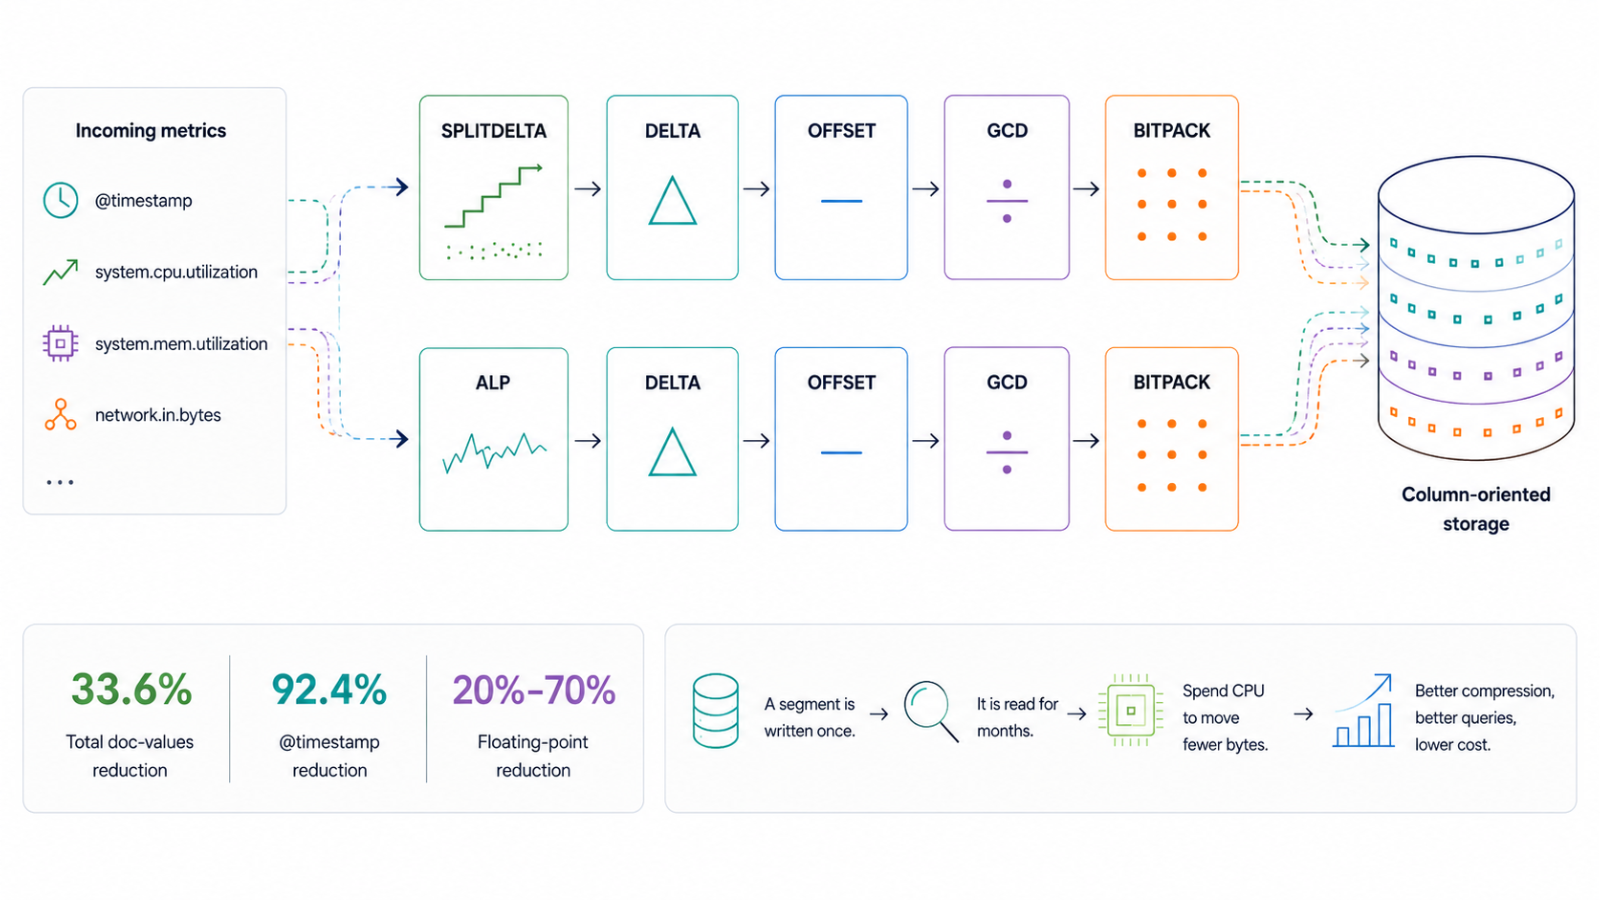
ES95: Adaptive Compression for Elasticsearch Time-Series Metrics
ES95 is Elasticsearch 9.5's new adaptive time series codec that cuts @timestamp storage by 92% and floating point fields by up to 74%, with zero configuration.

Two lines of JSON to replace your ILM policy: data stream lifecycle adds frozen tier support
In Elasticsearch 9.5, frozen_after in data stream lifecycle moves indices to searchable snapshots on object storage on their own, keeping them queryable alongside downsampling and retention.

The mystery stress your heap chart can't see: AutoOps now watches vector off-heap memory
Dense vectors use off-heap memory your heap chart never shows. AutoOps detects memory pressure before vector RAM stress causes OOM.