
Your AI chat is not a screenshot: Live shared conversations in Elastic Agent Builder
Whoever picks up the problem next reads the whole thread and carries on with the same agent, with no access to anything beyond that one conversation.
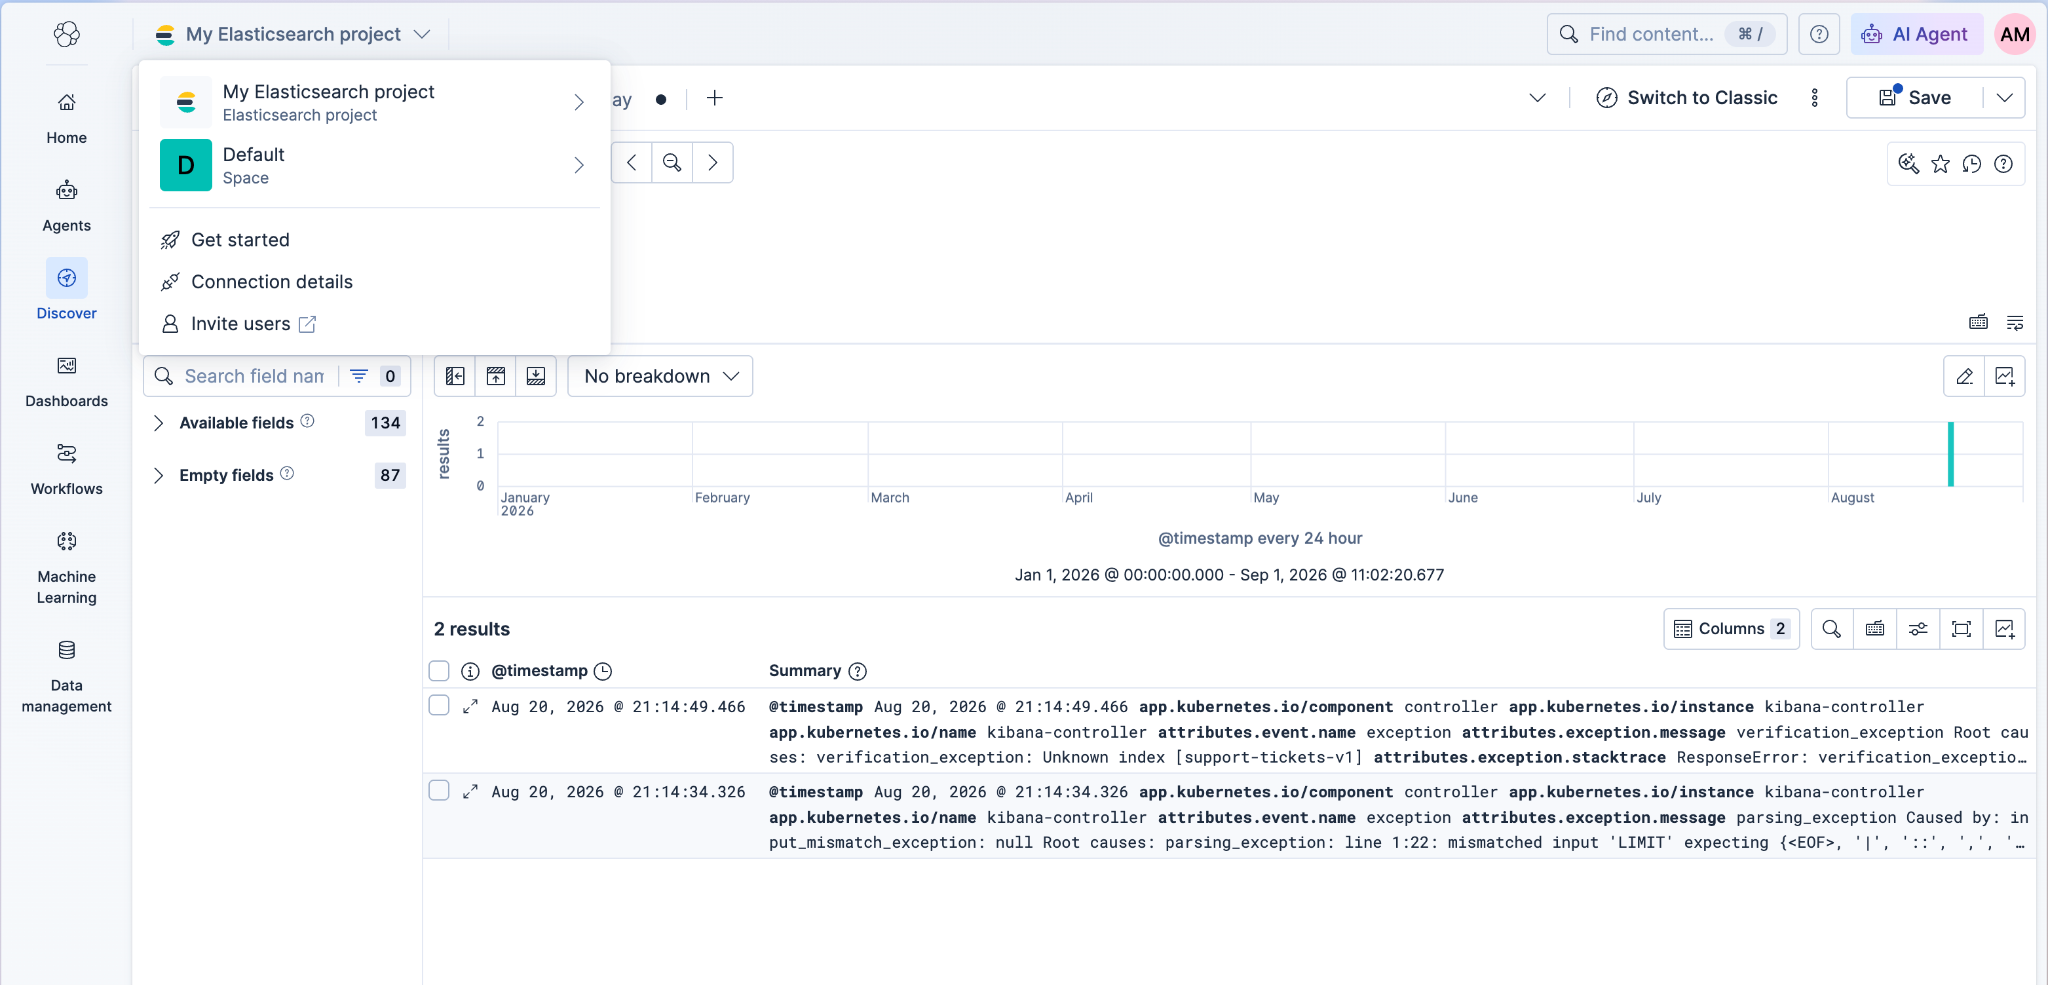
One button, three places: How we rebuilt Kibana's page headers with stricter APIs
We gave Kibana's shared shell typed contracts, which is how design system governance became the default, and why the new page headers have no breadcrumbs.

Dashboard activity logs: Find out which Kibana dashboards get used
Kibana now logs who viewed, edited or deleted each dashboard, how long it took and what failed, so you can catch a broken dashboard before anyone reports it.

Migrating 1,100 files to Redux Toolkit v2 without freezing the Kibana monorepo
Kibana gave Redux Toolkit v2 the default package name and pushed v1 onto an explicit alias, which inverts the usual migration order. Webpack externals, yarn resolutions and an ESLint rule keep React Redux v7 and v9 out of each other's way.

Kibana Dashboards API: A stable contract for every panel type, tested by 50+ teams before GA
Manage Kibana dashboards as code: Commit to Git, promote across environments, and automate deployments with the Kibana API and Terraform.
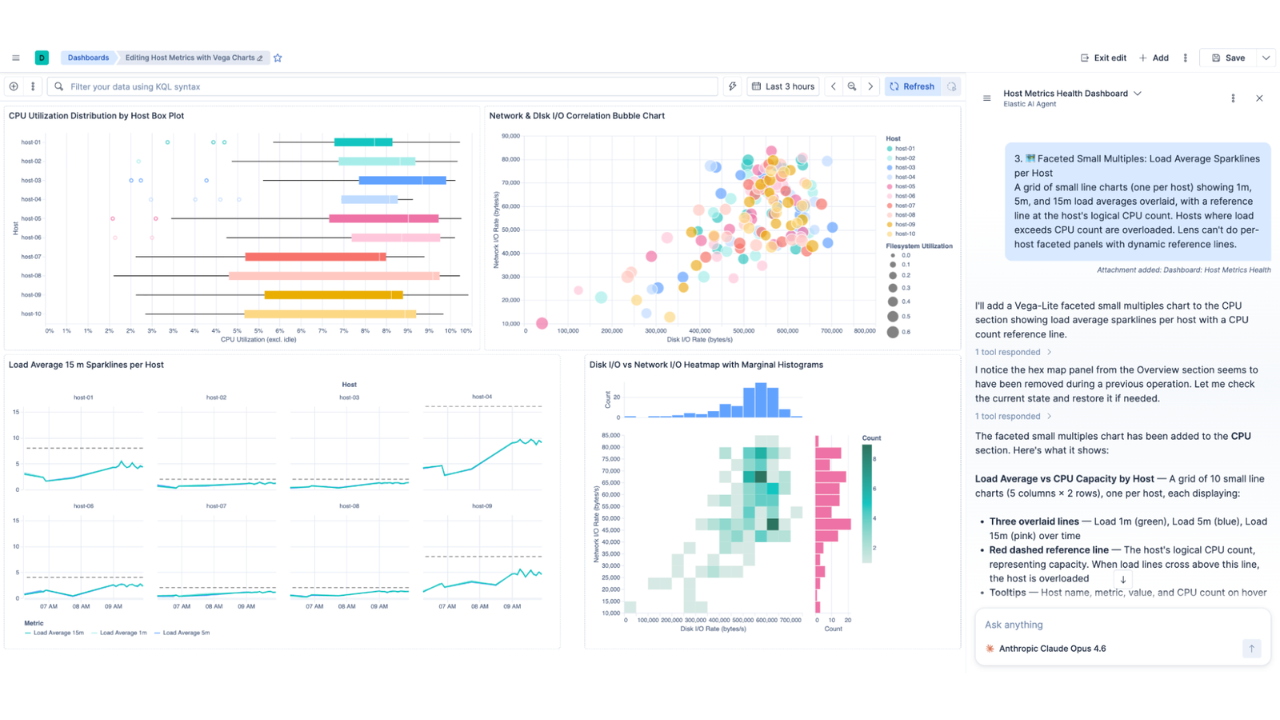
Prompt to dashboard in under a minute, 5x cheaper: AI dashboards and custom Vega-Lite charts in Kibana
Describe your metrics in natural language and Kibana's AI chat generates ES|QL-backed dashboards and Vega-Lite charts, from scatter plots to conditional formatting and custom tooltips.
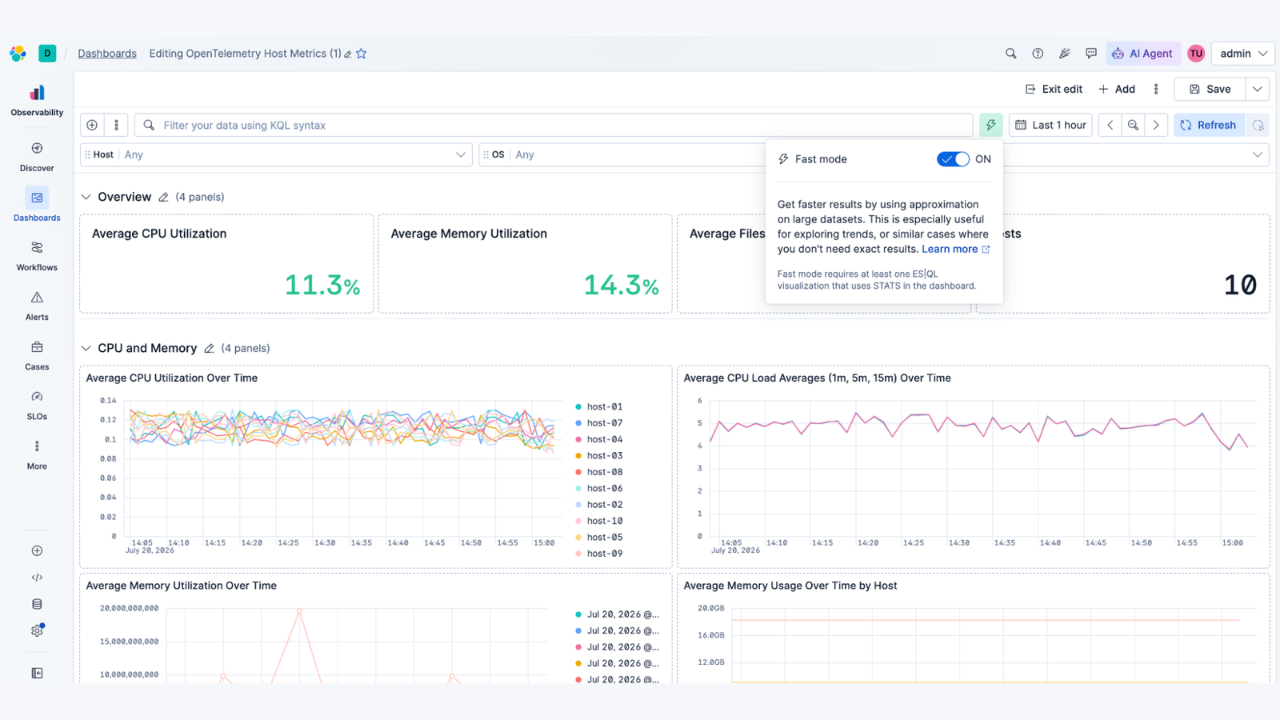
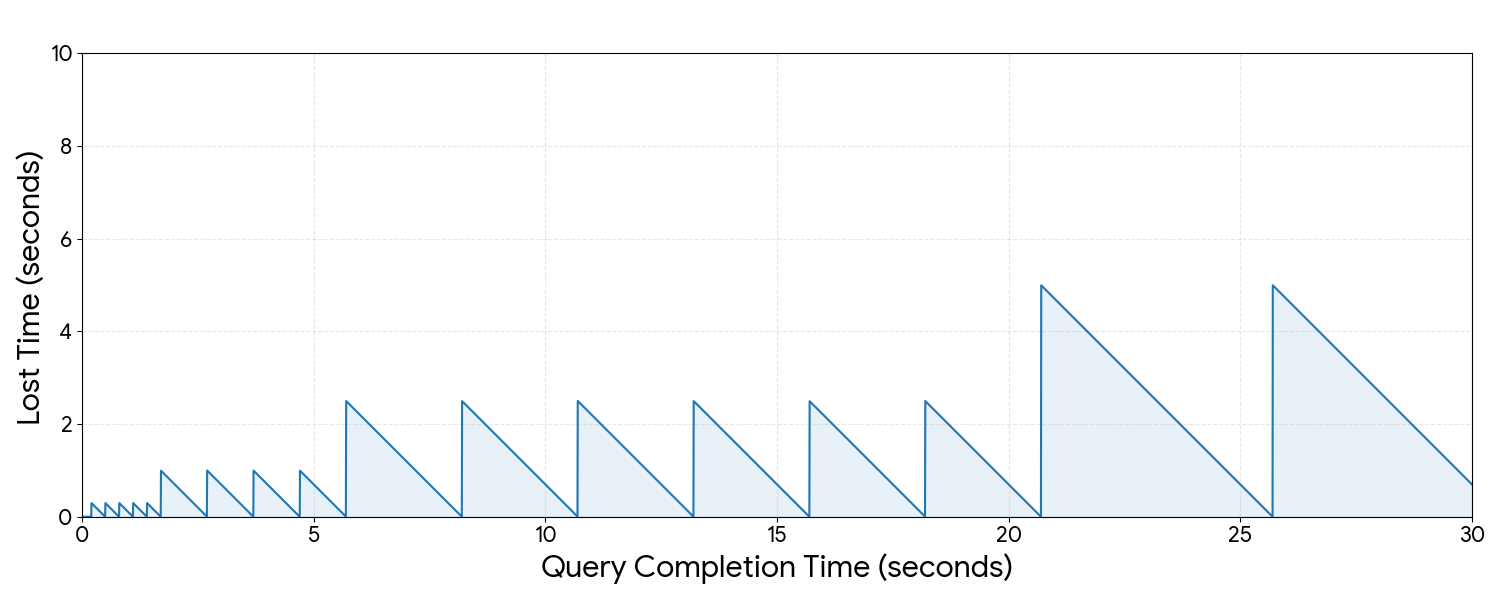
Close enough is fast enough: How ES|QL Fast mode makes Kibana dashboards up to 100x faster
Fast mode samples a fraction of the data instead of scanning all of it. This release also brings click-to-filter for ES|QL charts, query-powered controls, and cleaner metric and bar chart layouts.

137,000 people, zero human decisions: agentic disaster response with Elasticsearch
Find out how a Kibana detection rule, a workflow and an AI agent automatically relocated 137,000 military personnel across seven installations when a hurricane hit, no dispatcher required.
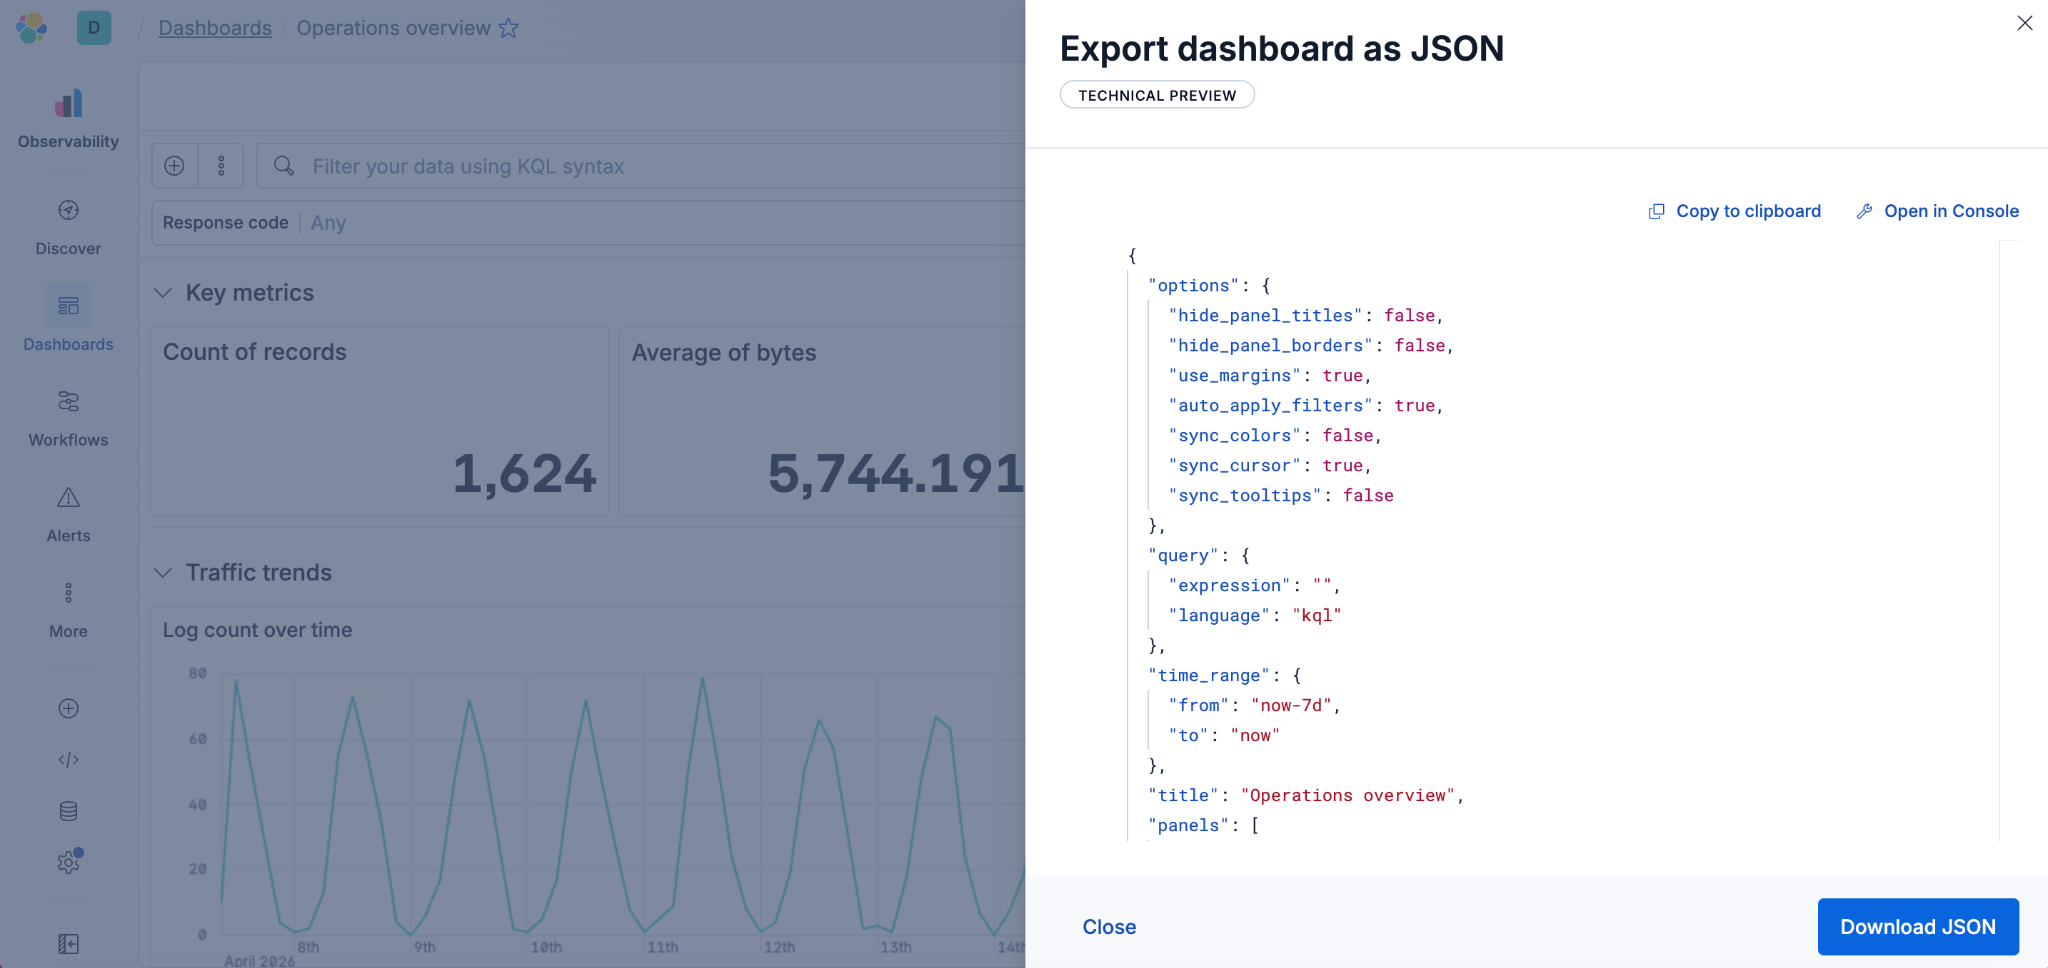
Kibana dashboards as code: GitOps, drift detection and Terraform for Kibana dashboards in Elastic 9.4
Elastic 9.4 ships a typed Dashboards API and a native Terraform resource that bring drift detection, PR-reviewable diffs and git-based rollback to Kibana dashboards for the first time.

AI Chat in Kibana now natively renders dashboards
The Elastic AI Chat in Kibana now builds dashboards from natural language, keeping your visuals and analysis in one thread and letting you save them as reusable Kibana objects.
Describe it, don't draw it: AI-native Kibana dashboards via MCP and ES|QL
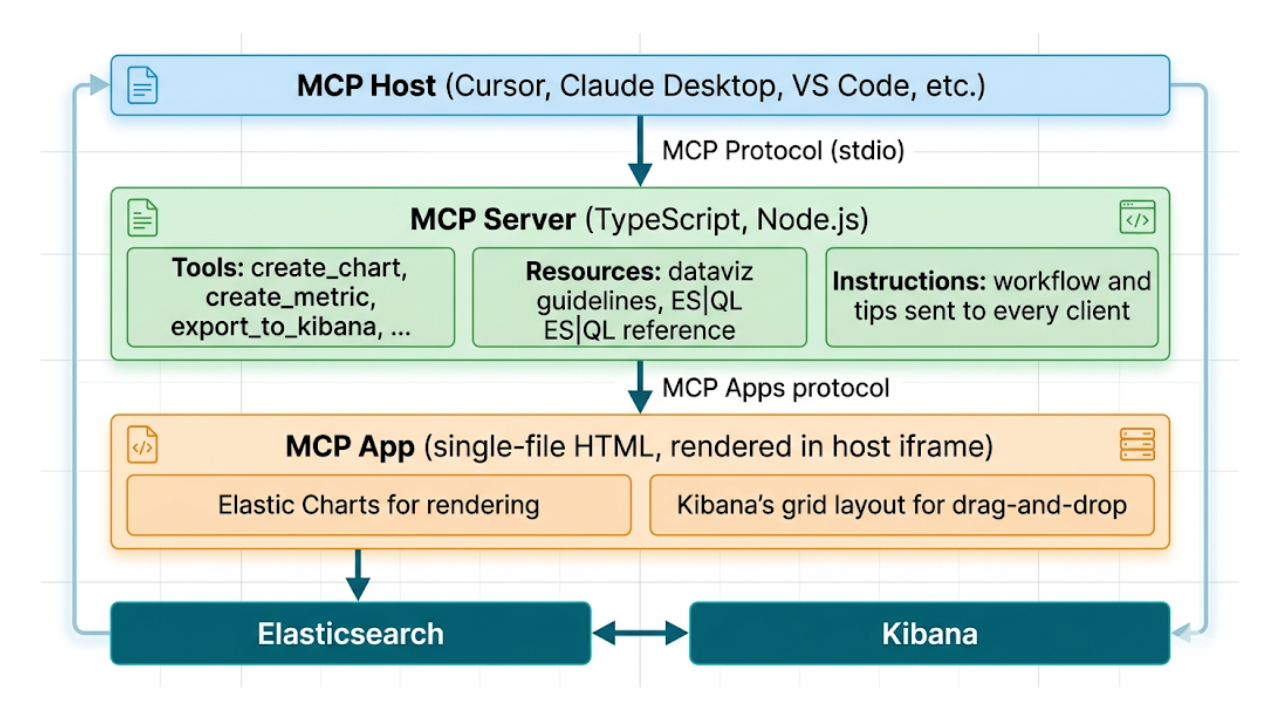
From prompt to dashboard. Learn how to build Kibana dashboards with natural language, using example-mcp-dashbuilder: an open source MCP application that writes ES|QL queries, creates interactive charts and exports fully functional dashboards directly to Kibana.