Dashboard activity logs: Find out which Kibana dashboards get used
Kibana now logs who viewed, edited or deleted each dashboard, how long it took and what failed, so you can catch a broken dashboard before anyone reports it.
Observe, protect, and search your data with a single solution. From application monitoring to threat detection, Kibana is your versatile platform for critical use cases. Start your free 14-day trial now.
Kibana logs every dashboard view, edit, create, delete, and refresh, along with the user behind each one. Two lines in kibana.yml enable this logging. When you point Discover at the index, you can find the dashboards that nobody opened in 30 days and rank them by load time or see who edited the one that broke this morning. Dashboard activity logs run on self-managed clusters today, with Elastic Cloud support coming.
How dashboard activity logs differ from the Kibana audit log
Dashboard activity logs and the Kibana audit log both write structured logs about user actions, but they answer different questions.
| Kibana audit log | Dashboard activity logs |
Answers | Who accessed what, and when | Which dashboards are used, and how well they perform |
Built for | Security and compliance teams | Kibana admins and dashboard owners |
Tracks | Security-relevant events across Kibana | Five dashboard actions: create, update, delete, view, refresh |
Enabled by | Its own setting in |
|
What dashboard activity logs capture
The user activity service records structured events every time a user interacts with a dashboard. Each event captures what happened and to which dashboard, in addition to who did it. Five actions are tracked:
Action | Fires when | Includes duration |
| A dashboard is created | No |
| An edit is saved | No |
| A dashboard is removed | No |
| A user opens a dashboard | Yes, time on the dashboard until they navigate away |
| A user changes filters or time range, or auto-refresh runs | Yes, refresh duration |
Very often, a dashboard_view event also triggers a refresh.
Every event carries the same core fields, with two that appear conditionally:
Field | What it holds | Present on |
| Name of the user who performed the action | Every event |
| Email address of the user | Every event |
| Roles assigned to the user | Every event |
| Dashboard name | Every event |
| Dashboard ID | Every event |
| Kibana space the dashboard belongs to | Every event |
| IP address the request came from | Every event |
| Which of the five actions occurred | Every event |
| Whether the action succeeded or failed | Every event |
| Time taken, in nanoseconds |
|
| Error class and message when something fails | Events where |
How Kibana records dashboard activity
Under the hood, Kibana plugins report events from the browser or server through a core client, and valid events are written to a dedicated logger. No data is sent to a third party; because events are standard JSON logs, you control where they go and how they’re ingested.
What you can do with dashboard usage data
Dashboard activity data answers five operational questions that would otherwise require further investigation:
Clean up unused dashboards. Filter for dashboards with zero
dashboard_viewevents. If nobody's looking at it, archive it. This is critical for customers who are managing thousands of dashboards.Troubleshoot performance. The
event.durationfield tells you exactly how long each dashboard load or refresh takes. Sort by duration to find your slowest dashboards.Edit history. Every create, update, and delete is logged with the user who made the change. You no longer have to wonder who modified a critical dashboard or when it happened.
Plan capacity. Identify users running heavyweight queries during peak hours. If one user's auto-refresh is hammering the cluster every 10 seconds, you'll see it.
Monitor errors proactively. Dashboards throwing errors surface immediately through
error.typeanderror.messagefields, so you don’t need to wait for users to report them.
How to enable dashboard activity logs in Kibana
Add two lines to your kibana.yml ( the service is disabled by default):
user_activity:
  enabled: true
Events will start flowing immediately using a default JSON console appender. You can customize the output appender and filter specific actions using the same logging configuration schema that Kibana already uses:
user_activity:
  enabled: true
  appenders:
    console_json_default_appender:
      type: console
      layout:
        type: json
  filters:
    - policy: keep
      actions: [dashboard_view, dashboard_refresh]
Ship these logs into an Elasticsearch index (for example, via Filebeat), and you have a fully queryable dataset of dashboard usage.
How to query dashboard activity in Discover
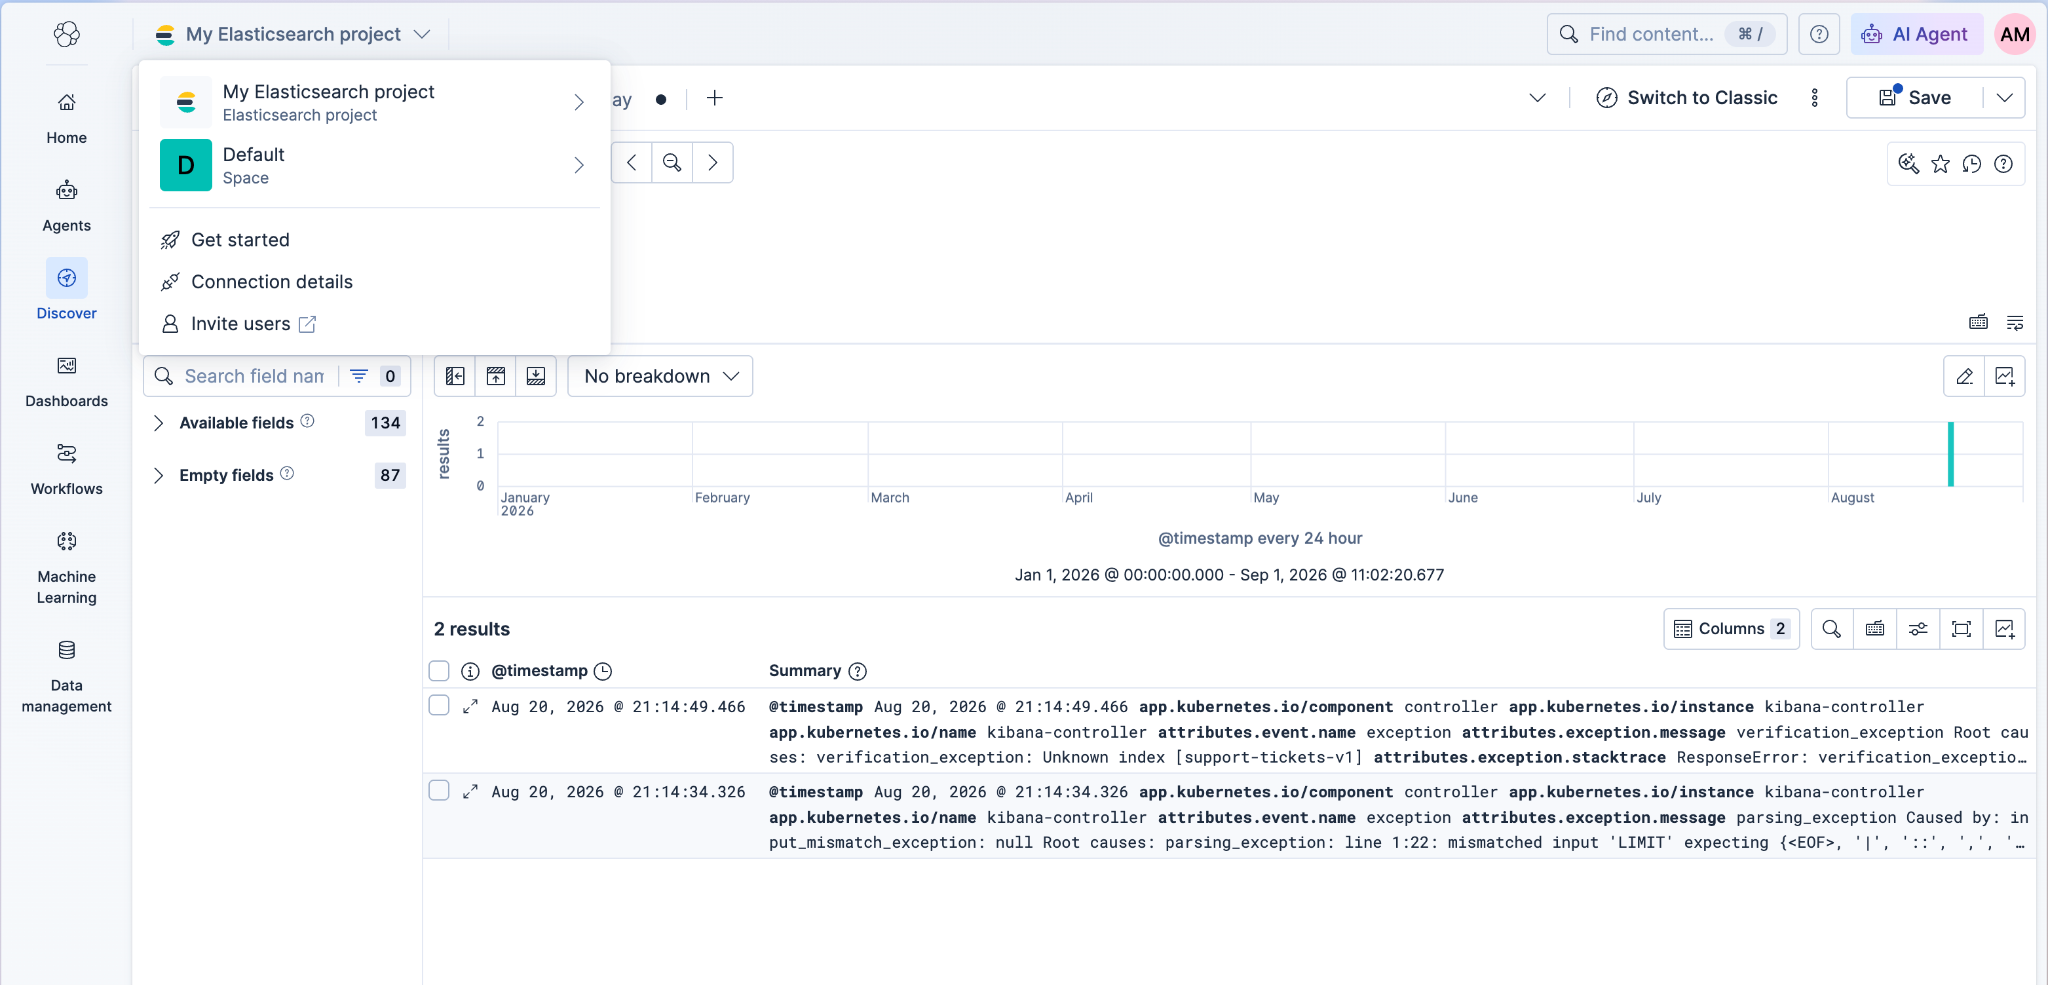
Once your activity logs are indexed, open Discover and point it at your user activity index pattern. You'll immediately see every dashboard interaction as a structured event, and they’re filterable by action type, user, dashboard name, and time range.
From here, you can quickly answer specific questions like the examples below.
How many times was a dashboard viewed?
Type your question in natural language in the Discover query editor, and press Cmd+J to automatically generate the Elasticsearch Query Language (ES|QL) query, as shown below:
FROM user-activity-logs
| WHERE object.name == "OTel Host Metrics Overview" AND event.action == "dashboard_view"
| STATS COUNT(*)
Which dashboards had zero views in the last 30 days?
Dashboards with no activity simply don't appear in the logs, so you can't filter directly for zero views. Instead, this query works backward, pulling every dashboard created (and not deleted) in the past year and then checking which of those had zero views in the last 30 days.
FROM user-activity-logs
| WHERE event.action IN ("dashboard_create", "dashboard_delete")
  OR (event.action == "dashboard_view" AND @timestamp > NOW() - 30 days)
| STATS
    creates = COUNT_DISTINCT(CASE(event.action == "dashboard_create", 1, NULL)),
    deletes = COUNT_DISTINCT(CASE(event.action == "dashboard_delete", 1, NULL)),
    recent_views = COUNT_DISTINCT(CASE(event.action == "dashboard_view", 1, NULL))
  BY object.id, object.name
| WHERE creates > 0 AND deletes == 0 AND recent_views == 0
| SORT object.name ASC
Which dashboards took longer than 10 seconds to load?
Note that event.duration is recorded in nanoseconds, so the query converts to seconds before filtering:
FROM user-activity-logs
| WHERE event.action == "dashboard_refresh"
| EVAL duration_seconds = event.duration / 1000000000
| STATS max_duration_secs = MAX(duration_seconds) BY object.name
| WHERE max_duration_secs >10
| SORT max_duration_secs DESC
Which dashboards are throwing errors, and what's failing?
This query shows dashboards with one or more panels throwing errors during dashboard_refresh events, so you can quickly spot recurring issues and prioritize fixes:
FROM user-activity-logs
| WHERE event.outcome == "failure"
| STATS errors = COUNT(*) BY object.name, metadata.errors.error
Build a dashboard usage overview with AI chat
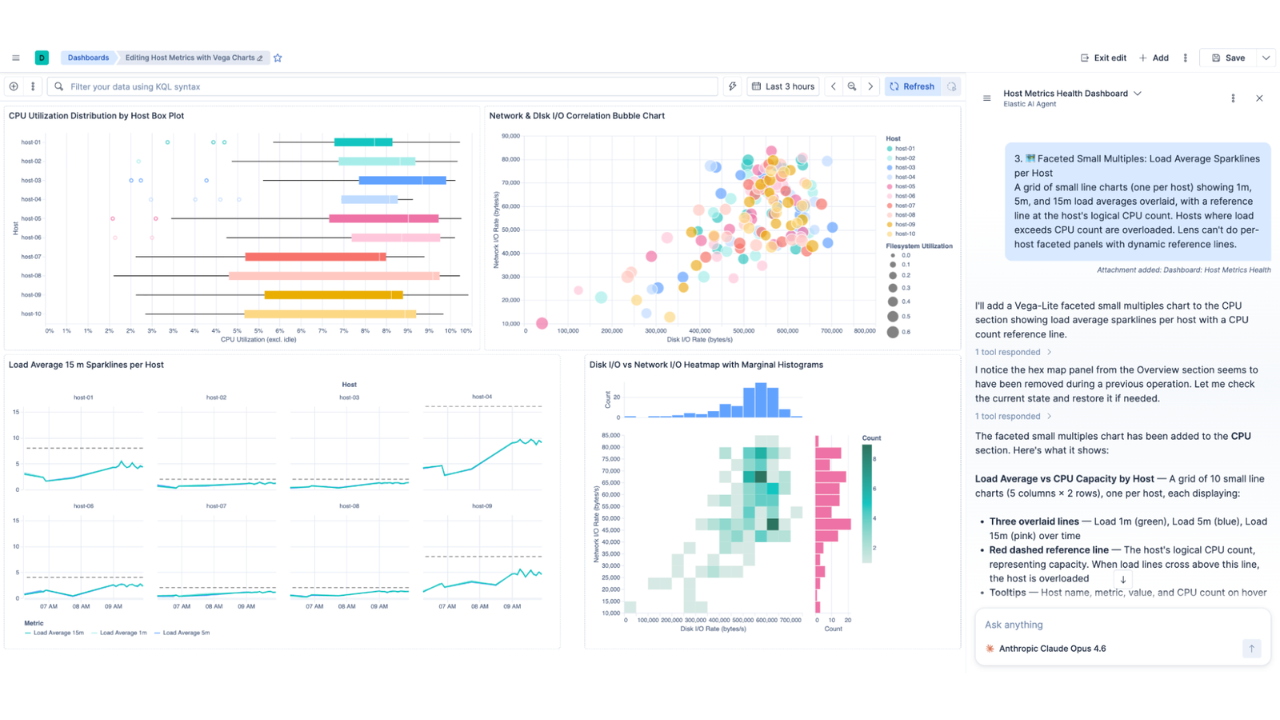
We’re planning to add out-of-the-box dashboards along with the activity logs, but in the meantime, instead of manually building visualizations, open the AI chat in Kibana and ask it to create a dashboard from your user activity data.
The generated dashboard gives you at-a-glance visibility into your most-viewed dashboards, heaviest users, slowest-performing panels, and recent errors; that is, exactly the operational view that large deployments need.
Get started with dashboard activity logs
User activity logs are available in Kibana 9.5. Begin by enabling the service. Then ship the logs into an index, and start building the operational visibility that your team has been asking for. For full configuration details and the complete event schema, see the user activity documentation.
How helpful was this content?
Related Content
One button, three places: How we rebuilt Kibana's page headers with stricter APIs

Migrating 1,100 files to Redux Toolkit v2 without freezing the Kibana monorepo

Kibana Dashboards API: A stable contract for every panel type, tested by 50+ teams before GA
Prompt to dashboard in under a minute, 5x cheaper: AI dashboards and custom Vega-Lite charts in Kibana