Elastic Stack 7.8.0 released
We are pleased to announce the general availability of version 7.8 of the Elastic Stack. Like most Elastic releases, 7.8 brings a broad set of new capabilities to Elasticsearch, Kibana, Logstash, and Beats, as well as the solutions built on the Elastic Stack: Elastic Enterprise Search, Elastic Observability, and Elastic Security. We expect 7.8 to help our customers and users onboard more data into Elastic, streamline navigation and management, and power deeper investigations and greater insights from that data with purpose-built tools across our top use cases.
We are also continuing to improve the capabilities of Elastic Cloud, the best place to deploy the Elastic Stack and our solutions. Just in the last few months, we have driven enhanced capabilities, expansion to 35 regions globally across major cloud providers, and easier purchasing options for Elastic Cloud. And, of course, Elastic Stack 7.8 is available right now on Elastic Cloud — the only hosted Elasticsearch offering to include all of the new features in 7.8. Or you can download the Elastic Stack and our cloud orchestration products, Elastic Cloud Enterprise and Elastic Cloud for Kubernetes, for a self-managed experience.
We’ve crammed in so many features across the portfolio — to get the full feature rundown, dive into the individual product blog posts. Below we’ve shared some of the key release highlights.
Elastic Stack: Delivering enhanced navigation, dashboard drilldowns, and visualizations
A new side navigation organized around your use cases
Kibana is a place where critical work happens for millions of users inside the Elastic Stack. New analysts explore building their first data visualizations with Kibana Lens and Elastic Maps. Seasoned monitoring professionals track the health of their systems from application traces in APM to infrastructure updates in Metrics. Threat hunters surface and respond to cyberattacks in real time with the powerful security tools at their disposal in Elastic Security. Kibana is both a critical solution for companies everywhere and a familiar interface for people to get their jobs done. With Kibana 7.8, we've simplified the experience by giving our observability and security solutions dedicated sections in the side navigation and grouping the related applications underneath each solution.
More powerful dashboards with new drilldown capabilities and easier authoring in Kibana
From security operations centers to InfraOps war rooms, it's almost a sure bet you will run into at least one dashboard being used to monitor the status of something critical. Dashboards are a vital window into the health of a system, a program, or a process and here at Elastic we’re working to improve the impact dashboards can have.
With 7.8 we’re doing exactly this by not only delivering a powerful new feature in dashboard-to-dashboard drilldowns, but also streamlining the process for adding and updating dashboard visualizations and metrics. With drilldowns, you’ll now be able to build clickable interactions from one dashboard to another and customize how that experience filters the destination. Build easy investigation paths for threat hunters that let them go from a 30,000-foot global view to a targeted dashboard showing specific hosts, devices, and IPs. Or do the reverse — provide a one-click trail for monitoring teams to “zoom out” from a narrowed analysis into a 360-degree observability dashboard to approach troubleshooting from a different perspective. With this release, that creation flow is even faster with the ability to author and edit dashboard visualizations and then be dropped immediately back into the dashboard experience.
Read about these features and more in the Kibana 7.8 blog and the Elasticsearch 7.8 blog.
Elastic Enterprise Search: Equipping admins with powerful tools to manage modern search experiences
Enterprise authentication mechanisms seamlessly integrated with document-level authorization
SAML-based authentication and document-level access control are the two pillars of information security in enterprise-grade applications, and it is critical to ensure these two mechanisms are seamlessly integrated. The 7.8 release of Workplace Search brings the combined power of both features for a frictionless, secure, and personalized search experience that scales to even the largest organizations. With SAML and centralized identity management already at the forefront of the virtual workplace, Workplace Search lowers the implementation and support burden while ensuring a secure experience for every user.
Document-level permissions and SAML are both available at the Platinum and Enterprise subscription levels.
Keep tabs on ingested data with configurable documents view
As admins begin ingesting data into App Search using the JSON uploader or JSON endpoint, they typically validate their data using the Documents viewer functionality. App Search now supports the ability to have more dynamic interactions with that data by searching, sorting, and filtering the content as its ingested, without having to switch between screens.
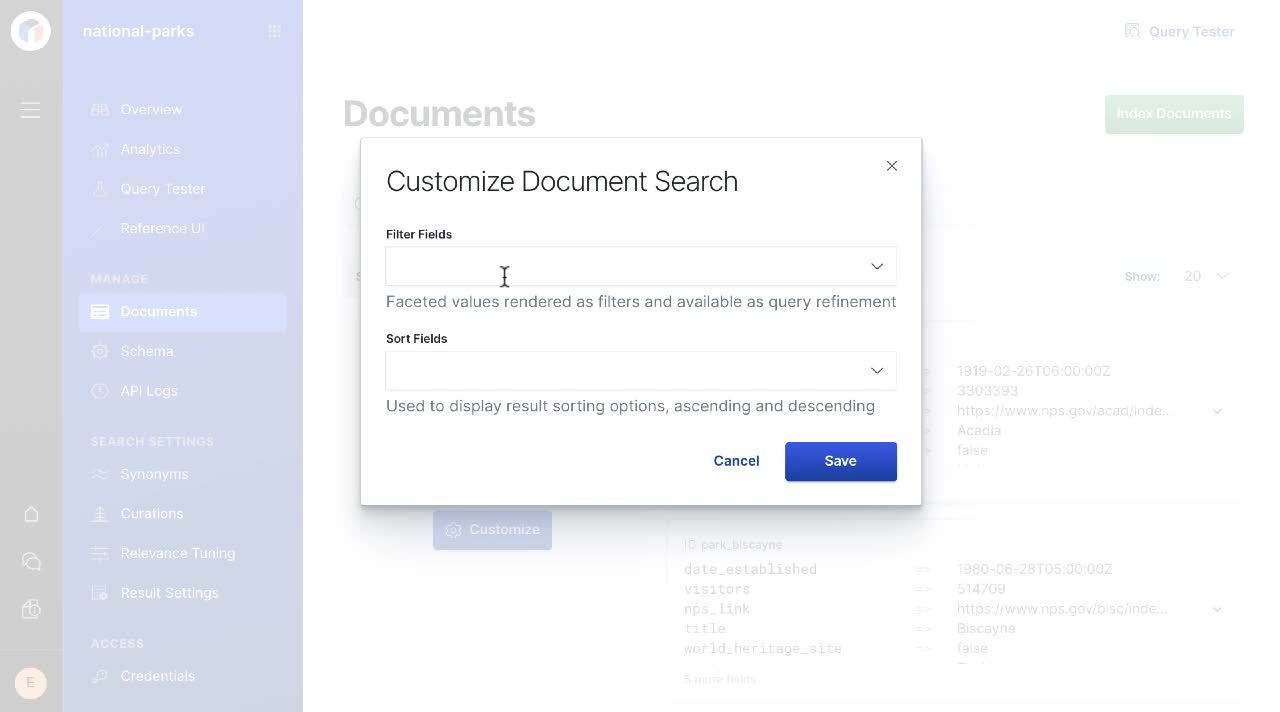
Configurable documents view is available on self-managed or Elastic Cloud deployments of App Search using a Standard, Gold, Platinum, or Enterprise subscription.
Get the scoop on all of the new Enterprise Search features in the Enterprise Search 7.8 release blog.
Elastic Observability: Expanding visibility, monitoring, and intelligent service maps
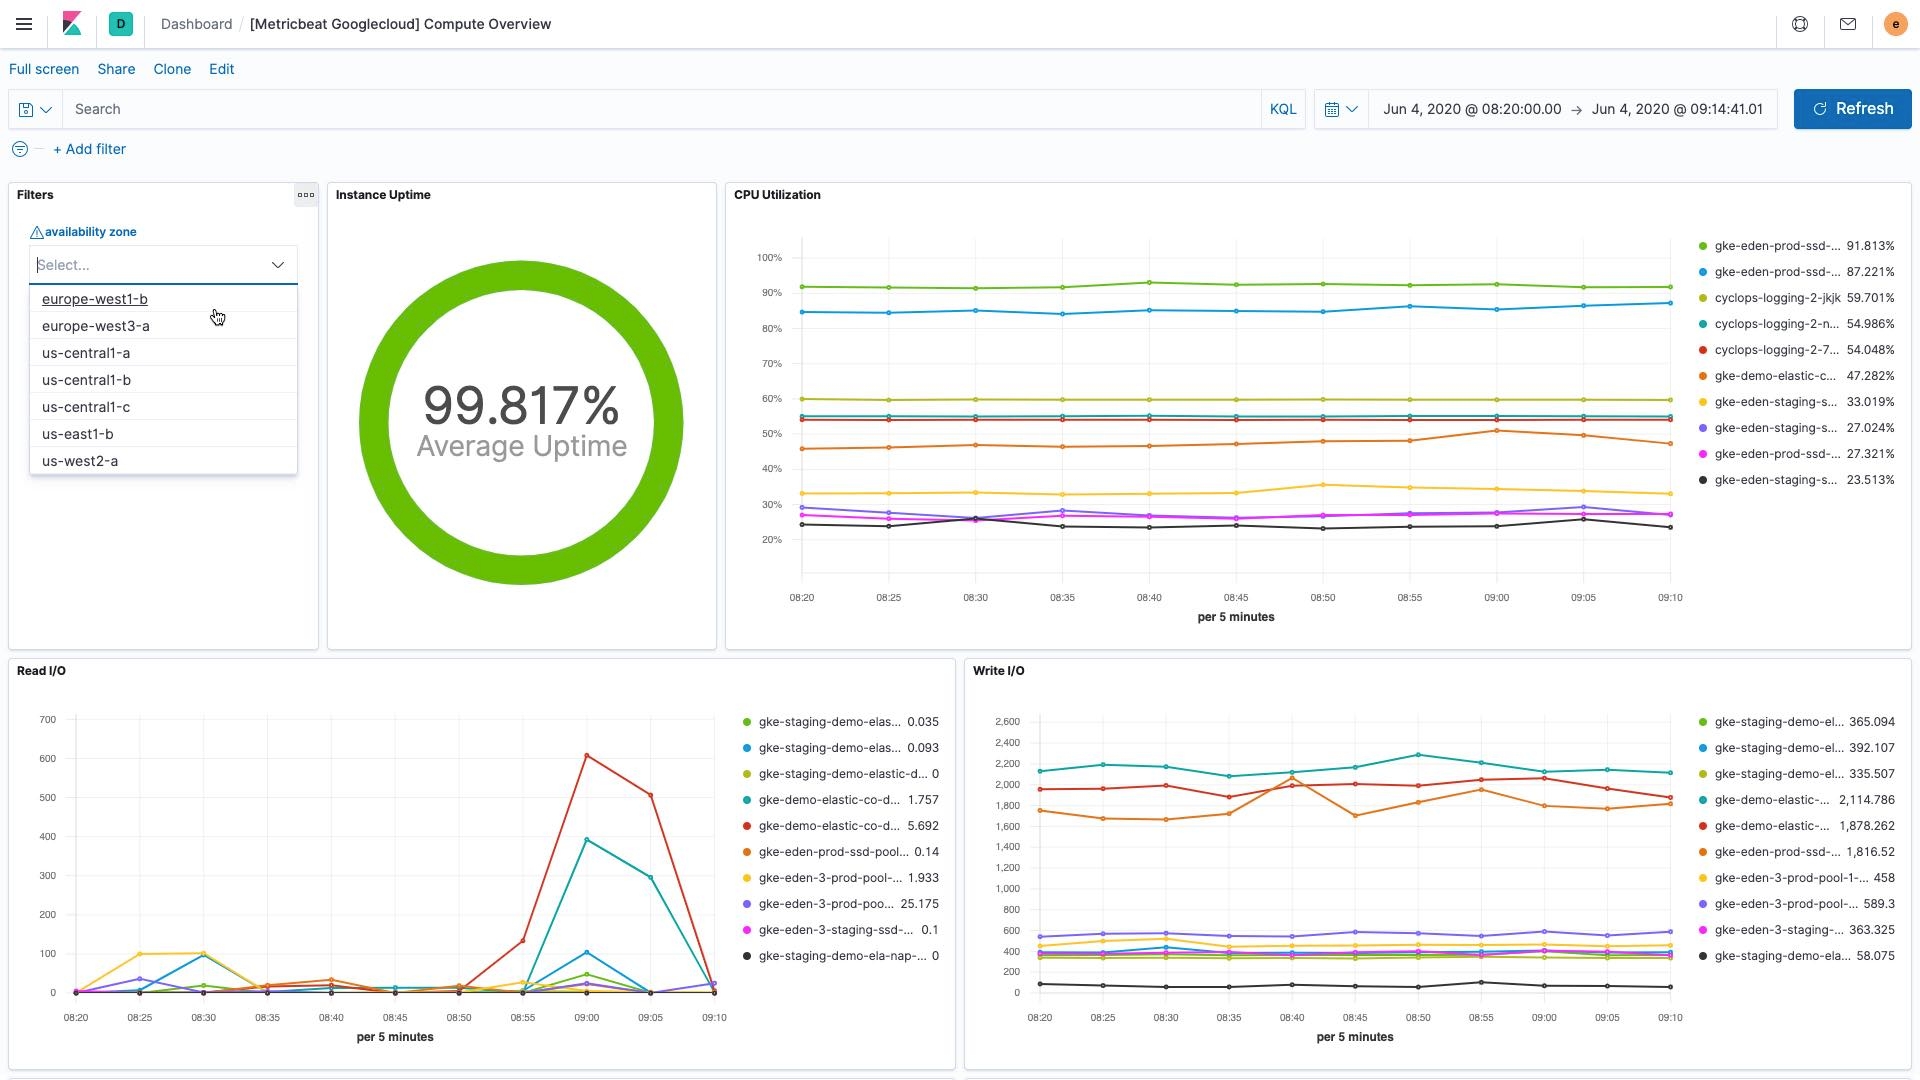
Complete visibility into Google Cloud operations with expanded Stackdriver integration
With increasing workloads moving to cloud, keeping track of cloud operations is critical. We have been strengthening out-of-the-box cloud monitoring capabilities for all major cloud providers over the last few releases, and we are excited to expand Google Cloud integrations to support collecting all metrics from Google Cloud operations suite (formerly Stackdriver). Google Cloud operations suite gathers logs, metrics, and other events from your entire Google Cloud platform, apps, and services, and helps users answer questions about the performance and health of their cloud applications. With this integration, users can monitor any Google Cloud service supported by Stackdriver using Elastic. This new integration complements the Google Cloud Stackdriver logs support added in version 7.7 to deliver end-to-end visibility into Google Cloud on a single platform.
Certificate validity monitoring in Elastic Uptime
Downtime due to expired security certificates is far too common, and easily avoidable. Expired certificates on customer-facing sites also present a reputational risk, with browsers presenting an “insecure” notification on your site, reduced Google search result ranking, and putting your visitors at risk of fraud and identity theft.
Elastic Uptime, a free and open product for monitoring service uptime and availability, adds TLS / SSL monitoring to automatically track certificate validity and expiration dates on monitored hosts / services. Users can view all the certificates detected from their deployed monitors in a single page in the Uptime app, along with relevant information like issuing authority, expiration date, age of certificates, and certificates approaching expiry. Through preemptive tracking, users can replace certificates before expiration and prevent customer-impacting issues.
Best of all, this requires no extra work from the user. Uptime (once it is upgraded to 7.8) will automatically detect installed certificates and start tracking their validity.
Service maps now surface health indicators powered by machine learning
What’s better than a service map that shows a 10,000-foot view of all your service connections and dependencies? An annotated service map that surfaces services with degraded performance in a very easy-to-consume way.
We are excited to introduce health status indicators, powered by machine learning, to service maps in Elastic APM 7.8. Service maps automatically pull data from the machine learning integration in Elastic APM and color service nodes red, yellow, or green based on the severity of the anomaly score tied to the service performance. Layering health information into service maps in this way enables a more proactive monitoring workflow.
Service maps, which launched as a beta feature in version 7.7, provide a big picture of how various services are connected to each other. Machine learning automatically tracks and alerts on performance anomalies. By combining these two powerful features in a single view, we are simplifying and accelerating investigative workflows for the operator.
Dive deeper in all the new features in the Elastic Observability 7.8 blog.
Elastic Security: Responding faster, driving action, and eliminating blind spots
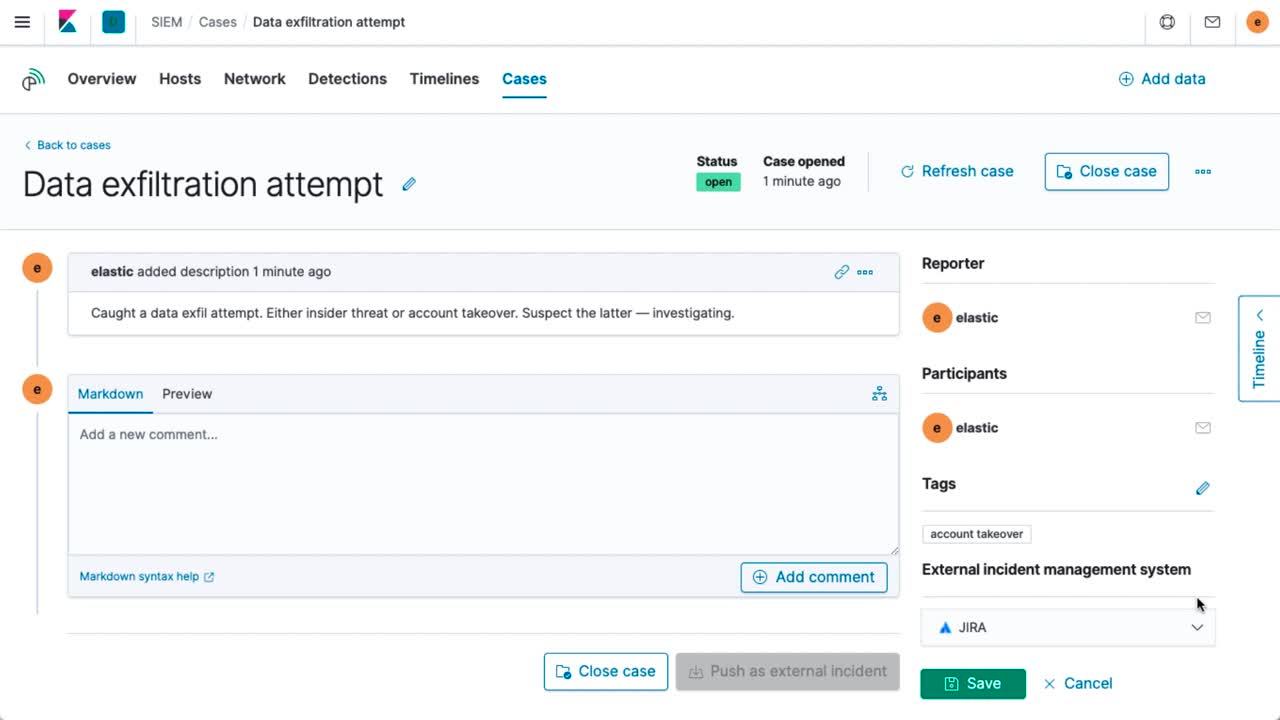
Respond faster with integration between Jira and Elastic case management
Security practitioners are most effective when equipped with fast and intuitive solutions that are aligned with the natural workflows of their broader security operations team and IT organization.
That’s why we've continued to enhance our built-in case management function and build additional integrations with popular workflow tools. Elastic Security 7.8 introduces a new integration with Jira Core, Jira Service Desk, and Jira Software that streamlines workflows and reduces context switching, enhancing analyst productivity. From a single interface, Elastic Security users can perform an investigation, create a case, add timeline investigations and comments, and — once ready to escalate — quickly open or update a Jira incident or issue to take action.
Explore and act quickly with a powerful UI
The Elastic Security interface continues to grow more flexible and intuitive. This latest release gives security practitioners quicker access to the data they need and new ways to take immediate action, including interactive aggregation charts that enable analysts to quickly visualize contextually relevant data, supporting natural and uninterrupted inquiries. Users reviewing data on a grid or chart can now broaden or narrow a global filter with just two quick clicks, making it easier to zoom in to pinpoint issues or zoom out to spot trends. Elastic Security also introduces new ways to apply and adjust the filters driving an investigation timeline, speeding decision-making and enabling analysts to iterate rapidly on successive hypotheses.
Stop threats at scale with new out-of-the-box protections
Elastic Security 7.8 delivers a new set of out-of-the-box rules for detecting threats targeting your Linux systems. The new rule set detects various Linux attack techniques, with an emphasis on evasion where attackers attempt to hide malicious activity by taking steps like deleting system artifacts, disabling services, and using local tools to spawn a new terminal.
Elastic Security comes equipped with out-of-the-box detection rules developed by in-house security experts, enabling practitioners to automate the detection of a wide range of threats. Detection rules operate at scale, leveraging data from across your environment to expose hostile actors before they can cause damage and loss.
Easily ingest network and endpoint data to eliminate blind spots
Elastic Security 7.8 broadens the data immediately available to security teams with new Filebeat modules that are available to users everywhere. Valuable data from network security devices by Fortinet and Check Point allow you to monitor and analyze network activity, while endpoint data from CrowdStrike Falcon EDR provides free and open access to host telemetry.
Access to this data, alongside the many other data sources with support for Elastic Common Schema (ECS), enables sophisticated cross-environment analysis. The machine learning jobs, detection rules, and dashboards in Elastic Security are engineered for compatibility with ECS-formatted data, regardless of data source.
Get all the details in the Elastic Security 7.8 blog.
Elastic Cloud: Simplifying operations, expanding deployment options, and streamlining billing
Simpler operations with a new API and node role
You can now programmatically deploy, manage, and scale clusters using our new Elasticsearch Service REST API, command-line interface, and language SDKs. Automate deployments faster and reduces errors, making operations easier. On Elastic Cloud, the new coordinating node role combines ingest and query coordination into a single dedicated node, helping to scale with high ingest and query loads.
More deployment options, with 35 regions
We’ve added more regions across multiple cloud service providers, so you can access Elastic Cloud in more locations, including Finland, London, Netherlands, São Paulo, Singapore, South Carolina, Taiwan, and Tokyo. For public sector workloads, we have launched AWS GovCloud in beta, and have achieved FedRamp Moderate ‘In-Process’ certification.
If you’d rather run self-managed, we’ve added new features with Elastic Cloud Enterprise 2.5 and Elastic Cloud on Kubernetes 1.1 to make deploying to physical infrastructure, VMs, or containers even smoother. ECE 2.5 includes snapshot lifecycle management and more, while ECK 1.1 enhances cross-cluster support and delivers declarative management of users and roles.
Taking care of business
We’re committed to streamlined procurement that works the way you do. We just launched Elasticsearch Service Gold and Platinum monthly subscriptions via the Google Cloud Marketplace. Customers on Google Cloud can now find Elasticsearch Service directly on the left side of the console under "Partner Solutions." We have added a number of features to help you predict, understand, and manage your spending on Elastic Cloud. We don’t believe you should need an advanced accounting degree to understand your bill.
To get caught up on all of the news on cloud, check out the Elastic Cloud roundup blog.
There’s always more...
So much more. Check out the individual product blog posts for the details on everything we added in 7.8:
Elastic Stack
Elastic Solutions
- Elastic Enterprise Search 7.8.0 released
- Elastic Observability 7.8.0 released
- Elastic Security 7.8.0 released
Elastic Cloud