Elastic Observability 7.8.0 released
We are pleased to announce version 7.8 of the Elastic Observability solution that adds several exciting new features and capabilities across the board. Integration to Google Cloud operations suite (formerly Stackdriver) has been expanded to include metrics and provide full visibility into your entire Google Cloud infrastructure and applications. Elastic Uptime adds the ability to track and alert on expiring security certificates on monitored services and prevent downtime. Service maps, the dependency mapping viewer in Elastic APM, now surfaces health indicators powered by machine learning, making the big picture more actionable.
Experience the latest version of Elastic Observability on our Elasticsearch Service on Elastic Cloud (a free 14-day trial is available) or install the latest version of the Elastic Stack for a self-managed experience.
And now, without further ado, here are the release highlights. Be sure to check out the individual release blogs to catch up on all the new features and enhancements in this release.
Complete visibility into Google Cloud operations with expanded Stackdriver integration
With increasing workloads moving to the cloud, visibility into your cloud operations becomes more critical. We have been strengthening our out-of-the-box cloud monitoring capabilities across all major providers over the last few releases, and this release adds another feather in our cloud monitoring cap.
We are excited to expand our integration to Google Cloud operations suite (formerly Stackdriver) to support collecting all metrics from your Google Cloud environment. Google Cloud operations suite gathers logs, metrics, and other events from your entire Google Cloud operations — including the infrastructure, apps and services — and helps users answer questions about the performance and health of their cloud applications. With this expanded integration, users can monitor any Google Cloud service supported by Stackdriver using Elastic Observability with very little effort. Combined with Stackdriver logs support added in version 7.7, this feature gives you end-to-end visibility into your entire Google Cloud ecosystem in a single platform, and helps speed up troubleshooting and root cause analysis workflows.
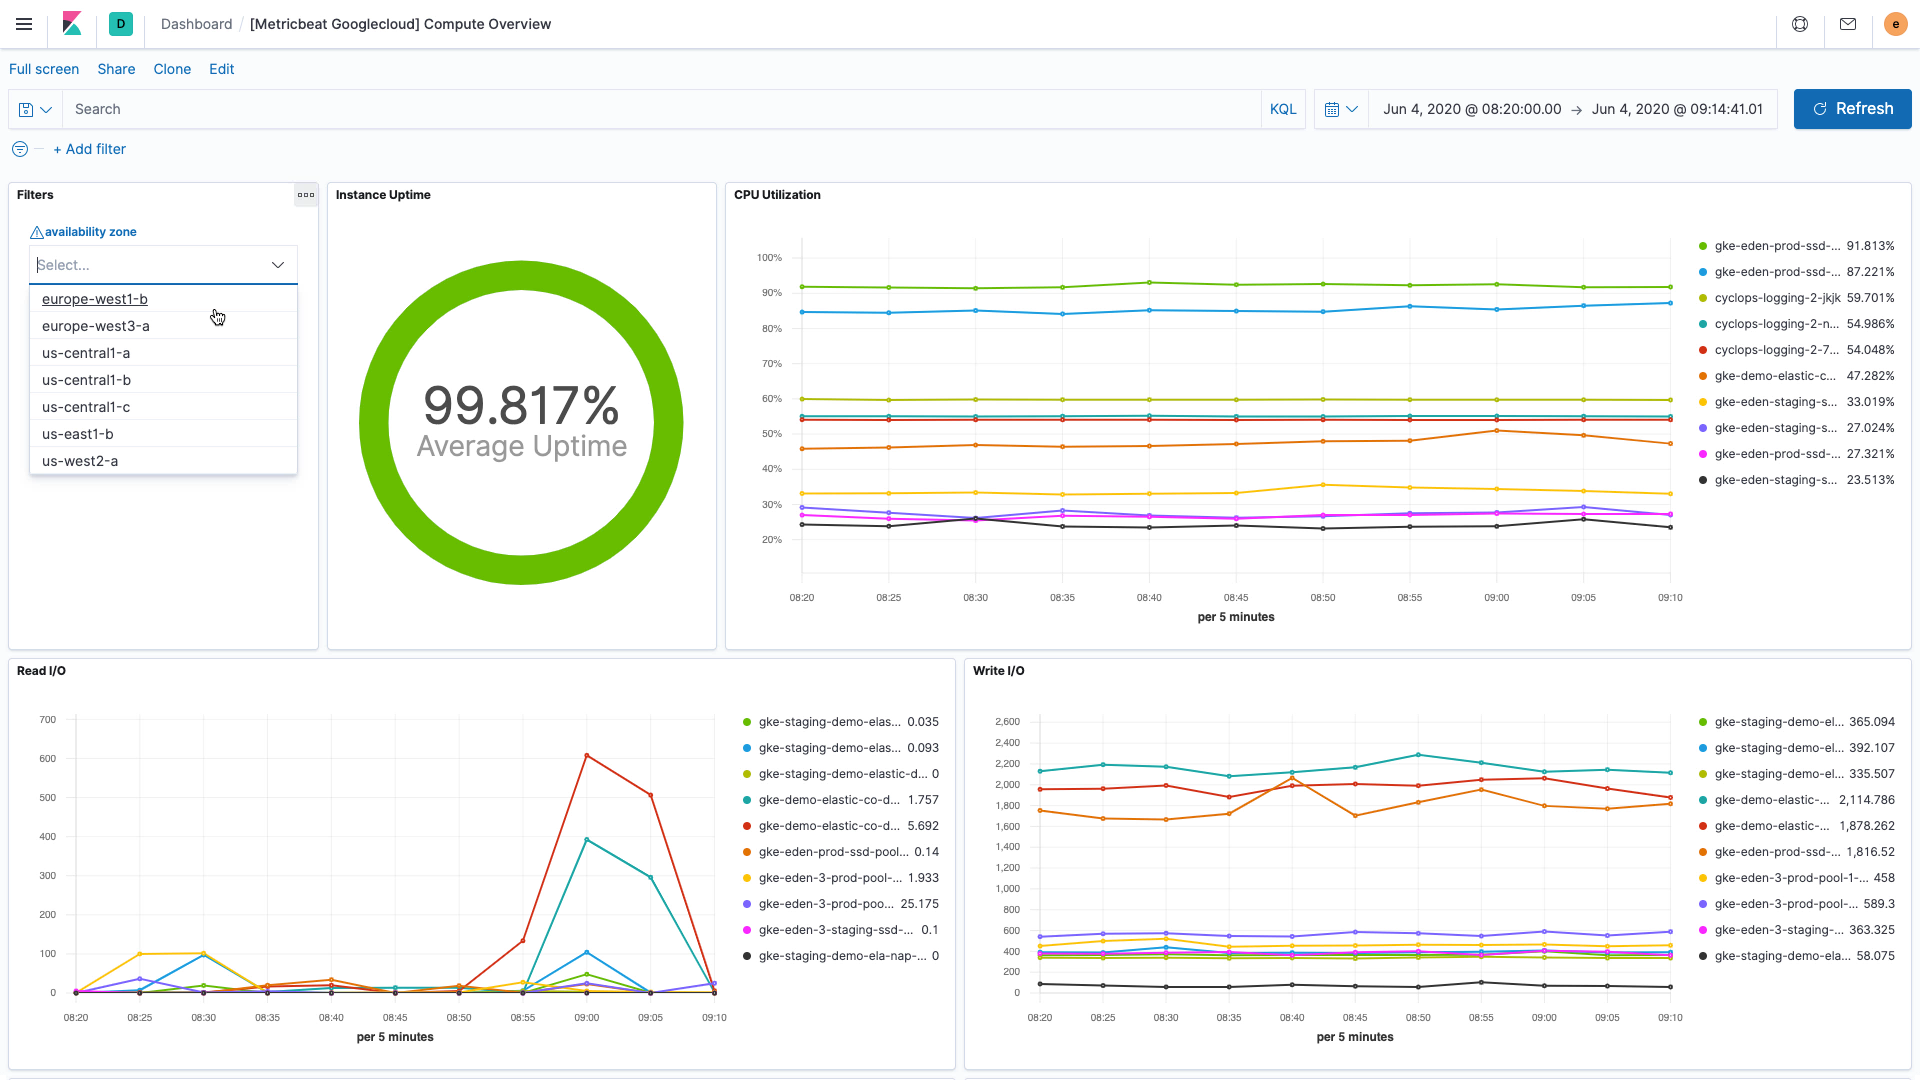
Beyond supporting reactive workflow, users have the freedom to combine this real-time telemetry data with powerful visualization, exploration, and analytical capabilities in the Elastic Stack to understand usage patterns and trends to help optimize and streamline their cloud operations.
Learn about this integration and other metrics feature in this detailed blog.
Certificate validity monitoring in Elastic Uptime
Downtime due to expired security certificates is far too common. For instance, in February 2020, Microsoft Teams was down for 3 hours because of an expired certificate. Beyond downtime, expired certificates on customer-facing sites also present a reputational risk that comes with browsers presenting an “insecure” notification on your site, reduced Google search result ranking, and putting your visitors at risk of fraud and identity theft. Fortunately, with a little proactive monitoring, this problem is easily avoidable.
Elastic Uptime, a free and open product for monitoring service uptime and availability, adds TLS / SSL monitoring to automatically track certificate validity and expiration dates on monitored hosts and services. Users can view all the certificates detected from their deployed monitors in a single page in the Uptime app, along with relevant information like issuing authority and expiration date. Users can also choose to be notified when a certificate is aged over X days or within Y days of the expiration. Through this preemptive tracking, users can take the necessary steps to replace the certificate before it expires and prevent customer-impacting issues from expired certificates.
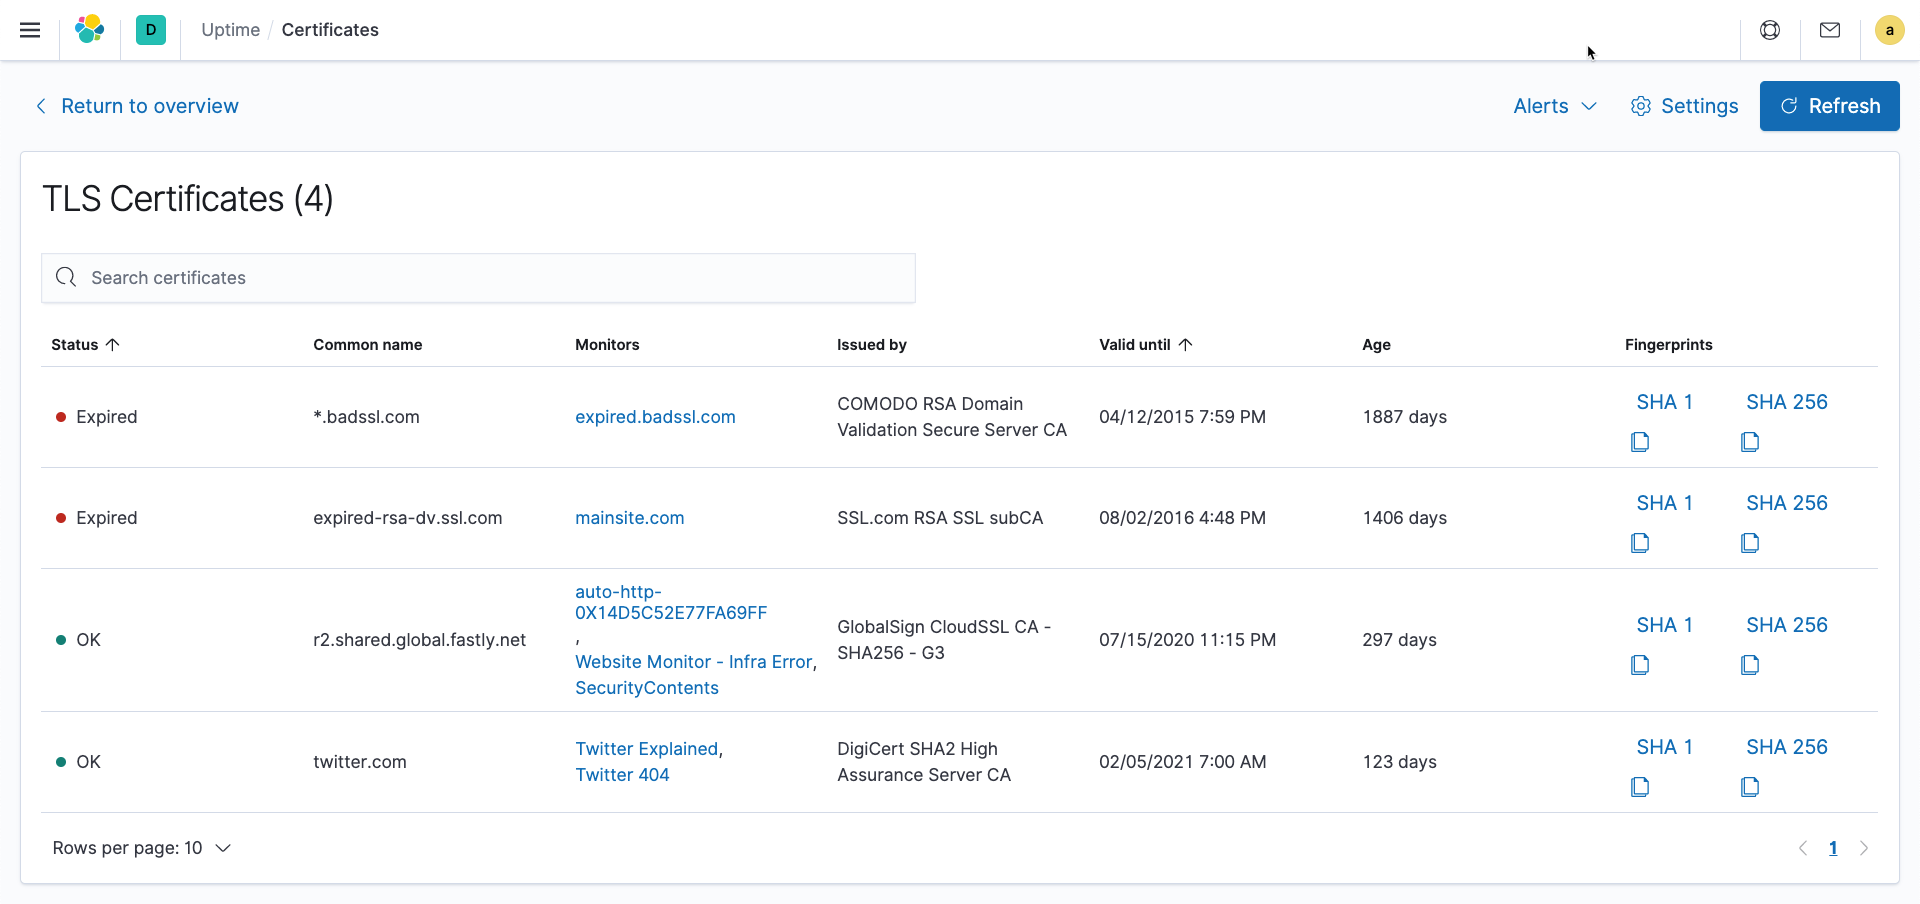
Best of all, this requires no extra work from the user. Uptime (once it is upgraded to 7.8) will automatically detect installed certificates and start tracking their validity.
Learn about this new capability and other Uptime features in this detailed blog.
Service maps pair up with machine learning to surface actionable health insights
What’s better than a service map that shows a 10,000-foot view of all your service connections and dependencies? An annotated service map that surfaces services with degraded performance in an easy-to-consume way.
We are excited to introduce health status indicators, powered by machine learning, to service maps in Elastic APM 7.8. Service maps automatically pull data from the machine learning integration in Elastic APM and color service nodes red, yellow, or green based on the anomaly score for the respective service's performance.
Layering health information into the service maps in this way enables a more proactive monitoring workflow. For example, a yellow node might suggest the start of a degradation and allow the operator to analyze impact and take action before end users actually experience issues.
Service maps, which launched as a beta feature in version 7.7, provide a big picture of how various services are connected to each other. It is an especially powerful tool for monitoring and troubleshooting today’s complex and distributed architectures with hundreds of microservices.
The prebuilt machine learning integration in Elastic APM automatically tracks and alerts on performance anomalies. By combining these two powerful features in a single view, we are simplifying and accelerating investigative workflows for the operator.
Try it out today
To start taking advantage of these new features and capabilities, upgrade your Elasticsearch Service deployment to 7.8, or grab a free 14-day trial of our Elasticsearch Service on Elastic Cloud or install the latest version of the Elastic Stack.