How to create a custom ServiceNow incident report dashboard in Canvas
Welcome back once again! This is the third and final part of this series on using the Elastic Stack with ServiceNow for incident management. In the first blog, we introduced the project and set up ServiceNow so changes to an incident are automatically pushed back to Elasticsearch. In the second blog, we implemented the logic to glue ServiceNow and Elasticsearch together through alerts and transforms as well as some general Elasticsearch configuration.
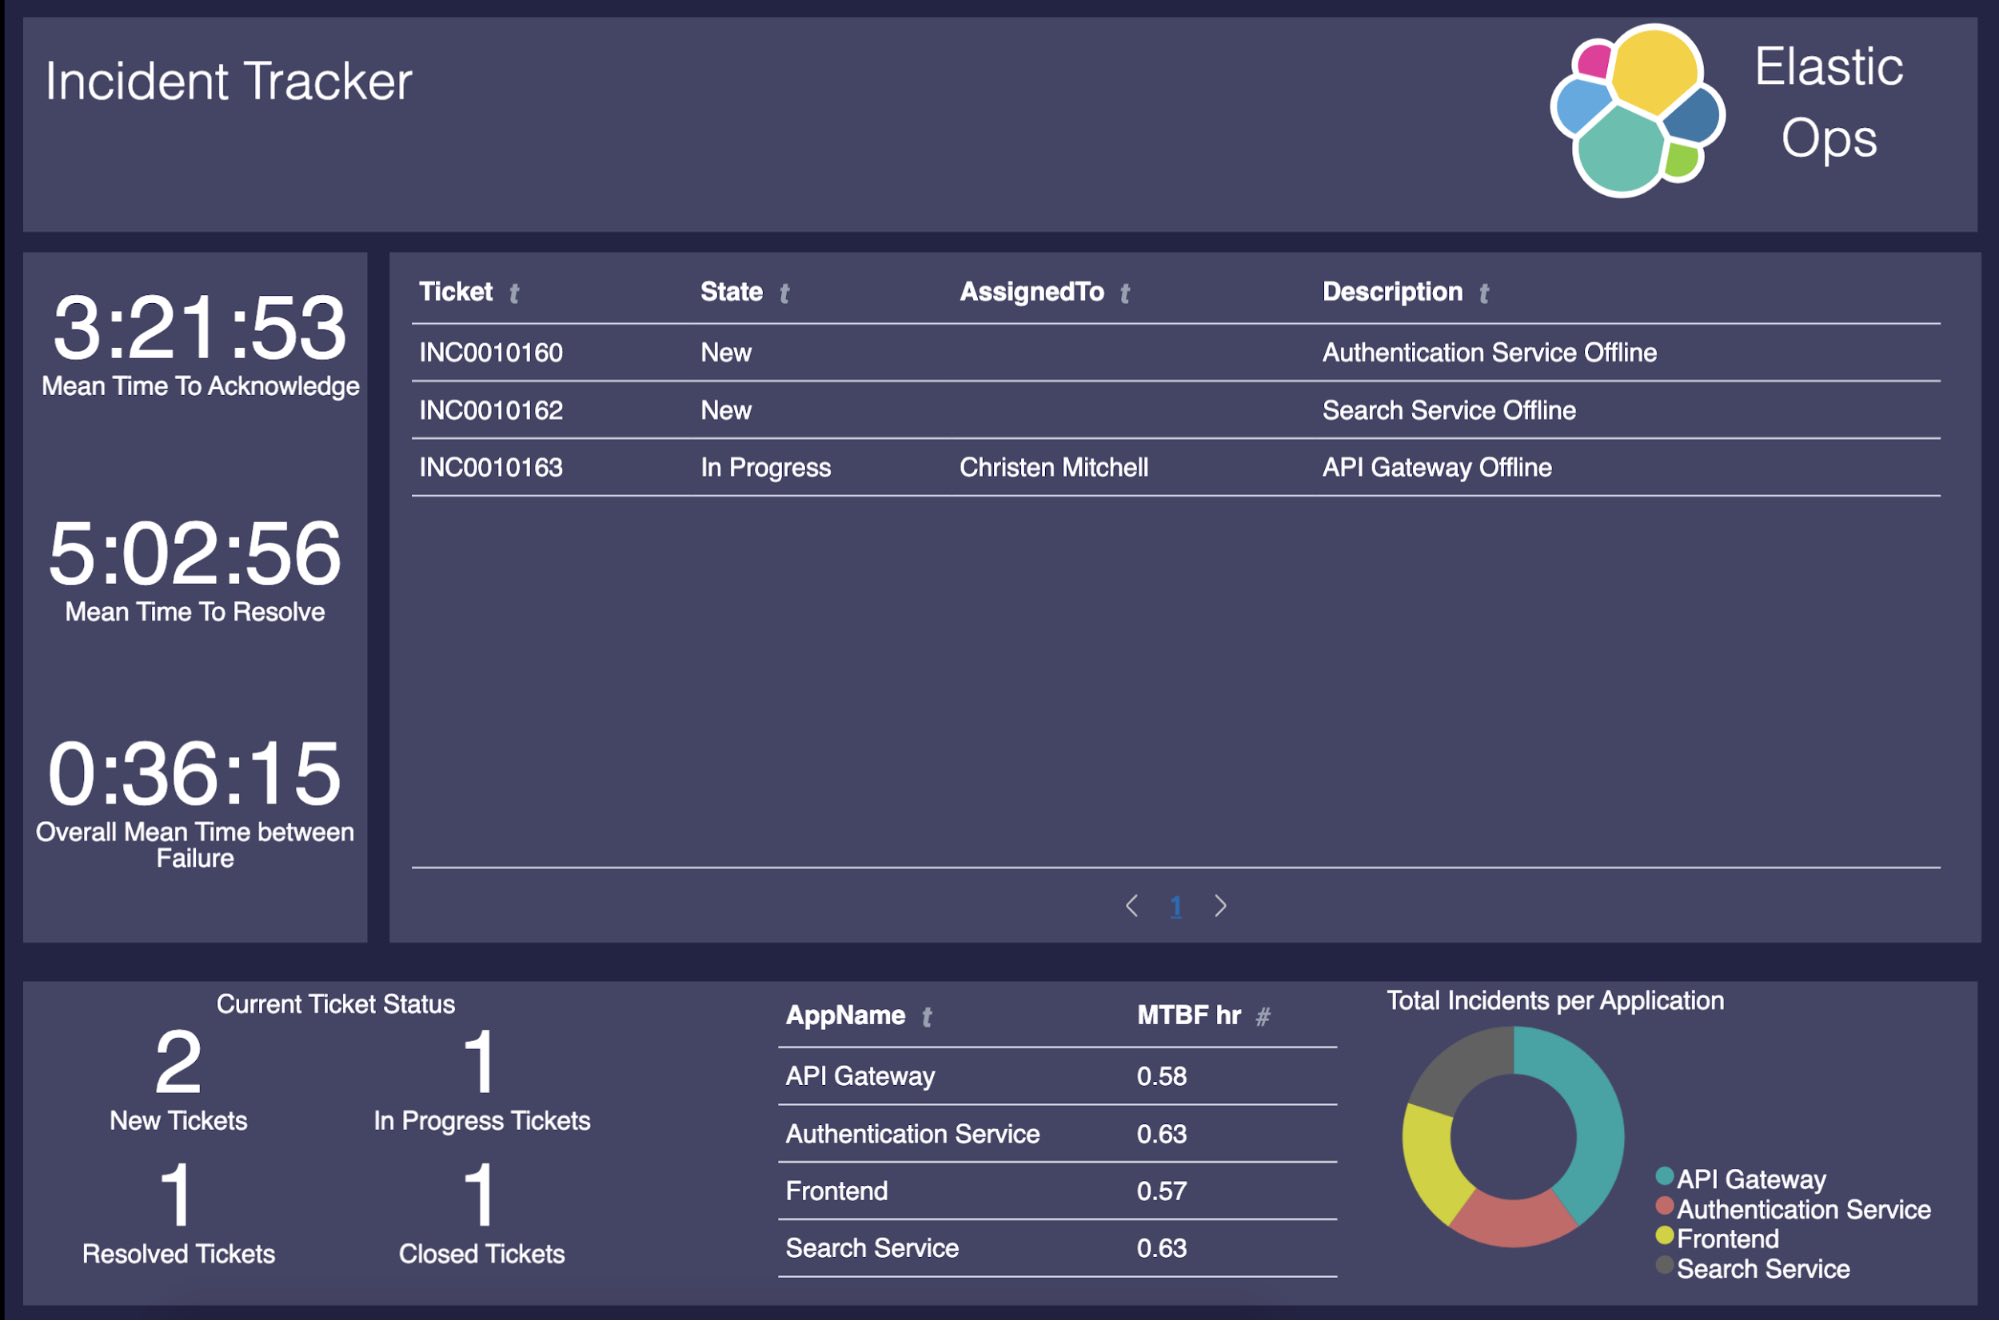
At this point, everything is fully functional. However, it is missing the handy (and pretty) front end we'll use for incident management!In this post, we will create the below Canvas workpad so folks can take all of that value that we have so far and turn it into something folks can easily understand and use.
Here's what we'll be showing in our dashboard:
- Open, closed, resolved, and WIP tickets
- Incident MTTA
- Incident MTTR
- Overall MTBF
- Application MTBF
- Incident per Application
Let's get started.
Setting up a Canvas workpad
Within this post, we will be using Canvas expressions heavily because all elements on a workpad are represented by expressions under the hood. It therefore means it is the easiest way to show you how to recreate capabilities.
Please note that if you don’t have any data within the entity centric indices that the transforms populate some of the below elements will provide an error message similar to “Empty datatable”.
Before we begin, let's open Canvas:
- Expand the Kibana tool bar.
- If you’re running version 7.8 or higher, this can be found under Kibana, otherwise it will be in the list of all of the other icons.
- Click the Create Workpad button.
- Once a workpad has been created, give it a name. This can be set within the Workpad Settings on the right hand side. I would recommend changing “My Canvas Workpad” to “Incident Tracker”. This is also where we set the background color in the next steps.
- To edit the Canvas expression for a given component, click on it and then click on the </> Expression editor at the bottom right.
Setting up the theme
The first step of creating our Canvas workpad is the background appearance:
- Set the background color to #232344.
- Create the four shape elements in the shape of a rectangle and set their fill color to #444465.
- Add the logo and text on the top bar such as company logo, company name, and a title.
Showing tickets in action
Now we need to build out the table in the middle that shows which tickets are in action. To do this, we are going to use a combination of Elasticsearch SQL and Canvas expressions along with a "data table" element. To, create the data table element, copy the following Canvas expression into the editor, and click run:
filters
| essql
 query="SELECT incidentID as Ticket, LAST(state, updatedDate) as State, LAST(assignedTo, updatedDate) as AssignedTo, LAST(description, updatedDate) as Description FROM \"servicenow*\" group by Ticket ORDER BY Ticket ASC"
| filterrows fn={getCell "State" | any {eq "New"} {eq "On Hold"} {eq "In Progress"}}
| table
 font={font family="'Open Sans', Helvetica, Arial, sans-serif" size=14 align="left" color="#FFFFFF" weight="normal" underline=false italic=false} paginate=true perPage=10
| render
In this expression, we run the query and then filter out all rows except those which have a State field set to “New”, “On Hold”, or “In Progress”.
At this point, it will probably be empty as we don’t have any data. This is because our business rule may not have been executed so there isn’t any ServiceNow data within Elasticsearch. If you want, you can create some fake incidents here. If you do, make sure you have tickets in various stages to make the table look a bit realistic.
Calculating mean time to acknowledge (MTTA)
To show incident MTTA, we'll add a metric element and use the below Canvas expression.
filters
| essql
 query="SELECT * FROM (SELECT incidentID, updatedDate, state FROM \"servicenow-incident-updates\") PIVOT (MIN(updatedDate) FOR state IN ('New' as New, 'In Progress' as \"InProgress\"))"
| mapColumn "New" fn={getCell "New" | formatdate "X" | math "value"}
| mapColumn "InProgress" fn={getCell "InProgress" | formatdate "X" | math "value"}
| filterrows fn={getCell "InProgress" | gt 0}
| mapColumn "Duration" expression={math expression="InProgress - New"}
| math "mean(Duration)"
| metric "Mean Time To Acknowledge"
 metricFont={font family="'Open Sans', Helvetica, Arial, sans-serif" size=48 align="center" color="#FFFFFF" weight="normal" underline=false italic=false}
 labelFont={font family="'Open Sans', Helvetica, Arial, sans-serif" size=14 align="center" color="#FFFFFF" weight="normal" underline=false italic=false} metricFormat="00:00:00"
| render
This expression uses more advanced Elasticsearch SQL functions, including PIVOT. To calculate the MTTA, we calculate the total time between creation and acknowledgement and then divide that by the number of incidents. We need to use PIVOT here because we store each update the user makes to the ticket in ServiceNow. This means that every time someone updates the state, worknotes, assignee, and so on, the update is pushed to Elasticsearch. This is fantastic for doing analytics on those results. Due to this, we will need to pivot the data so that we get one row per incident, with the first time the incident was “New” and the first time it moved to “In Progress”.
We can then calculate the time to acknowledge by subtracting the time it was created from the time each incident was acknowledged. The MTTA is calculated by using mean over this duration field function.
Calculating mean time to resolve (MTTR)
To show incident MTTR, we'll add a metric element and use the following Canvas expression:
filters
| essql
 query="SELECT * FROM (SELECT incidentID, updatedDate, state FROM \"servicenow-incident-updates\") PIVOT (MIN(updatedDate) FOR state IN ('New' as New, 'Resolved' as \"Resolved\"))"
| mapColumn "New" fn={getCell "New" | formatdate "X" | math "value"}
| mapColumn "Resolved" fn={getCell "Resolved" | formatdate "X" | math "value"}
| filterrows fn={getCell "Resolved" | gt 0}
| mapColumn "Duration" expression={math expression="Resolved - New"}
| math "mean(Duration)"
| metric "Mean Time To Resolve"
 metricFont={font family="'Open Sans', Helvetica, Arial, sans-serif" size=48 align="center" color="#FFFFFF" weight="normal" underline=false italic=false}
 labelFont={font family="'Open Sans', Helvetica, Arial, sans-serif" size=14 align="center" color="#FFFFFF" weight="normal" underline=false italic=false} metricFormat="00:00:00"
| render
Much like MTTA, we use the PIVOT function because we need to look at a summary view for each incident. Unlike MTTA, we get the first time we see the state when it’s new and also resolved. This is because the MTTR is the mean time it takes for a ticket to be resolved. This is very similar to MTTA, so for the sake of brevity I won’t repeat the same details.
Calculating overall mean time between failure (MTBF)
Now that we have the MTTA and MTTR, it's time for MTBF for each application. For this, we'll use our two transforms: app_incident_summary_transform and calculate_uptime_hours_online_transfo. Because of these transforms, calculating the overall MTBF is really easy. As MTBF is measured in hours, and our transform calculates it in seconds, we calculate the mean across all apps and then multiply the result by 3600 (seconds in an hour).
Let's create yet another metric element by using the below Canvas expression:
filters
| essql query="SELECT AVG(mtbf) * 3600 as MTBF FROM app_incident_summary"
| math "MTBF"
| metric "Overall Mean Time between Failure"
 metricFont={font family="'Open Sans', Helvetica, Arial, sans-serif" size=48 align="center" color="#FFFFFF" weight="normal" underline=false italic=false}
 labelFont={font family="'Open Sans', Helvetica, Arial, sans-serif" size=14 align="center" color="#FFFFFF" weight="normal" underline=false italic=false} metricFormat="00:00:00"
| render
Calculating application mean time between failure (MTBF)
Now that we've calculated the overall MTBF, we can easily show the MTBF for each application. All we need to do here is create a new data table element and display the data in a table using the following Canvas expression. For the sake of readability, I have rounded the MTBF for each application to two decimal points.
filters
| essql
 query="SELECT app_name as AppName, ROUND(mtbf,2) as \"MTBF hr\" FROM app_incident_summary"
| table paginate=false
 font={font family="'Open Sans', Helvetica, Arial, sans-serif" size=14 align="left" color="#FFFFFF" weight="normal" underline=false italic=false}
| render
Calculating resolved tickets
We want to see some wins, so we're going to make sure we have a "closed" count on our workpad. This is a simple metric element which gets all incidents where the state is set to “Resolved” and then the math function counts the unique number of incident IDs.
filters
| essql query="SELECT state,incidentID FROM \"servicenow*\" where state = 'Resolved'"
| math "unique(incidentID)"
| metric "Resolved Tickets"
 metricFont={font family="'Open Sans', Helvetica, Arial, sans-serif" size=48 align="center" color="#FFFFFF" weight="normal" underline=false italic=false}
 labelFont={font family="'Open Sans', Helvetica, Arial, sans-serif" size=14 align="center" color="#FFFFFF" weight="normal" underline=false italic=false} metricFormat="0,0.[000]"
| render
Calculating incidents per application
Now we'll create a donut chart which counts the number of unique incidents per application. I would recommend adding a markdown element above it with the text of “Total Incidents per Application” to give context to what the donut chart is showing.
filters
| essql
 query="SELECT incidentID as IncidentCount, app_name as AppName FROM \"servicenow*\""
| pointseries color="AppName" size="unique(IncidentCount)"
| pie hole=41 labels=false legend="se" radius=0.72
 palette={palette "#01A4A4" "#CC6666" "#D0D102" "#616161" "#00A1CB" "#32742C" "#F18D05" "#113F8C" "#61AE24" "#D70060" gradient=false} tilt=1
 font={font family="'Open Sans', Helvetica, Arial, sans-serif" size=14 align="left" color="#FFFFFF" weight="normal" underline=false italic=false}
| render
Calculating current ticket statuses
This section consists of four metric elements. They all have very similar Canvas expressions with only minor changes. In short, we'll get the latest update for all incidents and then use the filterrows Canvas expression function to keep the ones we want based on their status. With that, we simply count the number of unique incidents.
Use the expression below and update the state from New to each desired state. Furthermore, don’t forget to update the text on the metric from “New Tickets”.
filters
| essql
 query="SELECT incidentID, LAST(state, updatedDate) as State FROM \"servicenow*\" group by incidentID" count=1000
| filterrows fn={getCell "State" | eq 'New'}
| math "unique(incidentID)"
| metric "New Tickets"
 metricFont={font family="'Open Sans', Helvetica, Arial, sans-serif" size=48 align="center" color="#FFFFFF" weight="normal" underline=false italic=false}
 labelFont={font family="'Open Sans', Helvetica, Arial, sans-serif" size=14 align="center" color="#FFFFFF" weight="normal" underline=false italic=false} metricFormat="0,0.[000]"
| render
Finished product
Now that we have all of the different pieces of our Canvas workpad created, we get this extremely useful incident management dashboard:
We're done, so start using what you've learned!
And that's it! We have gone through a journey of using a number of components of the Elastic Stack to calculate MTTA, MTTR, MTBF based on ServiceNow Incidents and then displayed that information in a useful and visually appealing dashboard. An important takeaway we have here is that this information lives alongside your actual data, instead of within another tool. These metrics provide a good foundation of knowledge that folks can use to understand the health of an application in relation to the reported incidents. For example, if MTBF is very low, it means that the application fails very often. If the MTTA is high, it means that it takes a long time for an investigation into a failure to start.
If you have just been reading along and haven't been trying it out for yourself, I encourage you to roll up your sleeves and give it a try. You can spin up a free trial of Elastic Cloud and use it with your existing ServiceNow instance or with a personal developer instance.
Also, if you’re looking to search over ServiceNow data along with other sources such as GitHub, Google Drive, and more, Elastic Workplace Search has a prebuilt ServiceNow connector. Workplace Search provides a unified search experience for your teams, with relevant results across all your content sources. It’s also included in your Elastic Cloud trial.
This blog provides a foundation of using your data for tracking these metrics. As an example, if you want to take it further you can create incidents based on your logs, infrastructure metrics, APM traces and your machine learning anomalies. To provide additional value to the stakeholders of this Canvas dashboard, why not add links to the apps in Kibana (Logs, APM, etc) or your own dashboards that give them a head start in interrogating what the root cause for the respective issue was.
If you've enjoyed this series, here are some links I think you'll also like:
- When to use Data Transforms
- Getting started with machine learning
- Intro to Canvas: A new way to tell visual stories in Kibana
- Using Canvas’s Metric Element and Markdown to add links
Enjoy!