Canvas: Metric and Markdown Elements
Exploring Canvas Elements in Kibana
Canvas currently provides a selection of approximately 20 built-in elements that can be added to workpads (see the Getting Started blog for a full list). In this blog, we are going to focus on just two of them: Metrics and Markdown
 | Metric:A simplified textbox that only displays one data value with a label |
 | Markdown:A full-featured textbox that displays dynamic data using handlebars.js {{variables}} and markdown syntax |
Note: If you already have Canvas and the sample data installed, you can skip the review section and jump straight to the main tutorial: Working with Metrics
Quick Review
If you haven’t already worked through the Getting Started blog, it’s highly recommended that you go back and work through it, because in this blog, we’re going to build on the previous concepts and assume you have the following:
- Elasticsearch and Kibana up and running (version 6.4+)
- Canvas installed
Creating a Canvas Workpad
- Click on the “Canvas” tab in the sidebar
- Click “Create workpad”
- Give the new workpad a unique nam
Installing Sample Data
For this tutorial, we are going to be using a sample data set that is provided by Elastic — specifically, the sample flight data.
Note: This data set is only available in Kibana versions 6.4 or greater.
Navigate to your Kibana instance:
- Click on the main “Kibana” home page in the sidebar
- At the bottom of the “Add Data to Kibana” section, click on the link that says “Load a data set and a Kibana dashboard.”
- In the “Sample flight data” tile, Click “Add”
Quick Reference
The table below provides information about the sample data set that was just installed. The fields in bold underline are the ones we will be using later in this activity, but feel free to play around with some of the others.
| kibana_sample_data_flights | ||
AvgTicketPrice Carrier DestCityName DestCountry FlightDelayType FlightTimeMin OriginCityName OriginCountry Dest DestAirportID DestLocation | DestRegion DestWeather DistanceKilometers DistanceMiles FlightDelay FlightDelayMin FlightNum FlightTimeHour Origin OriginAirportID | OriginLocation OriginRegion OriginWeather _id _index _score _type dayOfWeek hour_of_day timestamp |
Working with Metrics
Starting Basic
Let’s find the total number of minutes spent on flight delays and display it in a metric element. To do that, we’re going to use a SQL query to grab the total from the FlightDelayMin field from our sample data set.
- Click "Add Element"
- Choose “Metric”
- TIP: When an element is first created, it is populated with demo data so you can start playing with it right away!
- In the editing panel on the right, select the “Data” tab
- Click “Change your data source”
- Select “Elasticsearch SQL”
- Type the following into the SQL query editor:
SELECT
    SUM(FlightDelayMin) AS delay
FROM
    kibana_sample_data_flights
Explaining further: This SQL query is selecting all the json values with the key FlightDelayMin from the index kibana_sample_data_flights. This data is being returned in a “column” named “delay”.
- Click “Save”
Notice that the metric element is now showing a warning symbol. This is because the element is pointed at the wrong data.
- At the top of the editing panel on the right, select the “Display” tab
- In the "Numbers" section, set the following:
- Measurement: Value
- Field: delay
- Change the metric’s label to say: “Total Delay in Minutes”
Customizing Things
Let’s add a time filter so that we can see the total number of minutes spent on flight delays for a given span of time.
- Click “Add element”
- Choose “Time Filter”
Notice that the metric element now shows a warning symbol. This is because all the elements in the workpad are immediately affected by the time filter, but the time filter is not configured correctly yet.
- Move the time filter to an empty location on the workpad
- The default time field for the time filter element is @timestamp which isn't correct in this case. In the editing panel for the time filter, set the column value to be: timestamp (i.e. delete the @ symbol)
- Click “Set”
- Click on the time filter and select the following time spans:
- Last 24 hours
- Last 7 days
- Last 2 weeks
Note: There are a total of 4 weeks of sample data. 2 weeks of "past" data, and 2 weeks of "future" data, with the midpoint being the date that the sample data was installed.
Getting More Advanced
Now let’s try getting the average flight delay. This is going to require us to customize the code behind the scenes just a little bit, in order to make it look nice.
- Make sure that the first metric that we created is selected.
- In the far upper right-hand corner of the screen, click the “Duplicate” button
- Move the new metric element to an empty location on the workpad
- Change the metric’s label to say: “Average Delay in Minutes”
- Select the “Data” tab
- Type the following into the SQL query editor:
SELECT
    AVG(FlightDelayMin) AS delay
FROM
    kibana_sample_data_flights
- Click “Save”
- Expand the metric element so that you can see the whole number
- You should see something like the following number: 47.33517114633586
- Clearly, it would be nice if we could round this number off
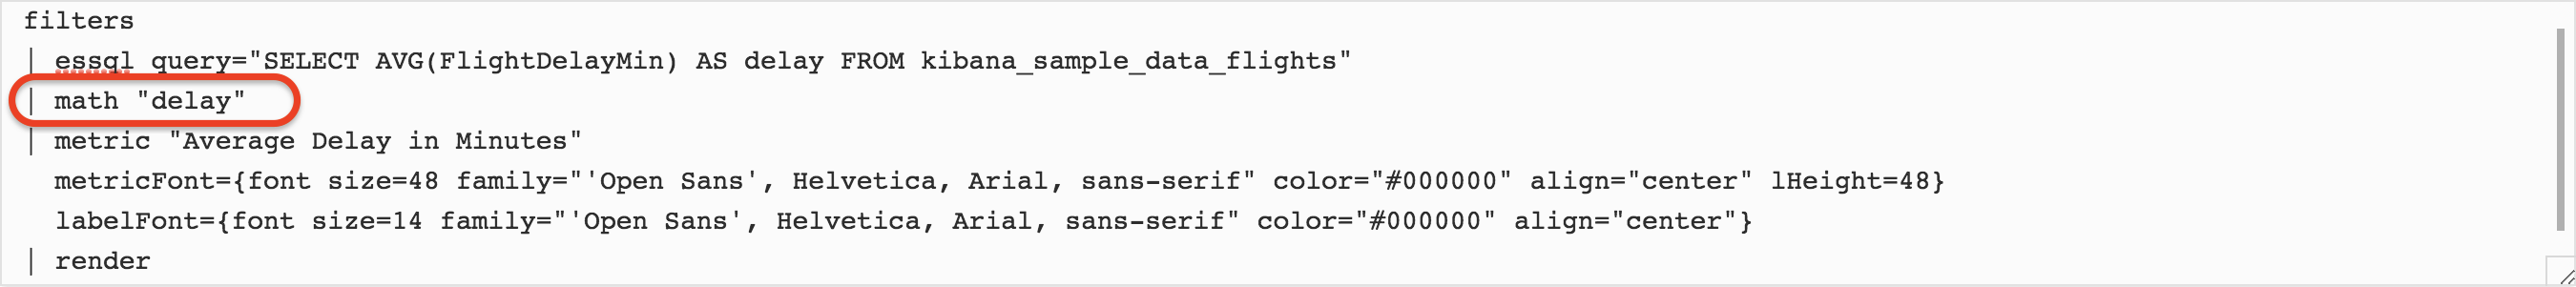
- In the bottom right-hand corner, click on the “Expression editor”. This opens up a code editor which allows us to modify the code powering the selected element.
- In the expression editor on the third line of code, you should see a “math” function. This is the line of code we want to modify:
- In the Canvas documentation, Elastic provides a list of math functions that we can use
- We want to use the round(a,b) function
- a is the value to be rounded
- b is the number of decimal places
- In the expression editor, change line 3 to include the rounding function, as shown below:
- Line 3: | math "round(delay,0)"
- In the lower right hand corner of the expression editor, click “Run”
Working with Markdown
Starting Basic
Let’s find the total number of flights and display the result in a markdown element. To do that, we’re going to run a SQL command against the FlightNum field from our sample data set.
- Click “Add Element”
- Choose “Markdown”
- TIP: When an element is first created, it is populated with demo data so you can start playing with it right away!
- In the editing panel on the right, select the “Data” tab
- Click “Change your data source”
- Select “Elasticsearch SQL”
- Type the following into the SQL query editor:
SELECT
    FlightNum
FROM
    kibana_sample_data_flights
- Click “Save”
- Click on the “Display” tab
- Delete everything out of the “Markdown content” editor except for:
**{{rows.length}} rows**
Note: The markdown element, as indicated by its name, fully supports markdown syntax: e.g. **, ##, ```, etc. For those unfamiliar with markdown syntax, in the example above, we are surrounding the text with ** to make the text bold.
- Click “Apply”
- The markdown element now shows the total number of rows in the data set, which is the total number of flights. Update the text to be the following:
Total number of flights: **{{rows.length}}**
- Click “Apply”
- Click on the “+” sign in the Markdown editor in the upper right-hand corner of the screen
- From the drop-down menu, select “Text Settings”
- In the text settings, adjust the following:
- Font Size: 36
- Alignment: Centered
- Resize the markdown element to better fit the text
Customizing Things
Now let’s find out how many flights were delayed, and for what reason. To do this, we’re going to use the FlightDelayType field.
- Click “Add Element”
- Choose “Markdown”
- In the editing panel on the right, select the “Data” tab
- Click “Change your data source”
- Select “Elasticsearch SQL”
- Type the following into the SQL query editor:
SELECT
    FlightDelayType,
    COUNT(FlightDelayType) AS count
FROM
    kibana_sample_data_flights
GROUP BY
    FlightDelayType
- Click “Save”
- Click on the “Display” tab
- Delete everything out of the “Markdown content” editor except for:
{{#each columns}}
 **{{name}}**
{{/each}}
- Explaining further:
- This is handlebar.js syntax. For each column returned by the SQL query, we are printing out the name of the column. However, we need to print out the value from each row in the FlightDelayType column. So, we will fix things in the next step.
- In the “Markdown content” editor, replace:
- columns with rows
- name with FlightDelayType
- Click “Apply”
- We now have a list of delay types. Let’s add the count for each type. In the “Markdown content” editor, replace the current contents with the code below:
{{#each rows}}
- {{FlightDelayType}} -- {{count}}

{{/each}}
- Explaining the code above:
- Line 1: For each row...
- Line 2: Print a "-" to indicate this is a list item, then print the two variables separated by "--"
- Line 3: Print a newline
- Line 4: End the loop
- Click “Apply”
Getting More Advanced
| In the markdown element that we just created, notice that one of the rows is: No Delays -- 2856 This is not really telling us anything about delays, in fact, quite the opposite, it is telling us about flights that left on time. Let’s get rid of that row so that we are only showing flights that actually got delayed. We’re going to accomplish this by using a Canvas function called, filterrows. | 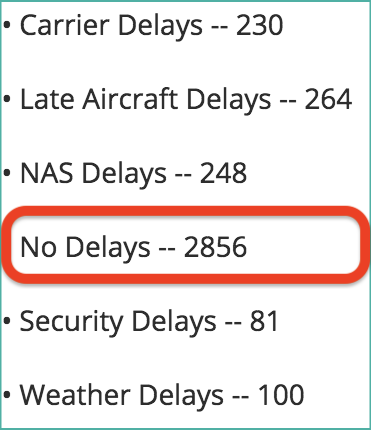 |
- Make sure that the markdown element that we just created (the one that shows all the delay types) is selected.
- In the bottom right-hand corner of the screen, click on the “Expression editor”. This opens up a code editor which allows us to modify the code powering the selected element.
- In the expression editor, you should see something similar to the following:
filters
| essql
  query="SELECT
    FlightDelayType,
    COUNT(FlightDelayType) AS count
FROM
    kibana_sample_data_flights
GROUP BY
    FlightDelayType"
| markdown "{{#each rows}}
- {{FlightDelayType}} -- {{count}}

{{/each}}"
- We’re going to pipe the data through the filterrows function before we then pipe it on to the markdown element. So let’s insert a newline at line 10 and add the filterrows function just above the | markdown function. Don’t forget the pipe | at the beginning of the line.
...
GROUP BY
    FlightDelayType"
<b style="background-color:#ffae5b"><i>| filterrows {}</i></b>
| markdown "{{#each rows}}
- {{FlightDelayType}} -- {{count}}
...
- We want to filter the rows based on the values contained in the FlightDelayType column. In order to do this, we need to use another function called getCell, which gives us the value of each row from a given column (docs for “getCell” function).
| filterrows { <b style="background-color:#ffae5b"><i>getCell “FlightDelayType”</i></b> }
- Next, we’re going to pipe the value from each row into a function called any, which returns true or false based on a check condition (docs for "any" function).
| filterrows {getCell “FlightDelayType” <b style="background-color:#ffae5b"><i>| any {}</i></b> }
- Finally, for the check condition, we are going to make sure that the value is not equal to “No Delay” using a function called neq (docs for "neq" function).
| filterrows {getCell “FlightDelayType” | any { <b style="background-color:#ffae5b"><i>neq “No Delay”</i></b> }}
- In the lower right hand corner of the expression editor, click “Run”. The row containing “No Delay -- 2856” should disappear.
Links to other helpful resources
That's it! You've just worked through several examples of using Metric and Markdown elements in Canvas. Try adding some other elements to your workpad and experimenting with the full capabilities of Canvas!
Also, check out some other Canvas tutorials here: