How to connect ServiceNow and Elasticsearch for bidirectional communication
The Elastic Stack (ELK) has been used for observability and security for many years now, so much so that we now offer the two as out-of-the-box solutions. However, identifying issues and finding the root cause is only part of the process. Often, organizations want to integrate the Elastic Stack into their everyday workflows so they can resolve those issues quickly. This typically involves integrating with some form of ticketing/incident tracking framework. Some teams use Slack or emails, while others use tools like ServiceNow or Jira. In this three-part series, we will walk you through setting up ServiceNow and Elasticsearch to automate incident management, as well as putting together a Canvas workpad to visualize and present and manage incidents.
In this first blog, we are going to explore setting up a bidirectional relationship between Elasticsearch and ServiceNow, a popular workflow management tool often used for its service desk capability. The idea is to (1) create a ticket automatically through anomaly-based alerting powered by machine learning and (2) automatically update Elasticsearch whenever that ticket is updated. Why? For a full 360-degree overview of your entire ecosystem — from incident detection to investigation and management. As part of this process, we will calculate these resiliency metrics:
- Mean time to acknowledgement (MTTA) — A key metric used for tracking responsiveness. If MTTA is high, it can often indicate that the team is suffering from alert overflow and therefore taking too long to respond.
- Mean time to resolution (MTTR) — Great for seeing how long tickets take to resolve. This is calculated based on the average time it takes for a ticket to go from the ‘In Progress’ state to ‘Resolved’ or ‘Closed.’
- Mean time between failures (MTBF) — Useful for understanding how resilient something is. The lower MTBF means that it fails quickly and often. This is measured in hours and is calculated by taking the total hours of running divided by the number of incidents where it is offline.
A single pane of glass is always better than jumping between a multitude of tools. Exposing MTTA, MTTR, and MTBF in the same tool used to identify and search the data means that those teams can see how specific applications, services, projects, teams, departments, or any entity start affecting the above resiliency metrics. By applying different lenses on top of the same data in Kibana, you can provide insights curated for your SREs, SOC analysts, and executives.
Example project
In this blog, we are going to use Elasticsearch, ServiceNow, and Heartbeat (our uptime monitor), and set them up so that the following occurs:
- Heartbeat is continuously watching our applications to ensure they are online and responsive.
- Watcher (an alerting framework built into Elasticsearch) creates an incident ticket in ServiceNow when an application has been down for more than 5 minutes, but, to reduce alert fatigue, it only does this when there isn’t an open or active ServiceNow ticket already for the specific application.
- Alex (me!) assigns the ticket to himself and starts working on it by adding notes.
- Whenever the ticket is updated in ServiceNow, the record is updated in Elasticsearch.
- Alex’s management uses Canvas to keep track of open tickets, MTTA, MTTR, MTBF, which applications are the most troublesome, and much more.
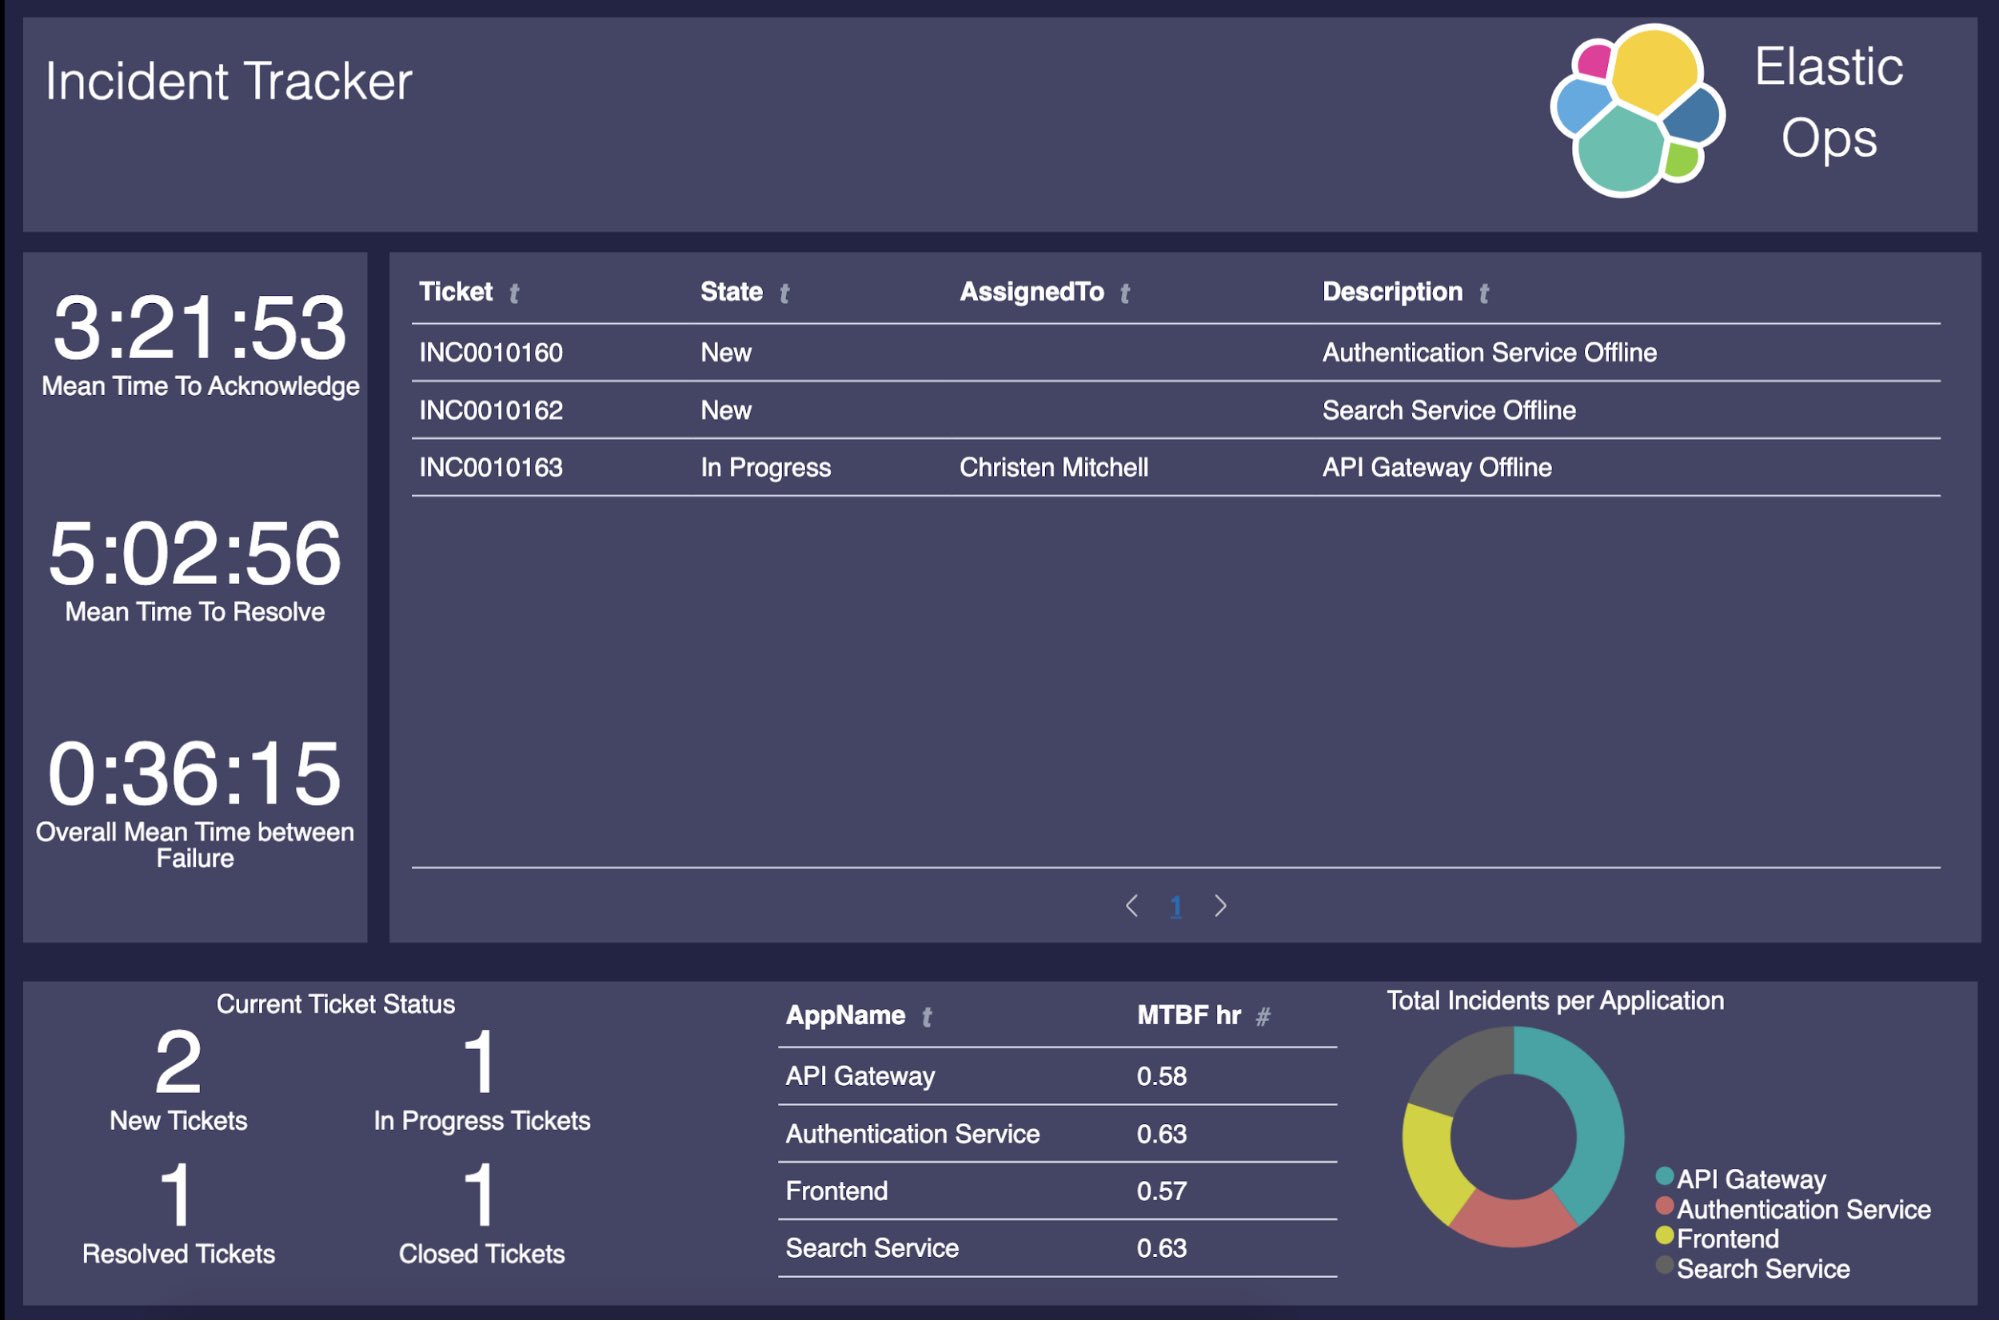
The final result will be the following Canvas dashboard:
There are going to be a few sections to this project:
- Set up ServiceNow
- Configure a business rule in ServiceNow to automatically update Elasticsearch
- Set up Heartbeat to monitor our applications
- Configure Elasticsearch indices
- Create some transforms to continuously calculate our metrics
- Use machine learning and alerting to automatically create the ticket in ServiceNow, but only if a ticket doesn’t exist
- Build out the above Canvas dashboard using advanced Elasticsearch SQL, like pivoting and Canvas expressions
If you don't have an Elasticsearch deployment to follow along with, you can spin up a free trial of our Elasticsearch Service on Elastic Cloud, or install it for free locally. And if you don't have a ServiceNow instance, you can spin up a personal developer instance.
Preparing ServiceNow
Personalizing the Incident form
This blog assumes that you have a fresh, brand-new instance of ServiceNow — most of the time this isn’t the case. However, the steps are very simple even with an existing setup. To begin with, we are going to update the Incident app so that we add a new field called Application to track which application is having an issue:
- Open the Incident app in ServiceNow.
- Create a temporary incident; the values really don’t matter.
- Go to the FormDesign wizard:
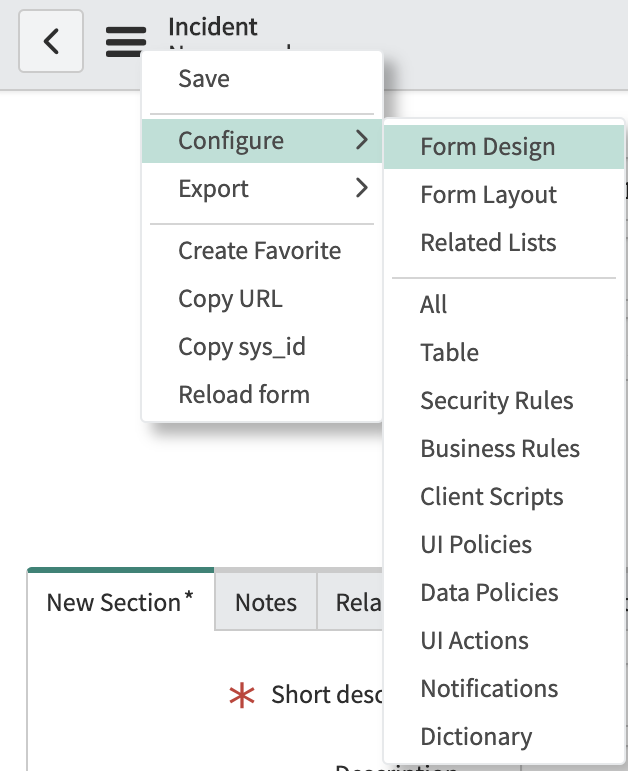
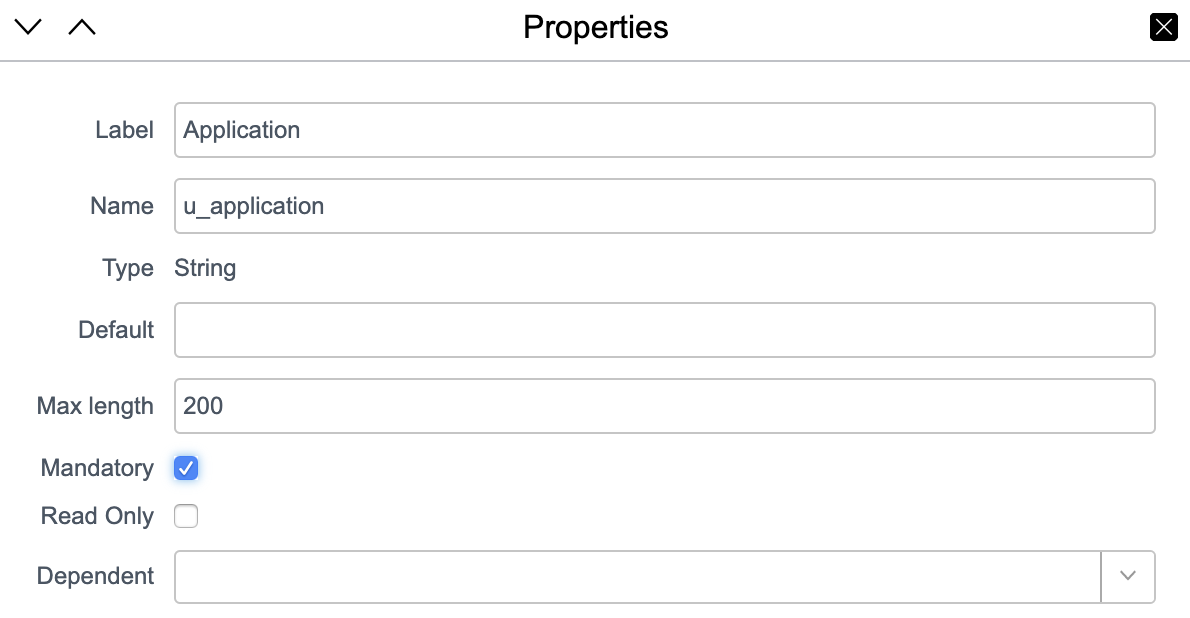
- For the sake of simplicity, we are only going to add a String field to track the application name in question. In a real production setup, it is probably best to set up the application as a specific entity within ServiceNow. Configure your new String field with the following settings:
- Save that and go back to the incident form and configure it using the
 icon to personalize what fields are present.
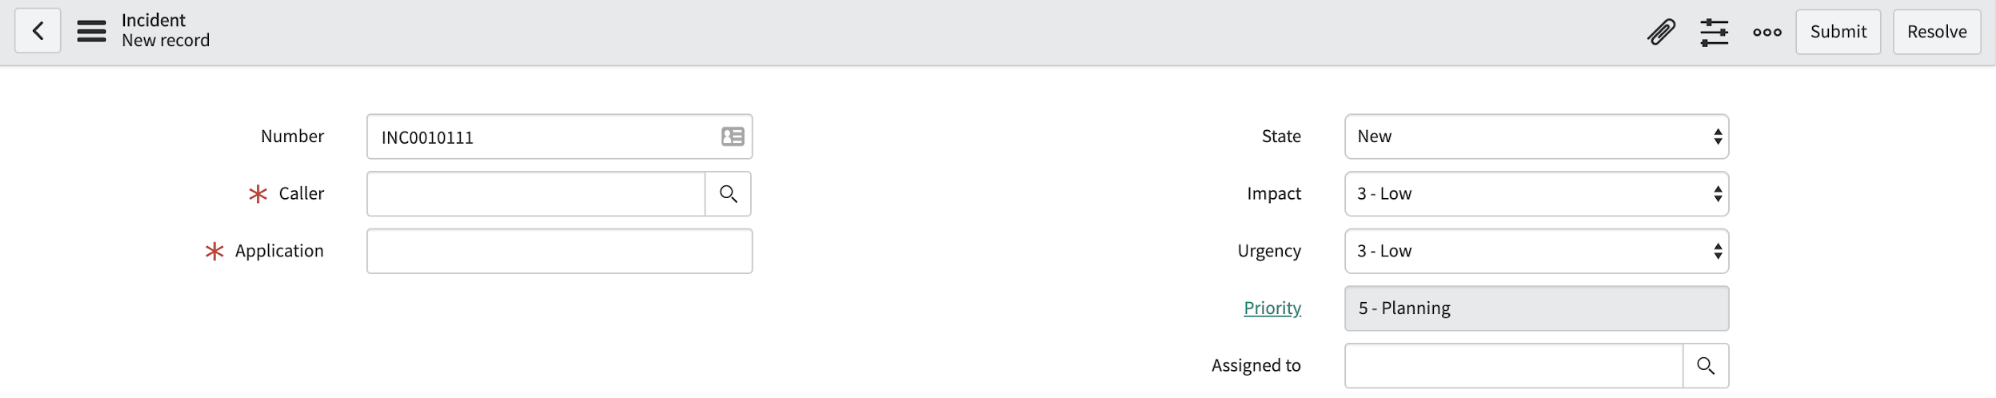
- At this point, we have an Incident form with our new specific field, which determines what application is in a pickle. Now, we need to configure ServiceNow so that it automatically updates Elasticsearch when our incidents are updated in any way.
Create a ServiceNow user for incidents created by Elasticsearch
It is important to know the source of an incident, and to do this ServiceNow uses the Caller field. We should set this field when we create our ticket so that we know it is an automatically generated ticket. To create a new user, go to the Users app within ServiceNow and create and save a new user with the following fields:
- Id: elastic_watcher
- First name: Elasticsearch Watcher
- Email: admin@elasticutilities.co
ServiceNow bidirectional comms
Creating an incident in ServiceNow is a simple REST API POST request, but configuring ServiceNow so it automatically updates Elasticsearch is slightly different. We are going to leverage a ServiceNow business rule. This rule will ‘monitor’ the Incidents table, and if any of a few specified fields change then it will run some logic that will index the changes into Elasticsearch. As credentials are required for Elasticsearch, we are going to do things properly:
- Creating a new role and user in Elasticsearch (principle of least privilege)
- Setting up the REST message and auth profile in ServiceNow
- Creating the business rule
Creating the Elasticsearch role and user
This is a very well documented process, so I won’t spend much time here. We need to have a role that can only index documents within the servicenow-incident-updates index alias. It is advised to have a specific role for this capability to adhere to the principle of least privilege. I have outlined the options below, showing the steps for using Kibana or the API:
Kibana
- Management -> Role
- Create role
- Set the fields to the following
- Indices: servicenow-incident-updates
- Privileges: index
API
You can use Console in Kibana for these:
POST /_security/role/servicenow_updater
{
  "indices": [
    {
      "names": [ "servicenow-incident-updates" ],
      "privileges": ["index"]
    }
  ]
}
Now, we create a user who has that role.
Kibana
- Management -> Users
- Create user
- Set the fields to the following
- Username: ServiceNowUpdater
- Password: Use your initiative
- Role: servicenow_updater
API
POST /_security/user/ServiceNowUpdater
{
  "password" : "CHANGE THIS TO SOMETHING GOOD",
  "roles" : [ "servicenow_updater" ],
  "full_name" : "ServiceNow Incident Updater",
  "email" : "admin@example.com"
}
Create an Elasticsearch REST message and auth profile in ServiceNow
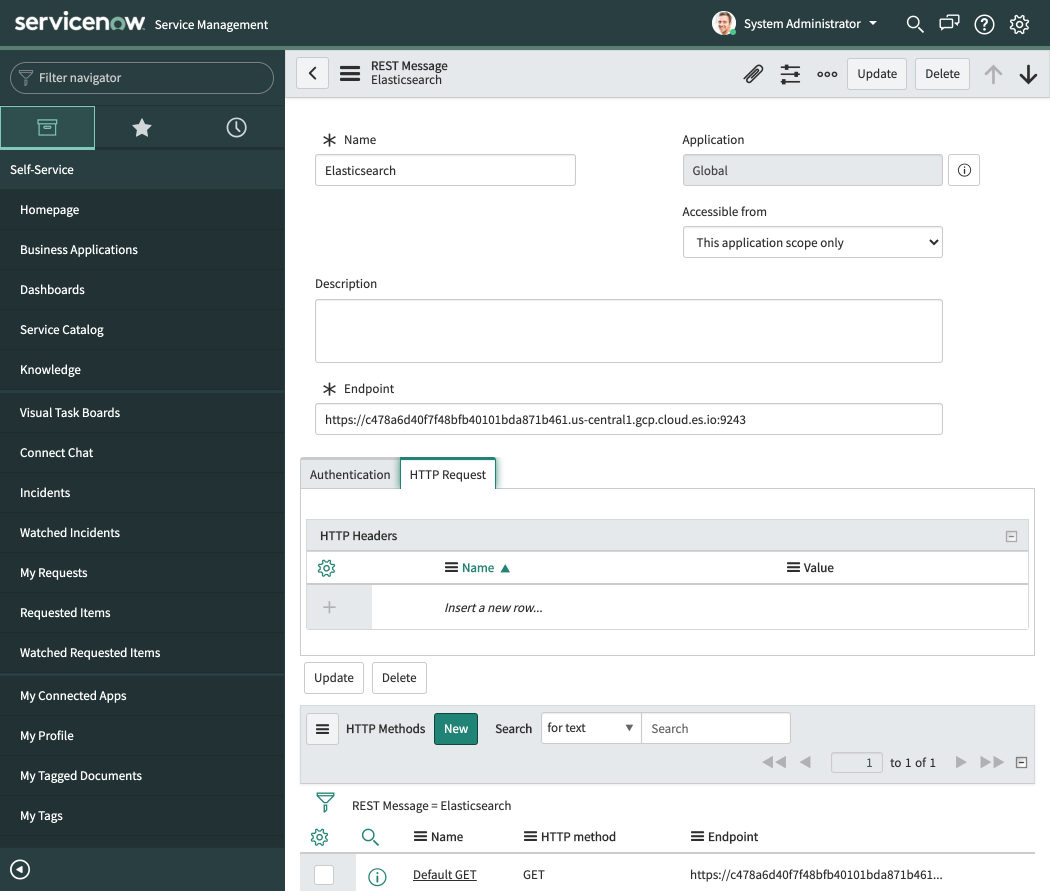
Now that Elasticsearch has a user set up for the functionality, we can work on ServiceNow. In ServiceNow, open the REST Messages app and create a new record. Set the name to “Elasticsearch” and set the endpoint to your Elasticsearch endpoint. As I am running it in Elastic Cloud, my endpoint is <a href="https://[CloudID].westeurope.azure.elastic-cloud.com:9243">https://[CloudID].westeurope.azure.elastic-cloud.c...</a>.
Our next step is to set up authentication. To do this, we set the Authentication type to Basic and click the magnifying glass on the Basic auth profile field.
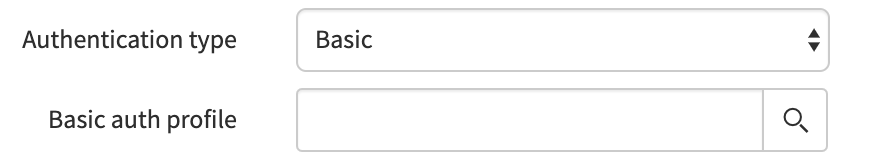
We are going to create a new basic auth configuration record. Set the name of this record to “ElasticsearchIncidentUpdater” and set the username and password field to the respective values used above. For me, that would be:
- Username: ServiceNowUpdater
- Password: [CHANGE THIS TO SOMETHING GOOD]
Save this record and go back to the Elasticsearch record in the REST Message app. Ensure that our new basic auth profile is being used. If the “HTTP Methods” section is visible, you will need to click submit and then re-open the REST Message that we called Elasticsearch above.
It should looks like this:
Next, we are going to create a new HTTP method record in ServiceNow. There are a few bits to do here so pay close attention:
- Click the New button next to where it says “HTTP Methods”.
- Set Name to UpdateIncident.
- Set HTTP method to POST.
- Ensure authentication type is set to inherit from parent.
- Set the endpoint to your Elasticsearch endpoint (including port) and then append
/servicenow-incident-updates/_docto it, for example:<a href="https://[CloudID].westeurope.azure.elastic-cloud.com:9243/servicenow-incident-updates/_doc">https://[CloudID].westeurope.azure.elastic-cloud.c...</a> - Create an HTTP header with the name of “Content-Type” and value of “application/json”.
- Set the Content field to:
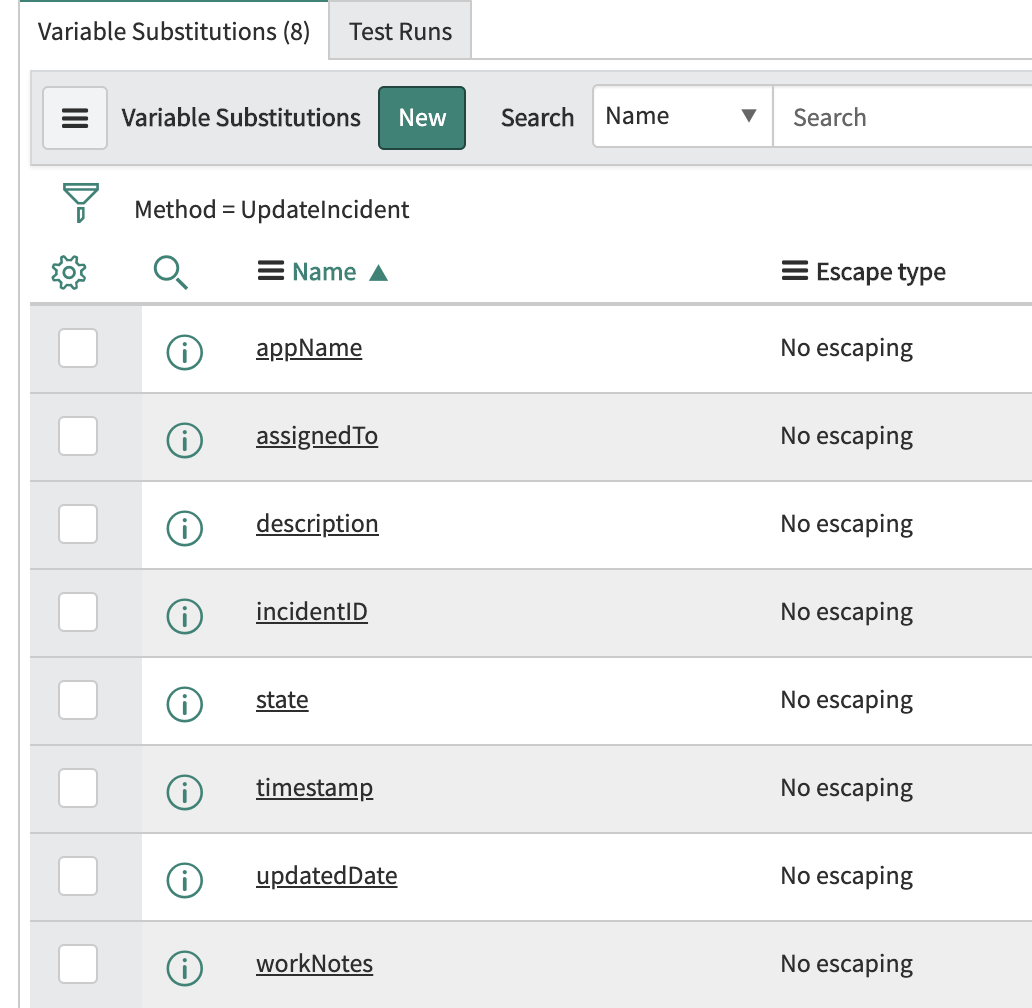
{"@timestamp": "${timestamp}", "incidentID": "${incidentID}", "assignedTo": "${assignedTo}", "description": "${description}", "state": "${state}", "updatedDate": "${updatedDate}", "workNotes": "${workNotes}", "app_name": "${appName}"} - Create the following variable substitutions by using the New button and specifying the specified “Names” found in the below screenshot (you may need to click the Submit button and go back into the endpoint before the variable substitution UI component shows). Under “Related Links” there is a link that says “Auto-generate variables”, I recommend you use that.
- Click Update on the top right, which takes you back to the REST message form.
- Click Update to save.
Okay — a lot has happened! Most of it should be easy to follow, but steps 7 and 8 may need an explanation, which is best done in reverse. Step 8 adds variables to the record so that when performing the request those variables can be substituted in the content of the outbound REST message. Step 7 leverages those variables and we build up the content field of the POST request. It is important to note that this content field is going to be sent to Elasticsearch.
Create the ServiceNow business rule
This section is the core component that allows us to send updates to Elasticsearch whenever an incident is created or updated. To do this, we need to open the Business Rules app in ServiceNow and create a new rule. There are a few parts to do this, we need to configure the table to run on, when to run, and then the running logic. First, it needs a name. Set the name field to “Elasticsearch Update Incident” and set the table to “incident”. It is important here to also select the “Advanced” box as we are going to be using a custom script.
Set the “When to run” box so it looks like this:
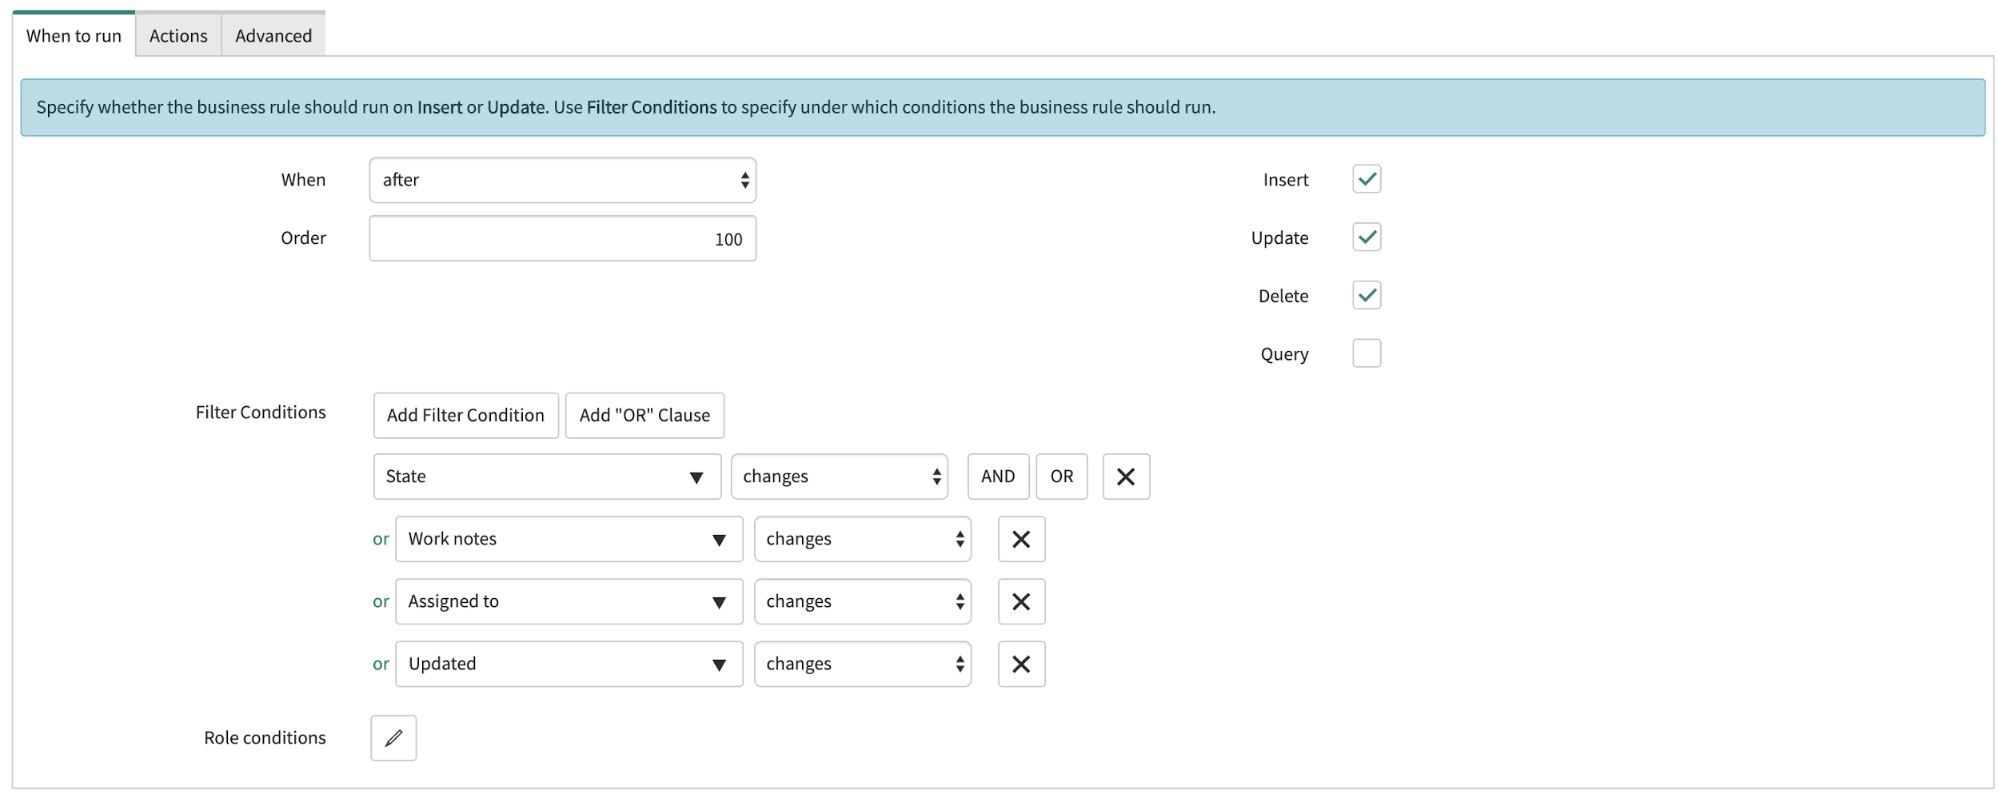
This configuration means that the business rule will run after the incident has been inserted, updated, or deleted. The rule should run when the state, work notes, assigned to, or updated field are updated.
Our next step is the glue that ties everything we have done together. We need to go to the Advanced tab and set the script to be the same as this snippet:
(function executeRule(current, previous) {
    try {
        var r = new sn_ws.RESTMessageV2('Elasticsearch', 'UpdateIncident');
        r.setStringParameterNoEscape('incidentID', current.number);
        r.setStringParameterNoEscape('description', current.description);
        r.setStringParameterNoEscape('updatedDate', current.sys_updated_on);
        r.setStringParameterNoEscape('assignedTo', current.getDisplayValue("assigned_to"));
        r.setStringParameterNoEscape('state', current.getDisplayValue("state"));
        r.setStringParameterNoEscape('workNotes', current.work_notes);
        r.setStringParameterNoEscape('appName', current.u_application);
        r.setStringParameterNoEscape('timestamp', new GlideDateTime().getValue());
        r.execute();
    } catch (ex) {
    gs.info(ex.message);
    }
})(current, previous);
This script uses the Elasticsearch REST message that we created. In particular, it uses the UpdateIncident POST request, populates the variable substitutions that we created with the relevant fields from the incident, and then sends it to the servicenow-incident-updates within Elasticsearch.
Save it, and you are good to go.
Using Heartbeat to monitor our applications
One of the questions that uptime monitoring answers is “Is it up or down?” It does this by using the data that Heartbeat generates. Heartbeat periodically pings an endpoint using TCP, HTTP, or ICMP, gathering part of the story for observability. Knowing whether your host, service, website, or API is live is important to understand the availability of your ecosystem. Heartbeat takes this further by gathering response times and response codes. This, combined with logs, metrics, and APM data makes connecting the dots and correlating activity across your ecosystem simple.
Getting started with Heartbeat is easy. Just follow the steps in our Heartbeat documentation.
For this project, I have set up Heartbeat to check on four services. This is a snippet from the heartbeat.yml file:
heartbeat.monitors:
- name: "Authentication Service"
  type: http
  urls: ["192.168.1.38/status"]
  schedule: '@every 1m'
  check.response.status: 200
- name: "Search Service"
  type: http
  urls: ["192.168.1.109/status"]
  schedule: '@every 1m'
  check.response.status: 200
- name: "Frontend"
  type: http
  urls: ["192.168.1.95/status"]
  schedule: '@every 1m'
  check.response.status: 200
- name: "API Gateway"
  type: http
  urls: ["192.168.1.108/status"]
  schedule: '@every 1m'
  check.response.status: 200
Bidirectional communications engaged!
And that's it! We're ingesting uptime data into Elasticsearch, and Elasticsearch is connected to ServiceNow for bidirectional communication. As mentioned above, this is part of a three section series. If you're ready for more, jump over to part 2, where we cover setting up Elasticsearch so that if something goes wrong, an incident is created in ServiceNow!
Interested in giving this a go? The easiest way to do that is to use Elastic Cloud. Either log into the Elastic Cloud console or sign up for a free 14-day trial. You can follow the above steps with your existing ServiceNow instance or spin up a personal developer instance.
Also, if you’re looking to search over ServiceNow data along with other sources such as GitHub, Google Drive, and more, Elastic Workplace Search has a prebuilt ServiceNow connector. Workplace Search provides a unified search experience for your teams, with relevant results across all your content sources. It’s also included in your Elastic Cloud trial.
Make sure you check out the Uptime application within Kibana. You can extend my above toy Heartbeat configuration to point to your ecosystem and start monitoring how it’s performing whilst also checking the TLS certificate status.