Getting started with Elastic Cloud
Elastic Cloud puts the power of the Elastic Stack in your hands within minutes. Whether you’re trying to add search capabilities with Elastic Enterprise Search, monitor critical systems and applications with Elastic Observability, or protect your organization from cyber threats with Elastic Security, taking the first step is easy.
Run how you want, where you want
Elastic Cloud gives you the flexibility to run in the public cloud of your choice, including Google Cloud, AWS, and Microsoft Azure. There are additional options for hybrid cloud, private cloud, and on-premises deployments.
You can also easily manage your own deployment using our built-in automation and orchestration tools.
This guide focuses on using Elastic Cloud’s managed service, Elasticsearch Service, which is the easiest way to get up and running with Elastic. Before diving in, be sure to learn about the benefits of our managed service and our shared responsibility.
Get to know the Elastic Stack
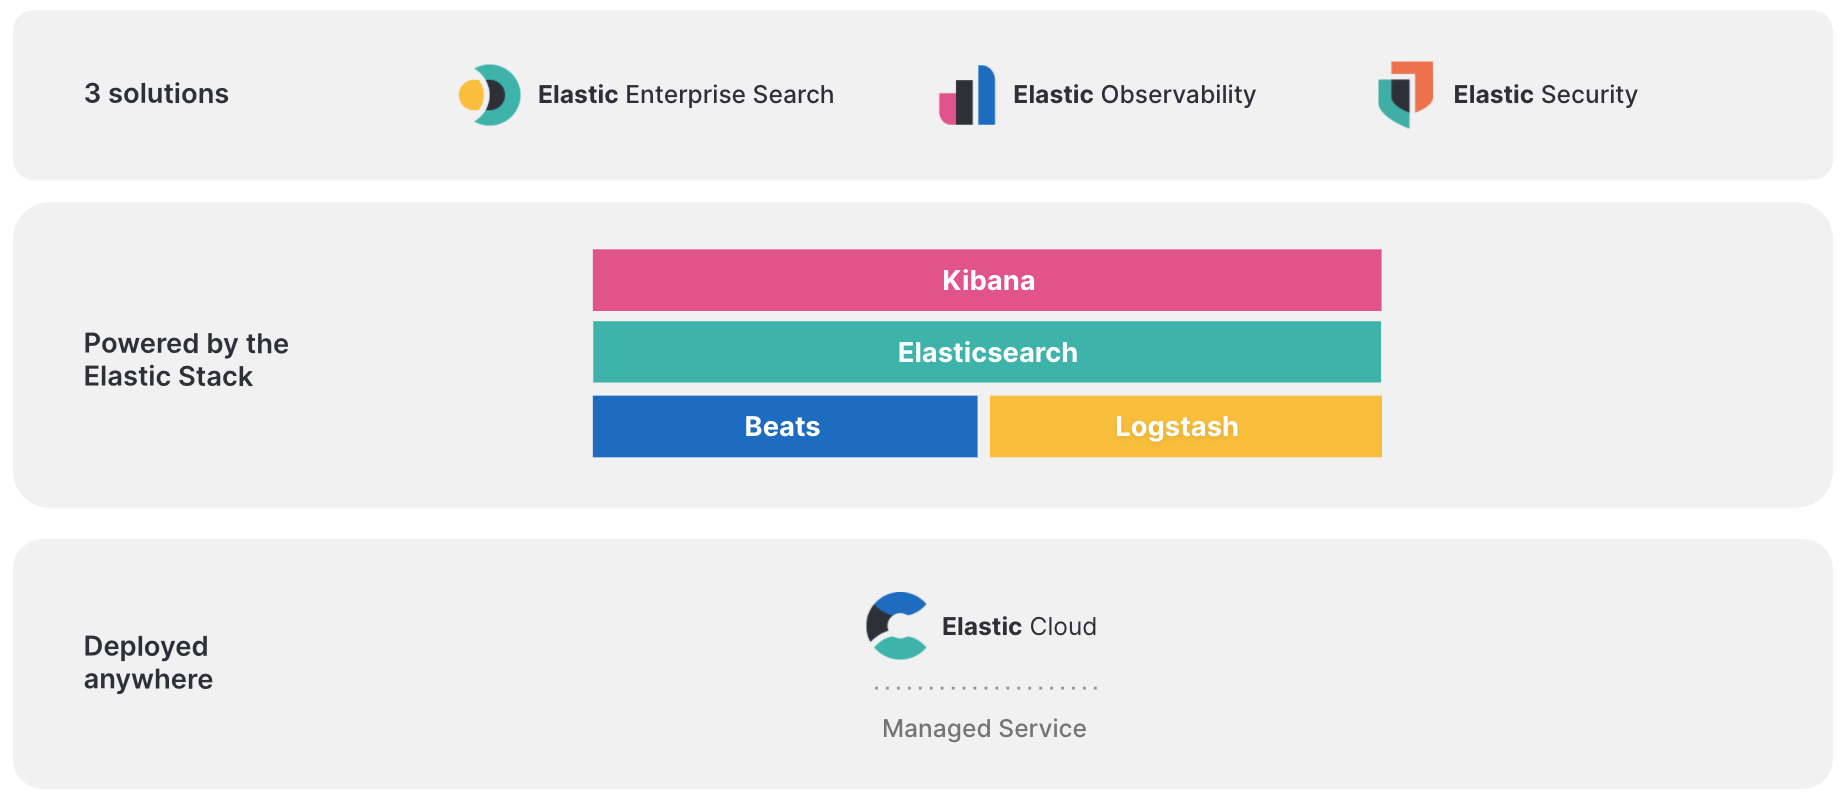
The foundation of Elastic Cloud is the Elastic Stack. The Elastic Stack consists of Elasticsearch, Kibana, Beats, and Logstash:
- Elasticsearch is a search and analytics engine. This is where data is stored in indices and made searchable.
- Kibana lets you easily build dashboards for visualizing the data residing in Elasticsearch. You define how you give shape to your data.
- Beats are lightweight data shippers installed in your other systems that send data directly to Elasticsearch.
- Logstash is a data processing pipeline tool that can be used to move data and do transformations.
Getting started
We offer a free 14-day trial of Elastic Cloud where you can create your own deployment. Alternatively, you can purchase from the cloud service provider of your choice via their marketplace and benefit from a consolidated bill. Your Elastic Cloud charges accrue towards any committed spending agreement you may have in place.
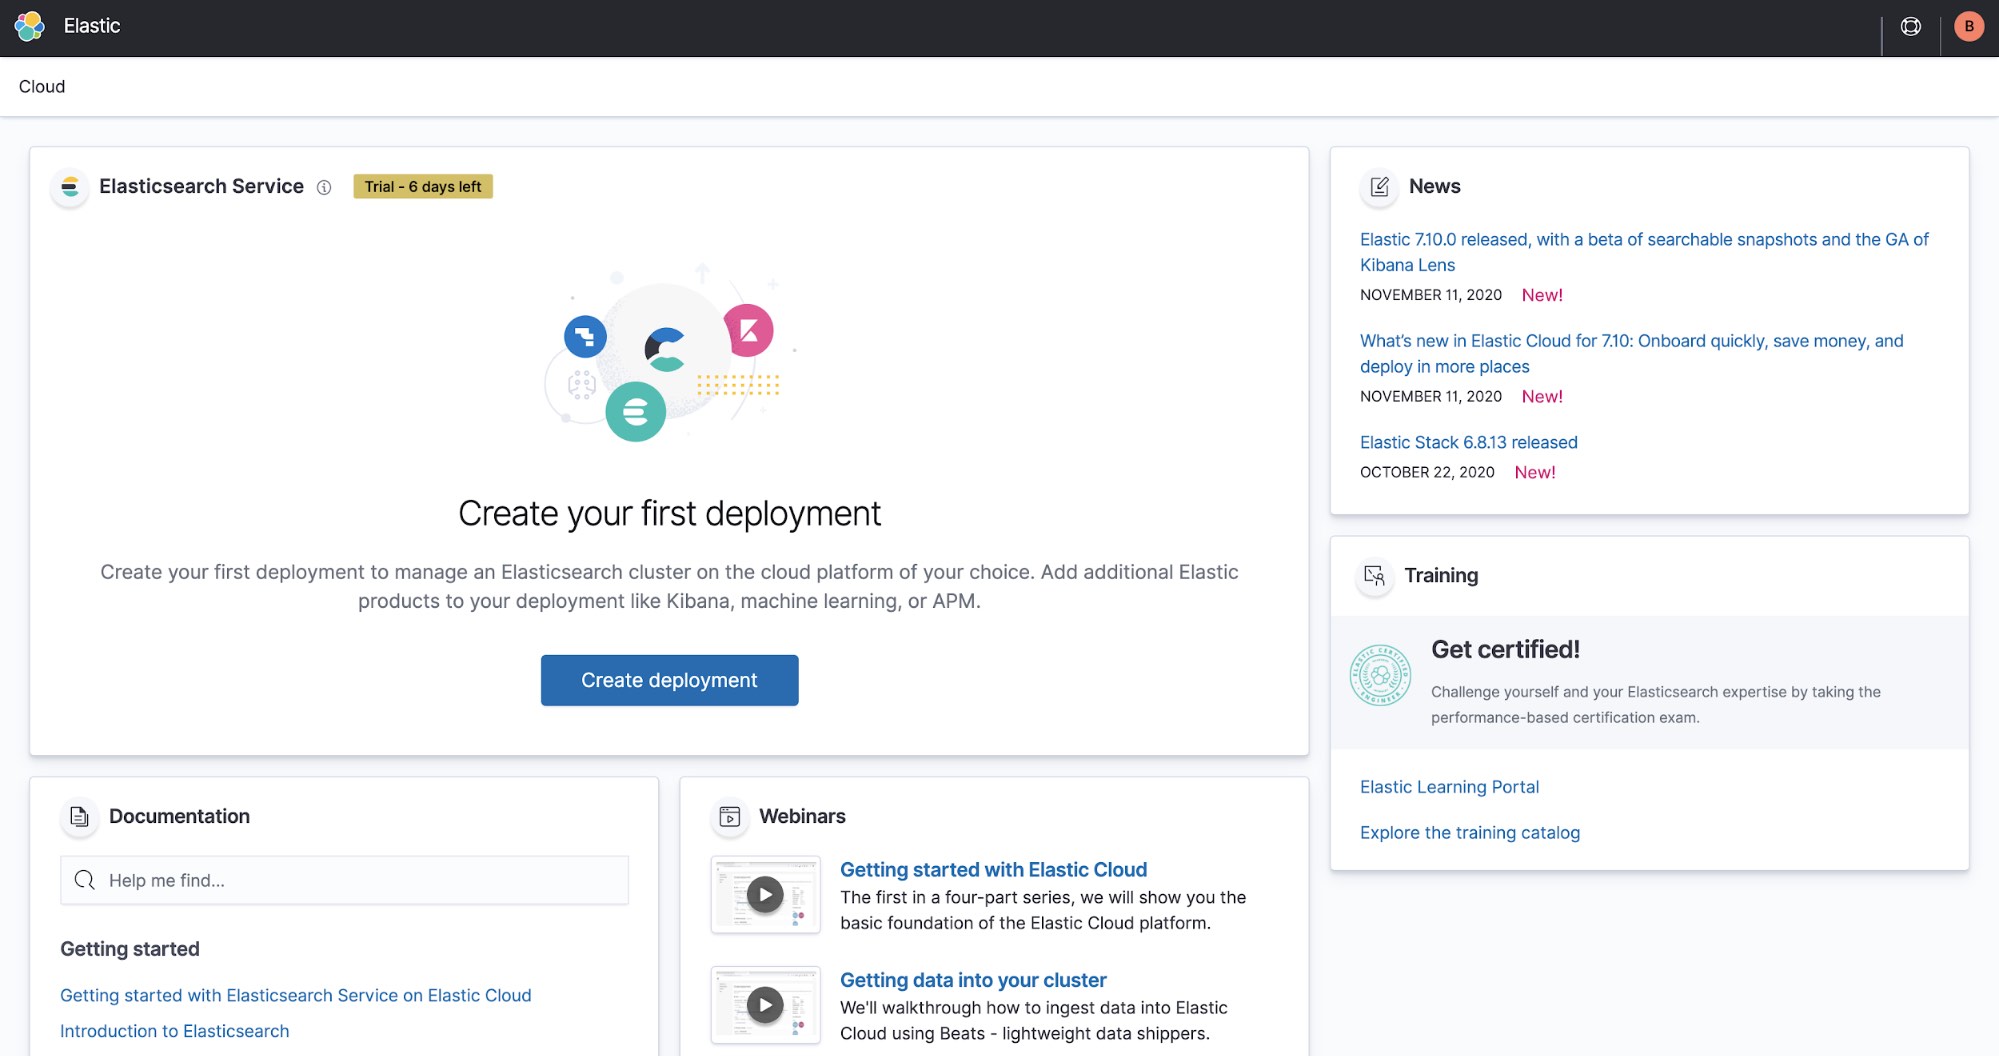
Once you sign up, you’ll see the Elastic Cloud console.
To spin up your deployment, click Create deployment.
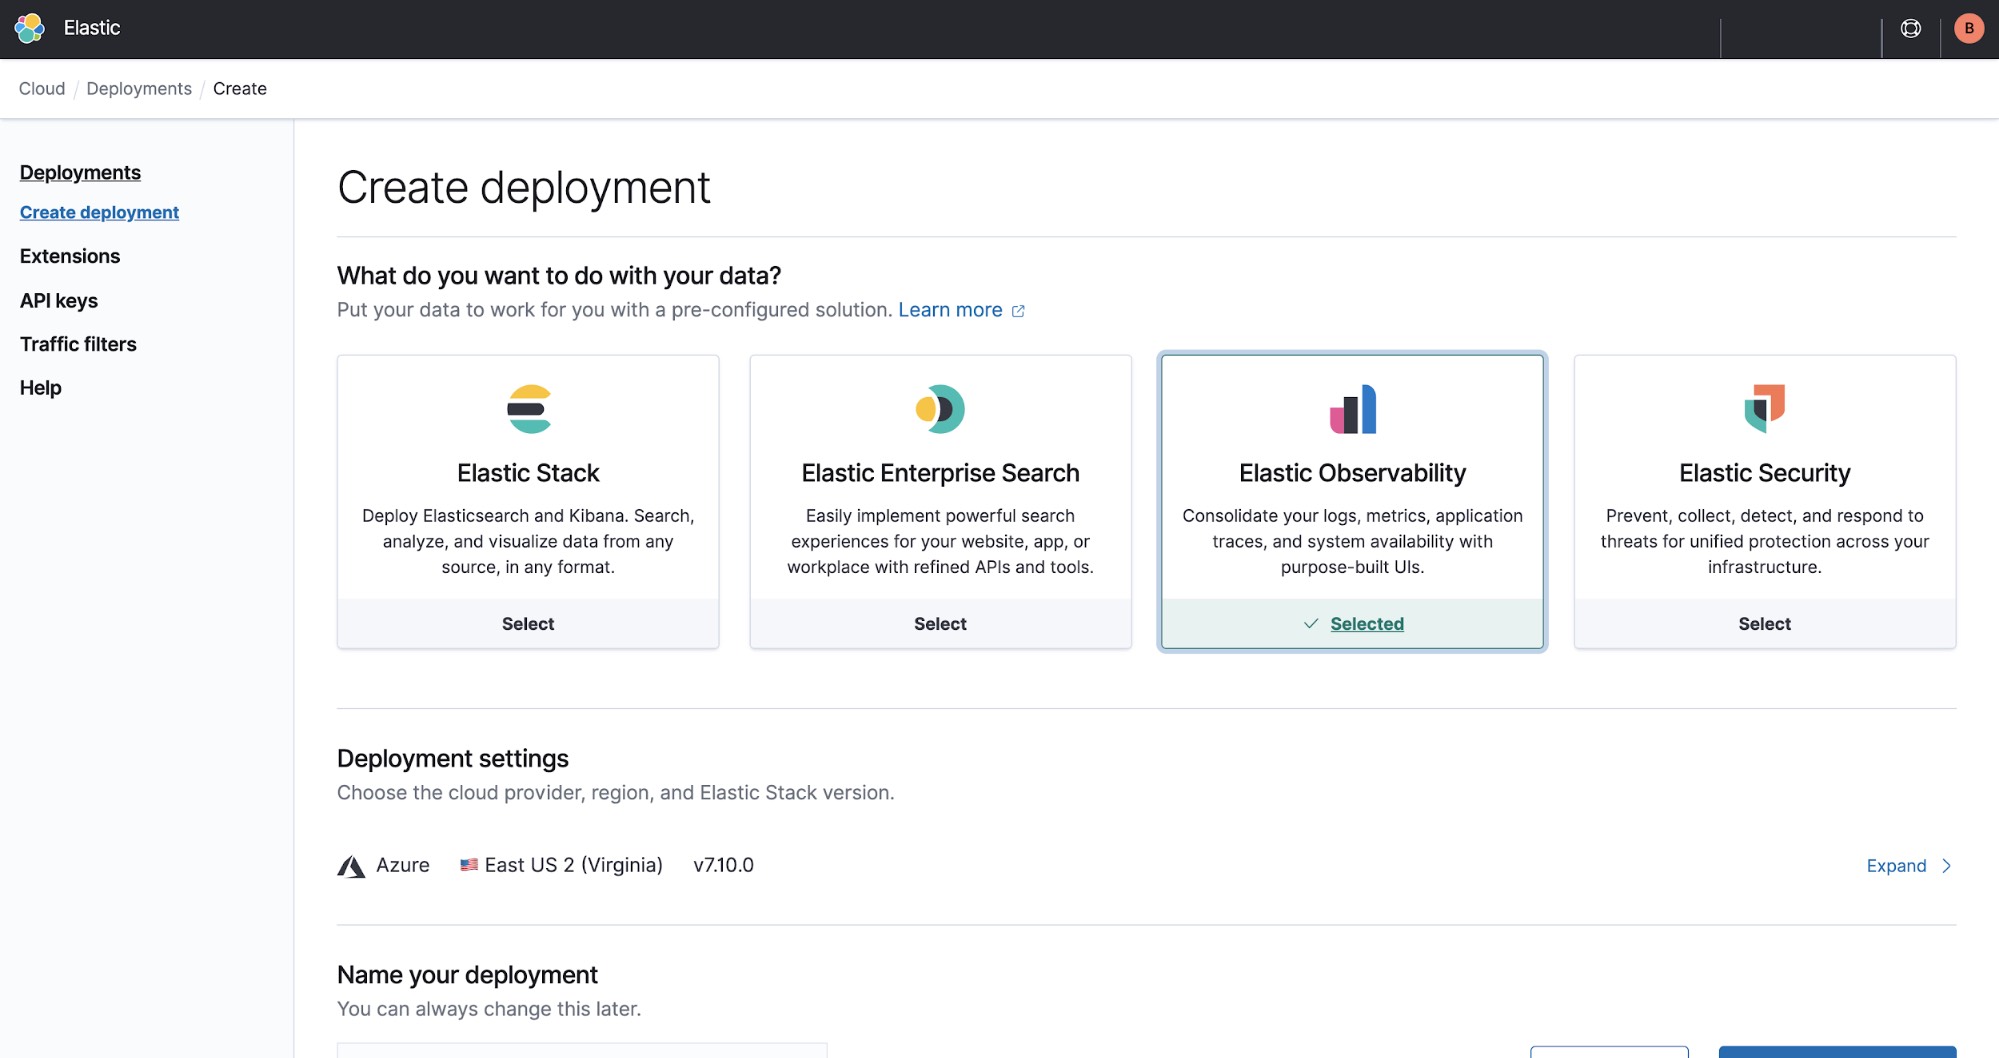
Deployment choices
When you create your deployment, you can choose one of the preconfigured solutions that best fits your needs. You can also customize your deployment before creating it or customize an existing deployment. Adjust capacity and performance, add more features, and much more.
Elastic Cloud brings the power of Elastic Enterprise Search, Observability, and Security to your cloud environment. Here’s how:
- Elastic Enterprise Search: Search everything, anywhere. Elastic App Search provides all the tools you need to design and deploy powerful search experiences for your websites and mobile apps. Elastic Workplace Search gives your teams a unified search experience across all their collaboration, productivity, and storage tools, helping them find whatever they need, wherever it may be.
- Elastic Observability: Unify logs, metrics, APM traces, and more so you can monitor global distributions through cross-cluster federation and assess how every signal interrelates. Machine learning detects anomalies and alerting notifies you of issues so you can quickly resolve issues and consistently deliver exceptional digital experiences.
- Elastic Security: Effective cybersecurity requires data at scale — Elastic Security solves for core data and scale problems. Leading security teams use the Elastic Security solution for SIEM, endpoint security, threat hunting, cloud monitoring, and more. An intuitive UI and vast ecosystem of integrations help arm every analyst to succeed.
- Elastic Stack: Choose your own adventure. If you have a use case other than observability, security, or enterprise search, you can select this option. With a variety of features like machine learning and reporting combined with hardware profile templates, Elastic gives you the flexibility you need to easily customize components.
Deployment settings
In this example, we’ll select Elastic Observability and how to use its powerful monitoring capabilities to observe the performance of a local machine (in this case, a laptop).
If you need to make a change, simply click Expand.
When you provision a new cluster, you can choose between Google Cloud, Azure, or AWS as your provider. After selecting your provider, choose the region closest to you.
If you’re a US government user, an organization that handles government-controlled data, or working in a highly regulated industry, you’ll want to take advantage of the Elastic FedRAMP authorized cloud offering. It’s available now on AWS GovCloud (US) and authorized at the FedRAMP Moderate Impact level. Sign up for a free 30-day trial to get started.
You will be defaulted to the latest version when you create a new deployment.
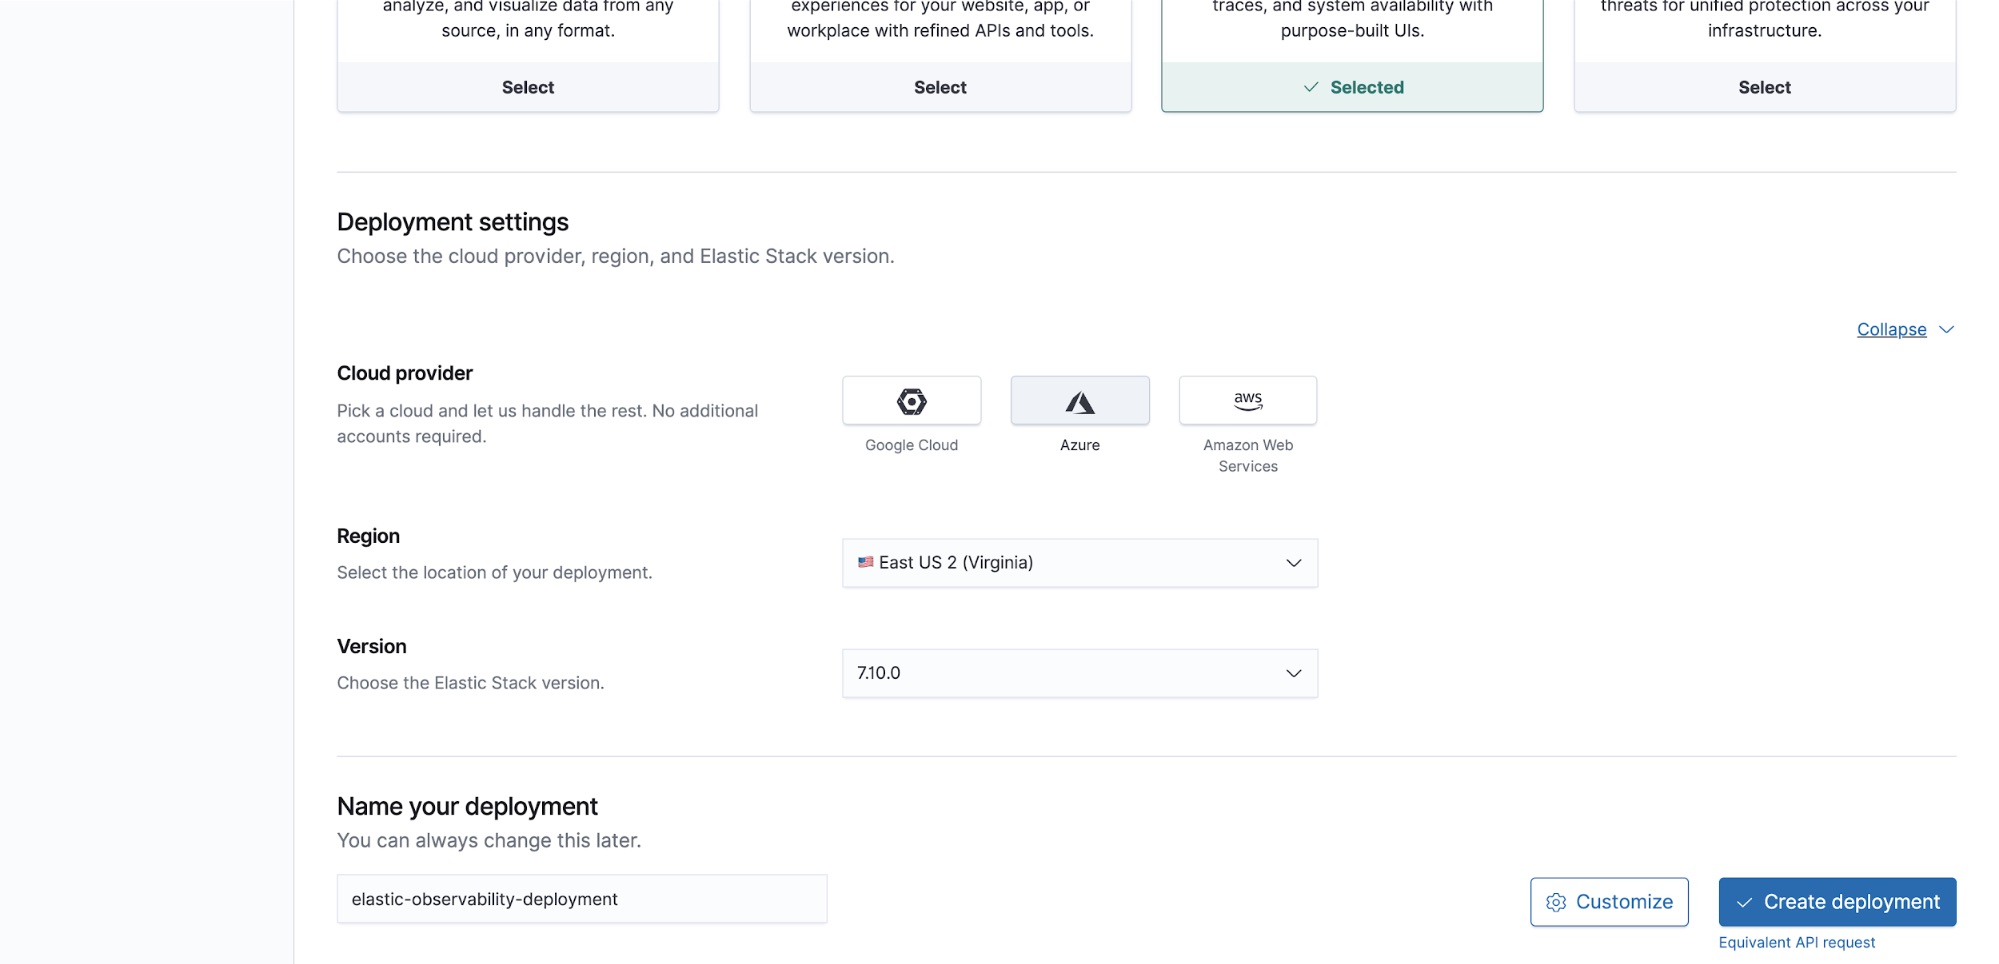
You can also assign a name to your deployment. Remember, you can customize your deployment for your use case as needed.
Launching your deployment
Password
While your deployment is being created, you’ll be given a password. Be sure to save it as you’ll need it to log in to both Kibana (the application interface) as well command-line operations.
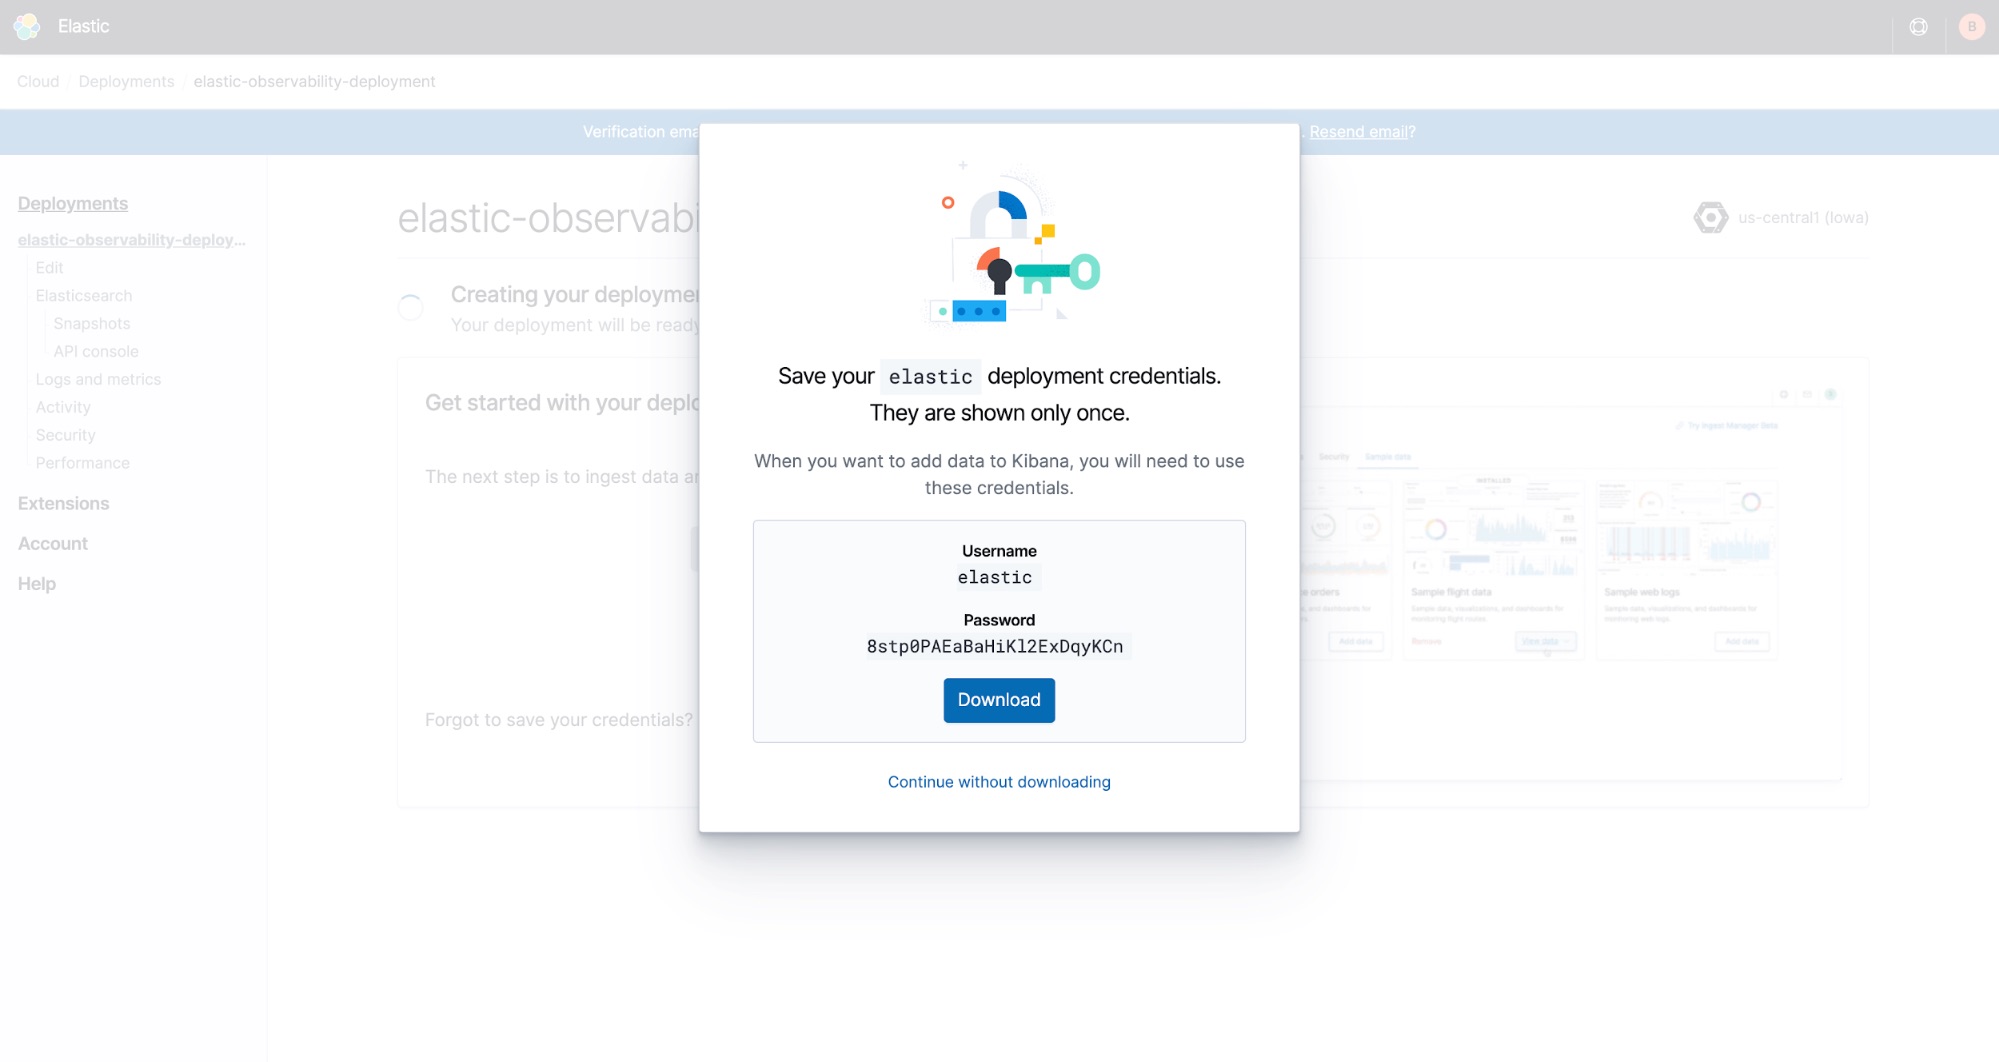
If you didn’t save it or don’t remember it, don’t worry! You can reset your password at any time.
How to log in
When you launch Kibana from the Elastic Cloud console, you will automatically be logged in as the administrator because you created the deployment. Additional users will be able to log in using the Kibana endpoint link in the console.
You use the same link to log in as an administrator by selecting Log in with Elastic Cloud.

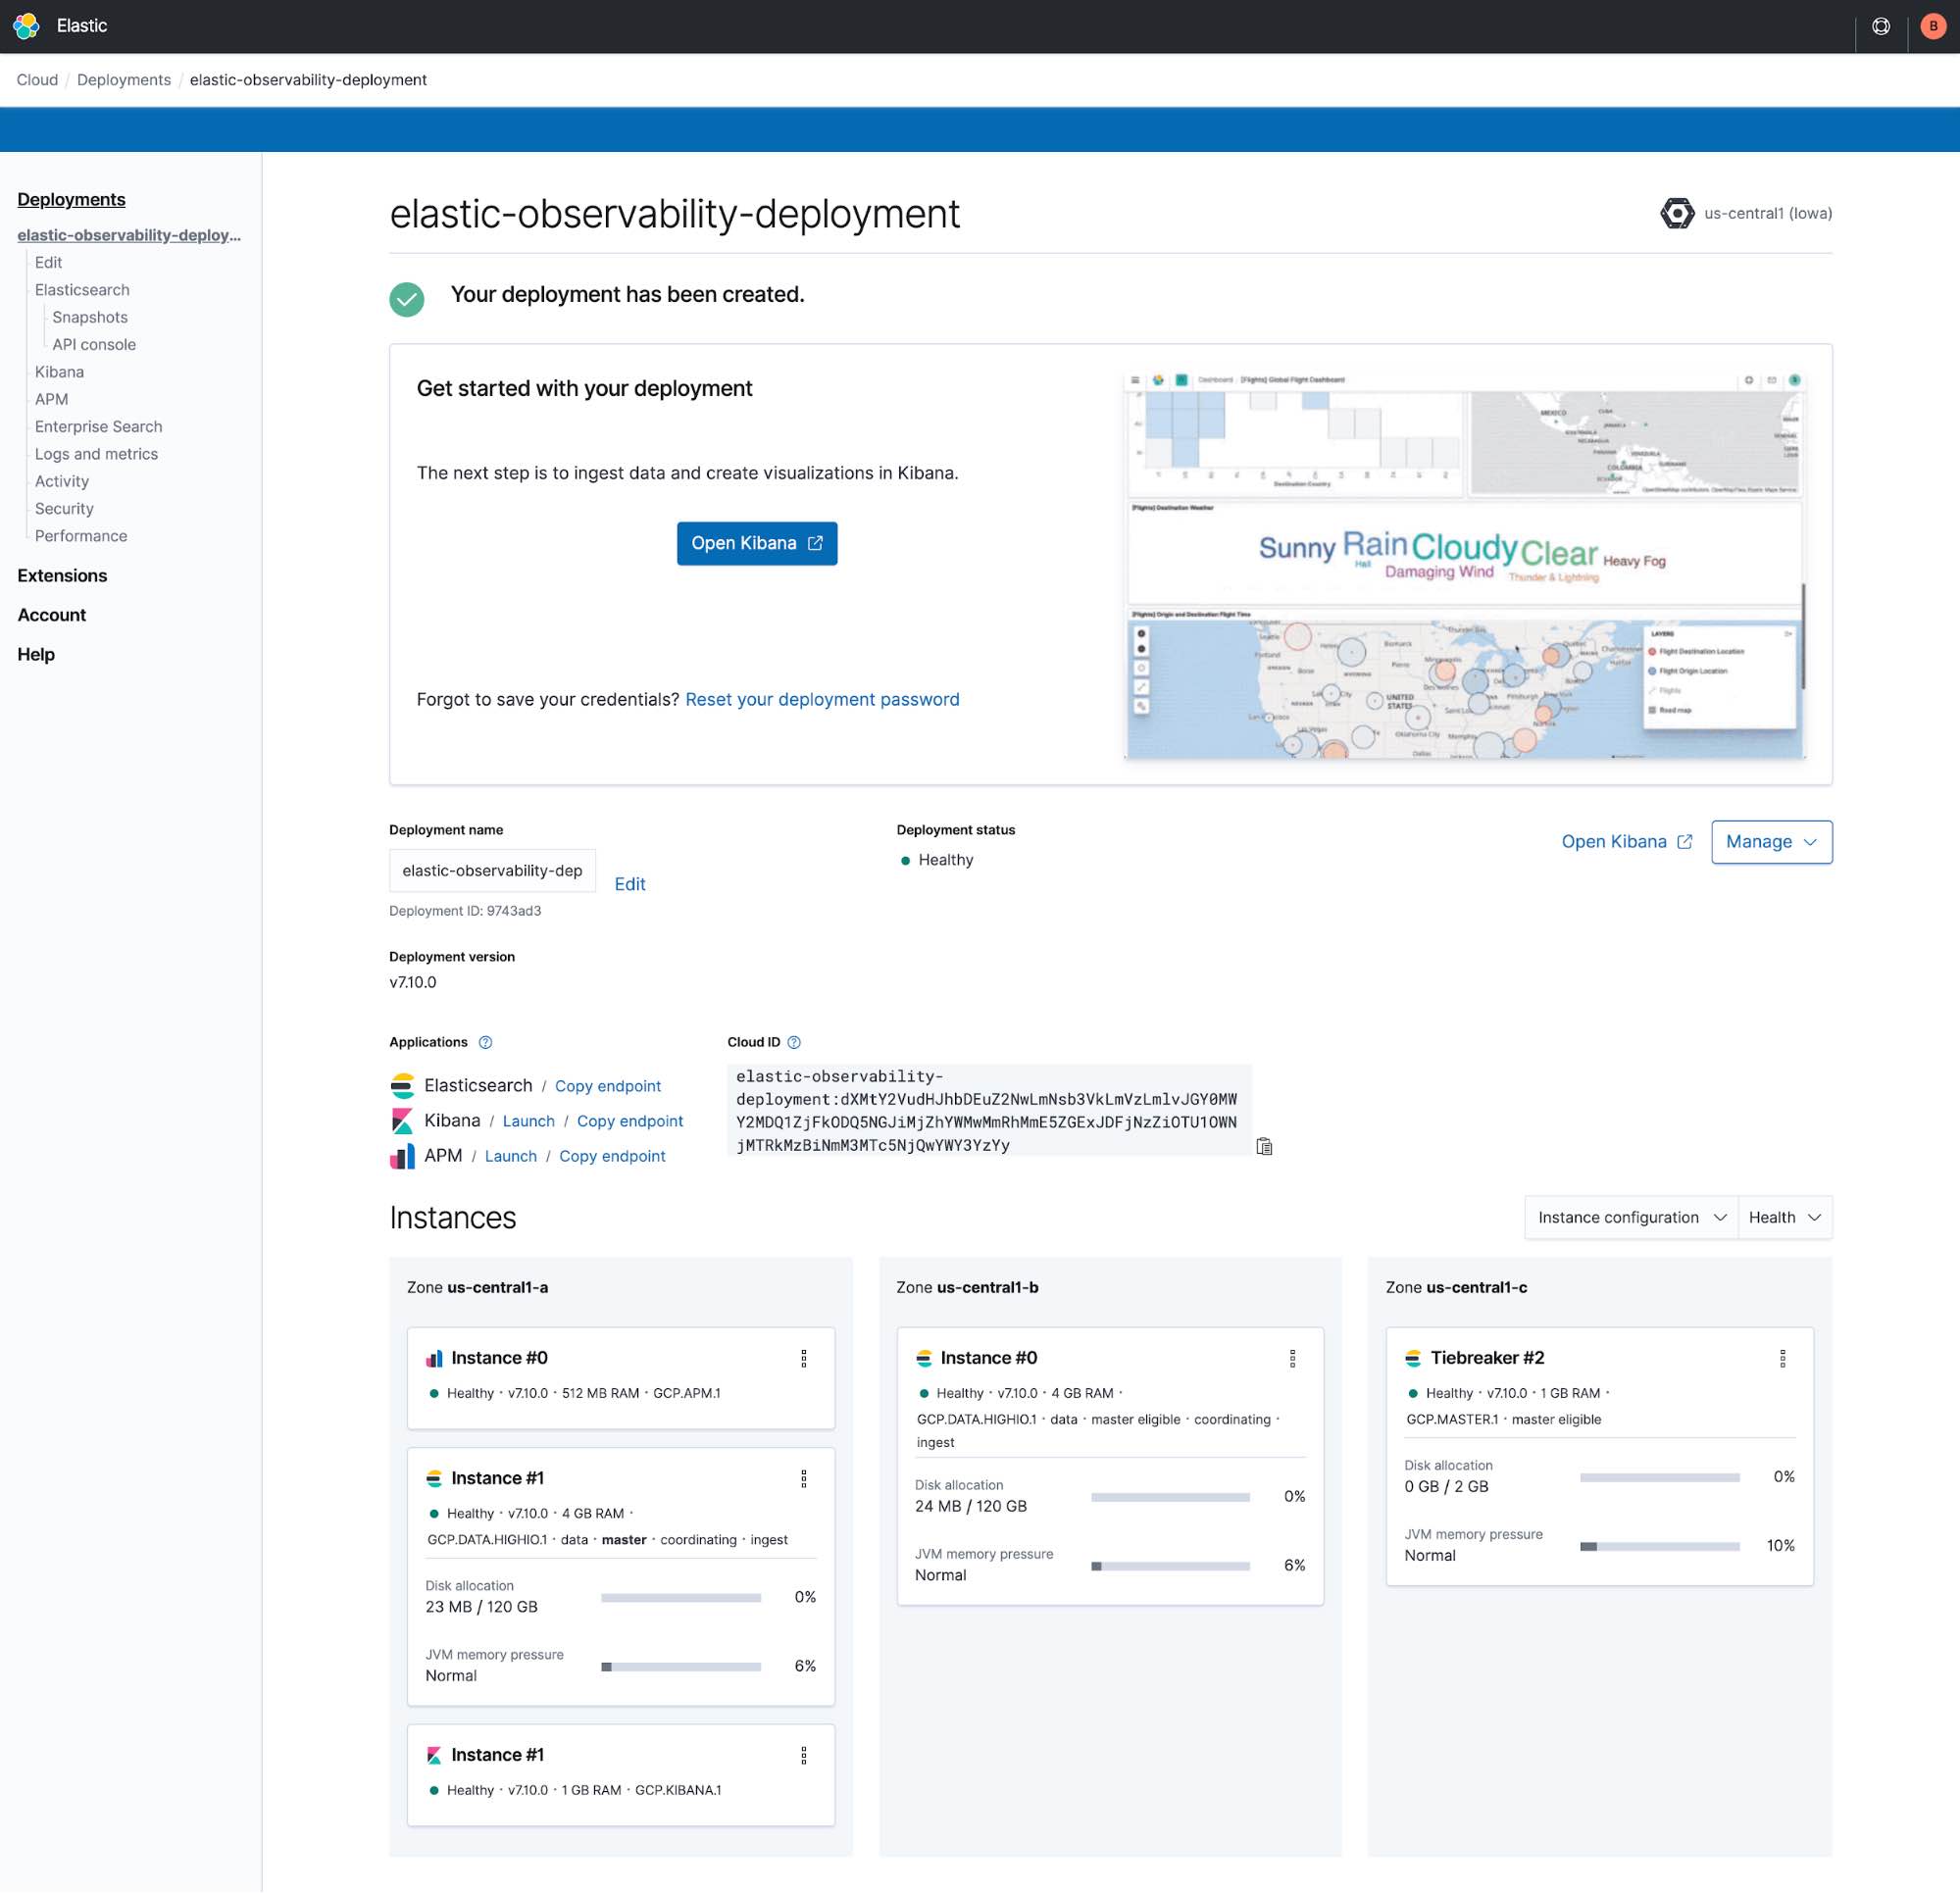
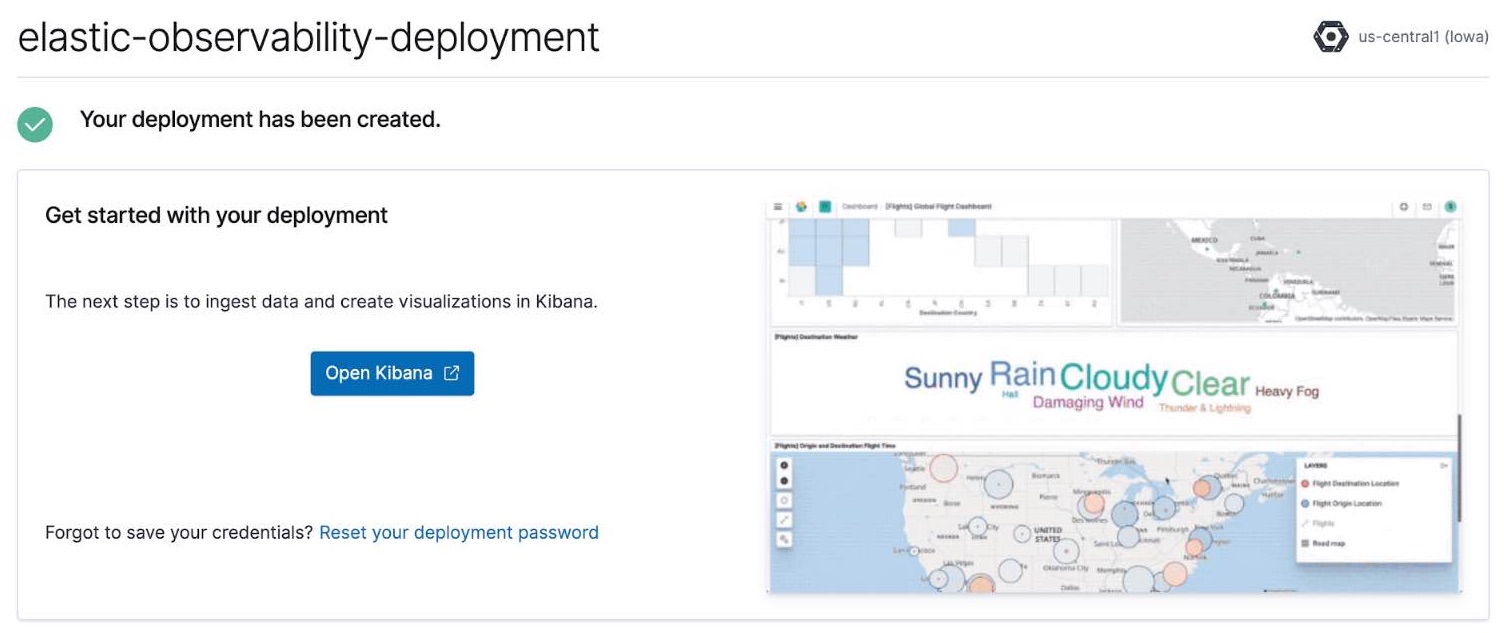
After your trial deployment has been created, click Open Kibana.
Ingesting data
After clicking Open Kibana, you’ll be brought to the Elastic Observability overview page in Kibana.
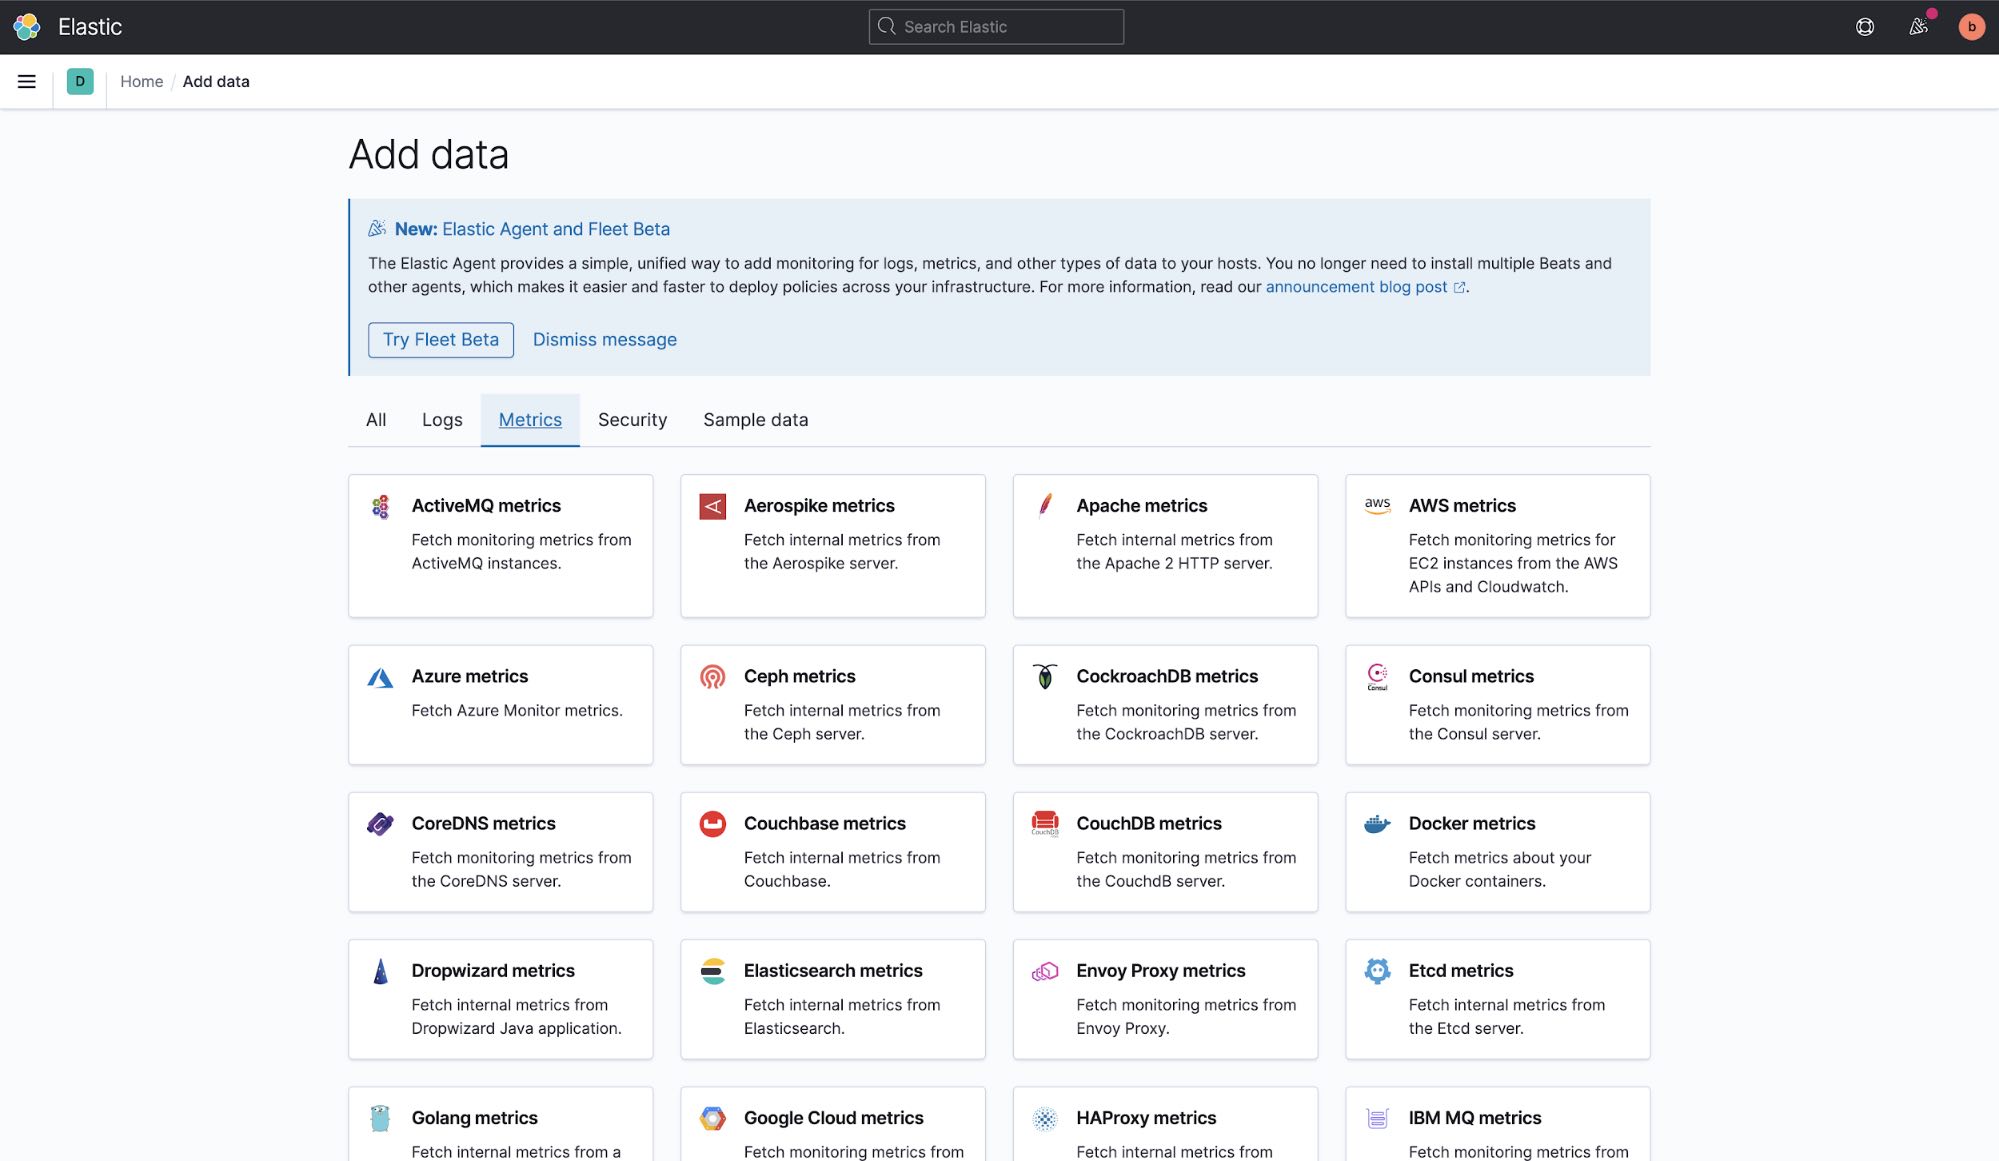
Click Add data.
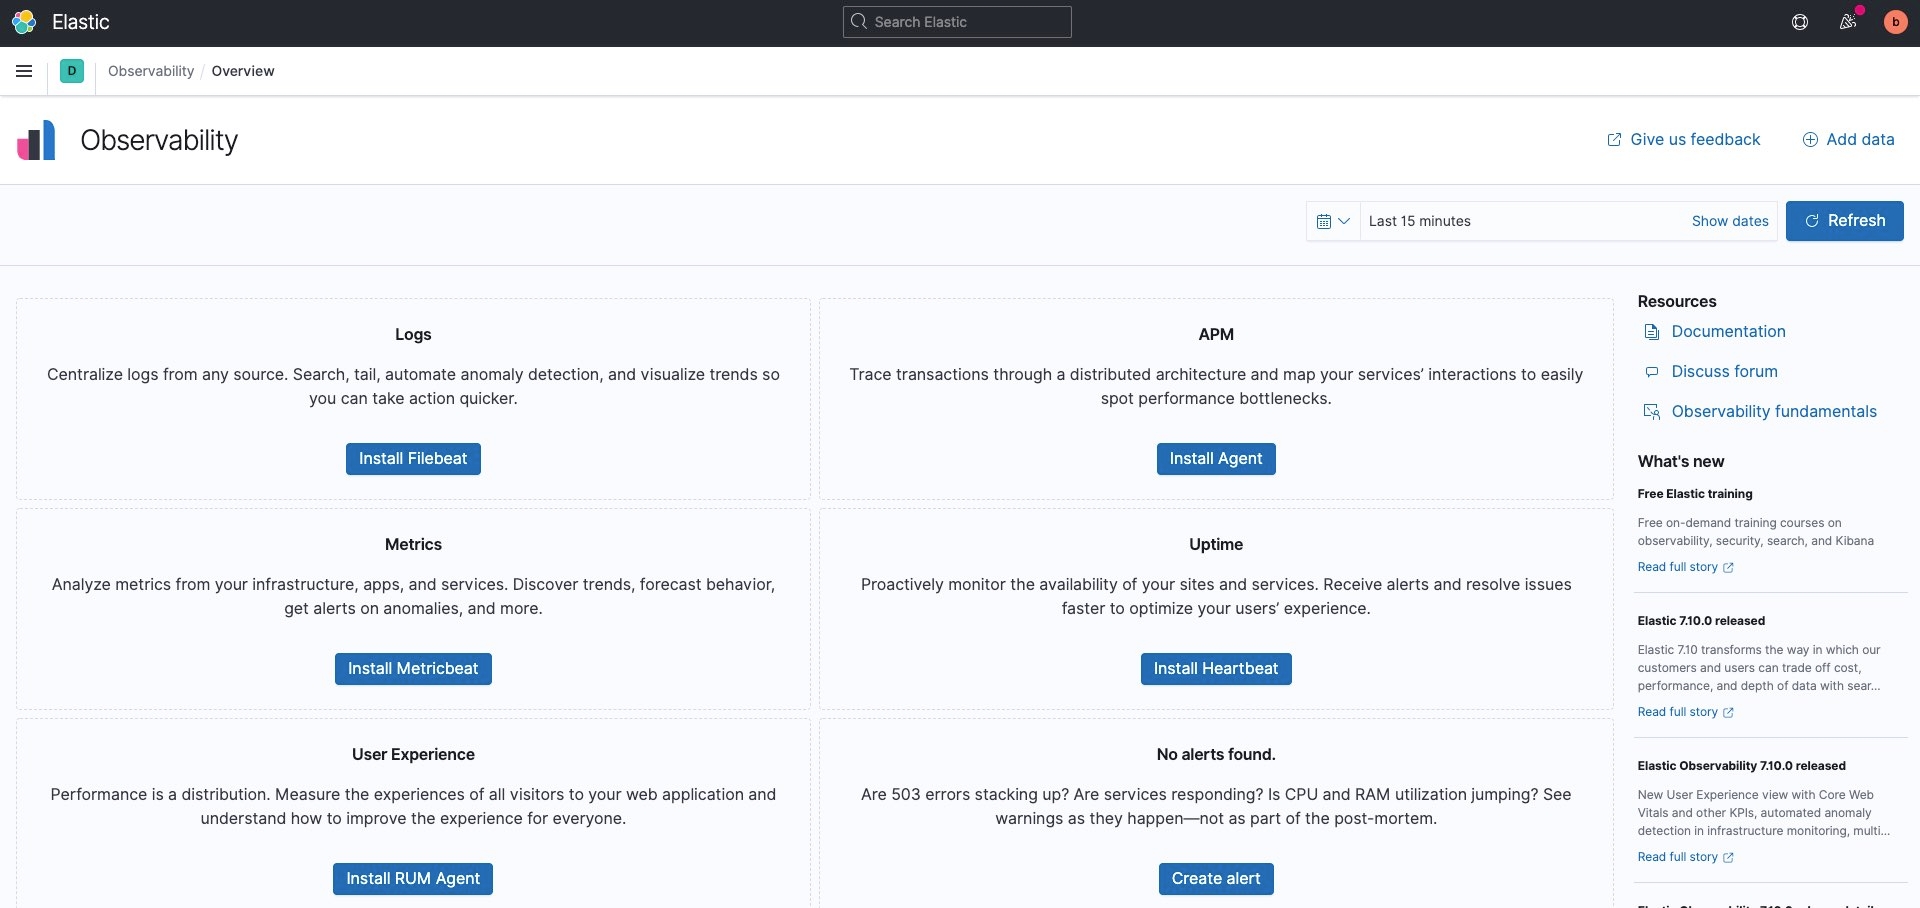
We have a wide range of data ingest options to choose from, and for this example, we want to see how our system is performing. Navigate to Metrics and locate System metrics.
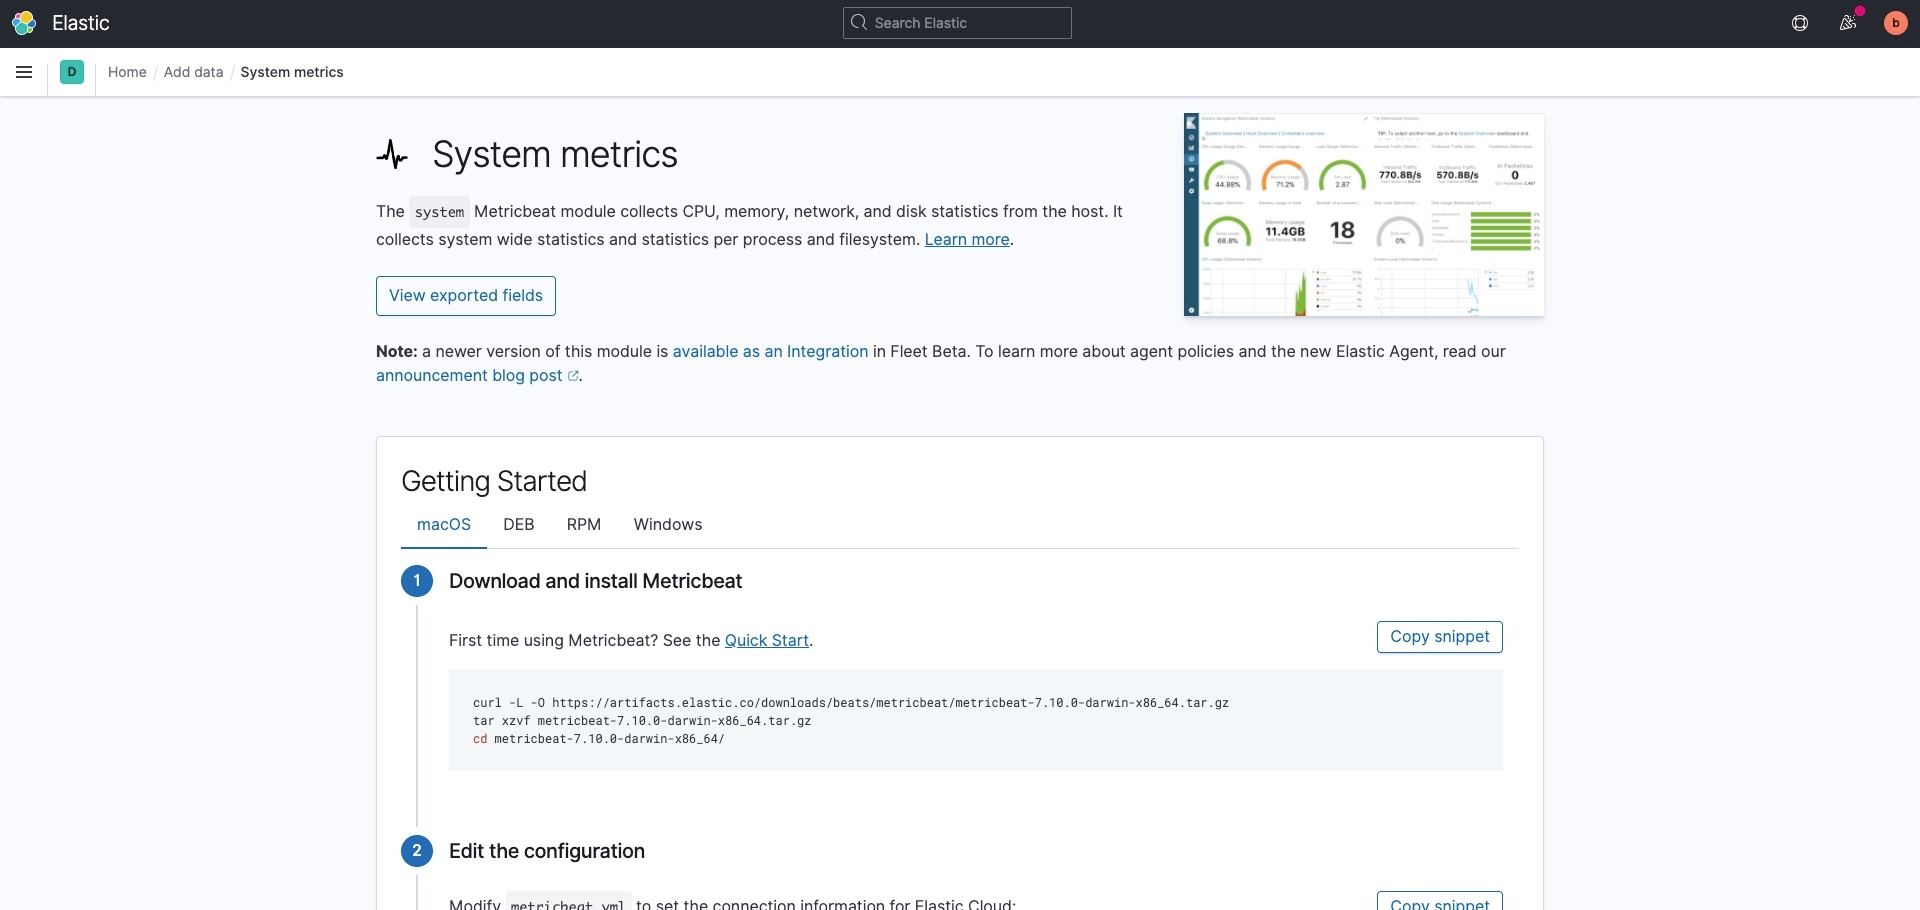
After you’ve selected the type of data you want to ingest, you’ll see a set of instructions that explain how. Here’s an example of instructions for how to install and configure Metricbeat to collect system metrics, as well as add preconfigured dashboards.
When you check your data, you’ll receive a green notification indicating the data is being received.
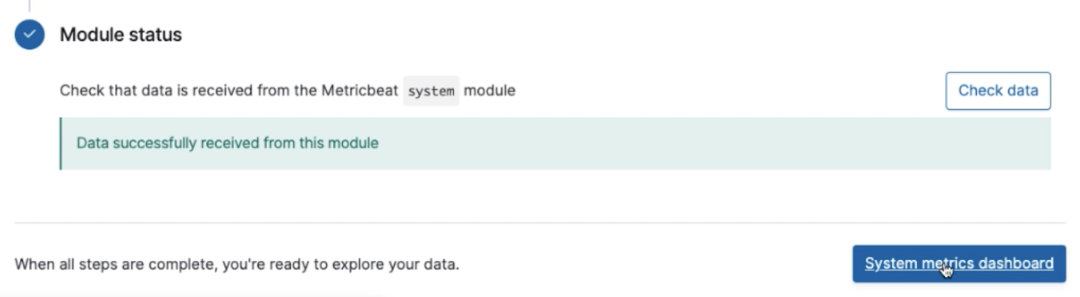
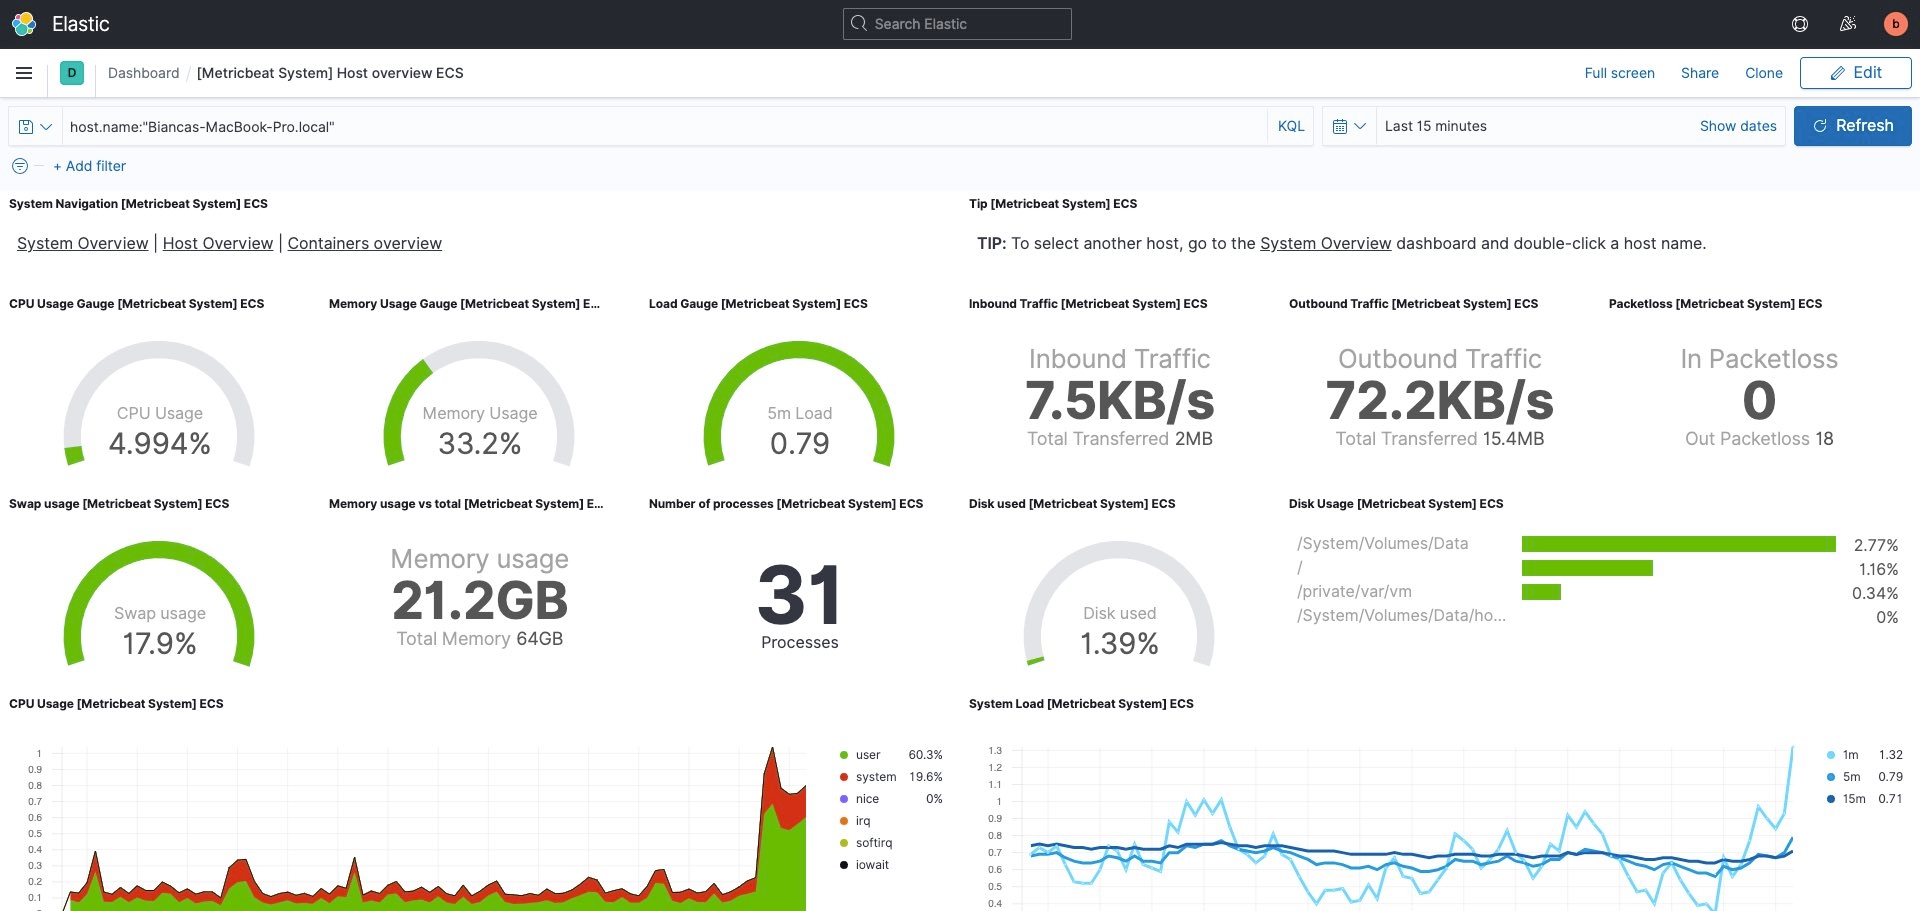
Next, click on the System metrics dashboard button.
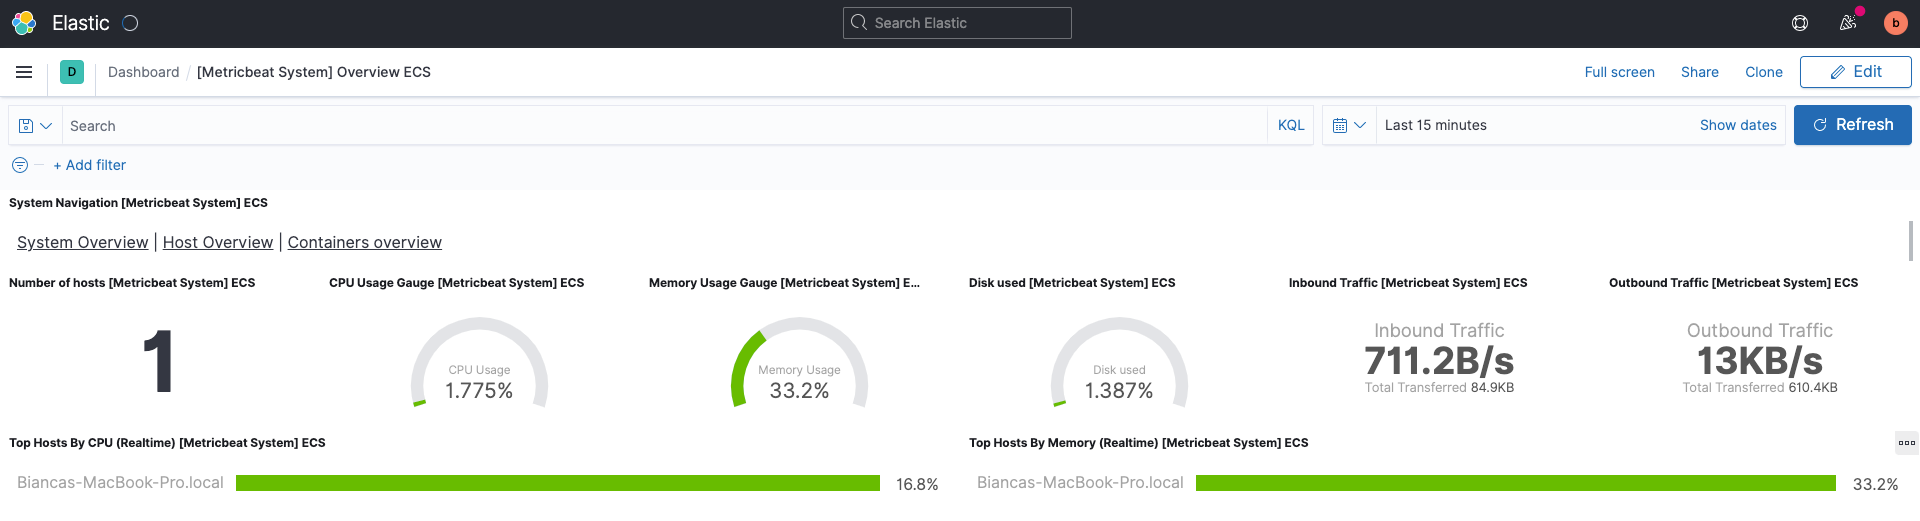
This will bring you to a prebuilt dashboard designed to take the data now flowing into your deployment from your machine and populate charts and graphs showing everything from CPU and memory usage to inbound and outbound network traffic.
Try hovering over different parts of the dashboard or even clicking into Top Hosts by CPU to get a feel for how you can interact with Kibana.
If you want to take it a step further, it’s helpful for you to understand best practices for performance benchmarking and sizing your Elasticsearch cluster. When you size your cluster, be sure you know:
- The amount of data (GB) indexed per day
- The number of data you’ll retain
- How many replica shards you’ll retain
The entire process is fast and simple. From here you can ingest additional data and build your own visualizations in Kibana so you can monitor your APM data, metrics, logs, and more at scale.
If you’re new to Kibana, check out our getting started with Kibana webinar as well as our free Kibana fundamentals course!
Get started today
Spin up a free 14-day trial, or check out our blogs for more information on how to deploy on the cloud service provider of your choice:
- Getting Started with Elastic on Google Cloud
- Getting Started with Elastic on Microsoft Azure
- Getting Started with Elastic on AWS
- Getting started with Elastic Cloud, FedRAMP, and AWS GovCloud
Explore more resources to help you get the most out of Elastic Cloud.
Connect with other users in the Elastic Community or reach out on our Discuss forums.