Blogs
Hands-on, insight-driven content about observing your production and development environments using Elastic Observability.

One ES|QL query, 365 days of audit logs: Same search on hot data and searchable snapshots
Collect audit logs with the EDOT Collector, then confirm the 365-day retention policy actually applied before an auditor asks you to.

Kubernetes node pressure: Catching the memory drop 7 minutes before the first pod eviction
The pod you lose is rarely the pod that grew. This walkthrough follows a per-node anomaly detection alert all the way to the pod whose working set moved.

Kubernetes noisy neighbor in a multi-tenant cluster: Find it with ES|QL
Every pod was Running, and storefront requests under 500 ms still fell from 99.6% to 59%. ES|QL on kubelet metrics found a batch job taking 1.7 of the node's 2 cores, and a 500m cap brought the storefront back above 99%.
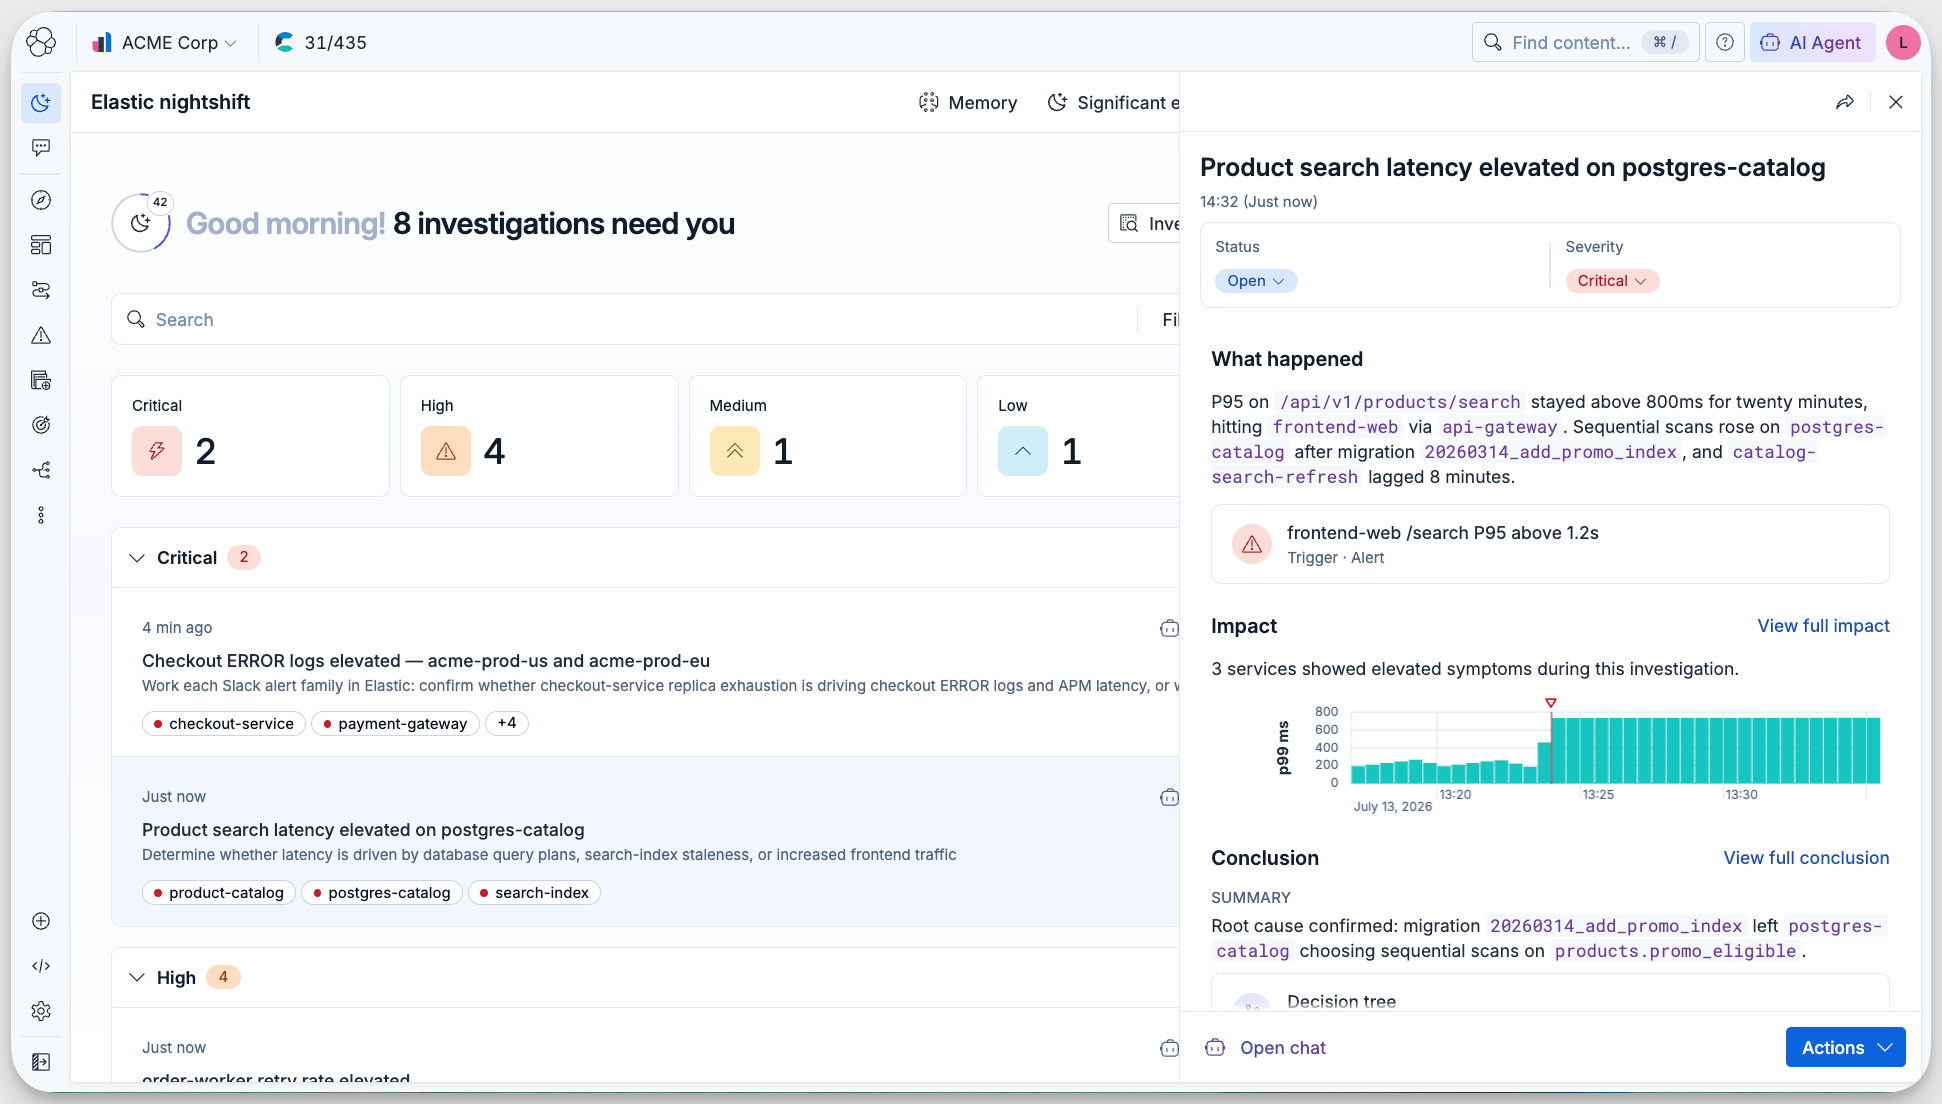
Meet Elastic nightshift AI SRE, your always-on SRE coworker
Elastic's SRE team has been running Elastic nightshift against our own production environment. It picks up incidents that never triggered an alert and shows its working for every conclusion it reaches.

Automated root cause analysis for AWS: From a CloudWatch alert to a diagnosed incident in 36 seconds
We broke a live RDS instance with a connection leak, and the workflow came back with the Postgres refusals, the downstream 5xx and a root cause nobody had to write by hand.
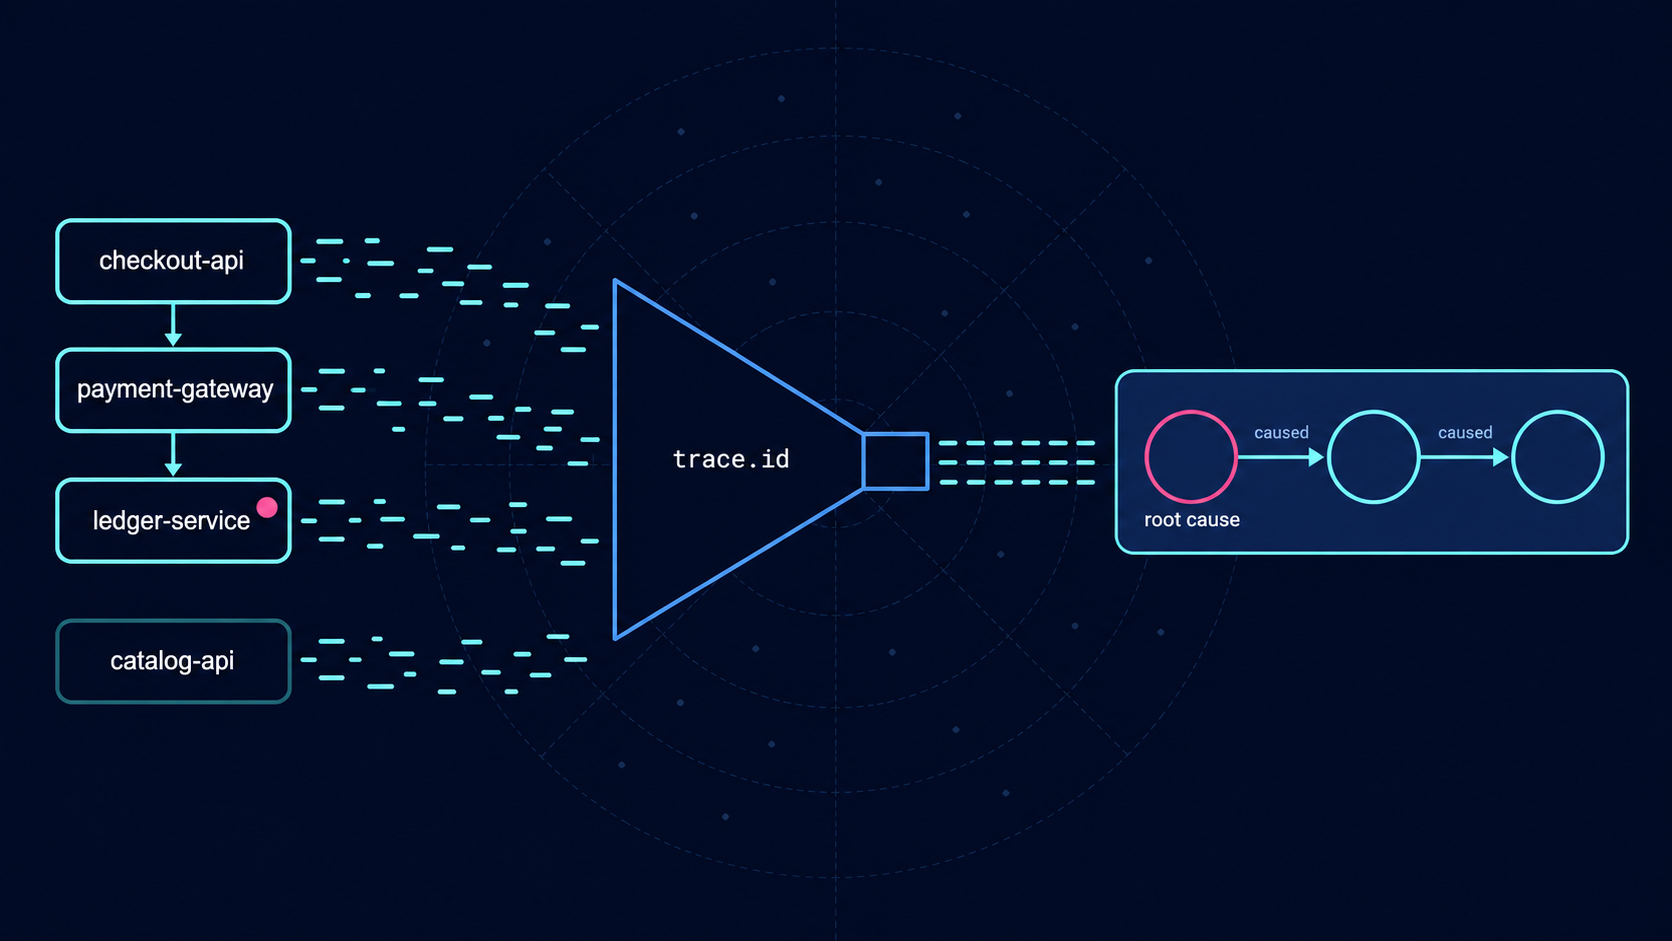
The service with the most errors was healthy: root cause analysis from logs with ES|QL
Metrics ranked three services identically at 19.1%. Four ES|QL queries over the same 4,688 OpenTelemetry log records traced 955 of 956 failure chains back to one of them, and needed no service dependency model to do it.
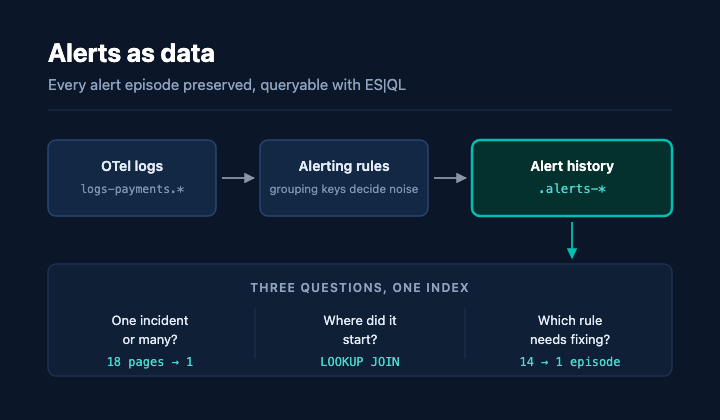
14 alerts, 1 incident: Measuring alerting rule noise with ES|QL in Elasticsearch
Grouping keys decide how many alerts one incident produces, and because Kibana stamps every alert document with a rule revision, you can measure your alert noise reduction against the same incident that caused the alerts in the first place.
.jpg)
Kubernetes attributes processor v1: What it means for EDOT Collector
Default EDOT Collector setups are fine. Anything custom that queries labels, annotations or container.image.tag quietly stops returning data after EDOT 9.6.

Two dependencies and one config block: Spring Boot metrics to Elasticsearch over Prometheus remote write
Prometheus remote write forwards Micrometer's Actuator metrics into an Elasticsearch time series data stream. JVM heap, request latency, GC pauses and HikariCP activity all become queryable with ES|QL, and nothing new has to run alongside it.
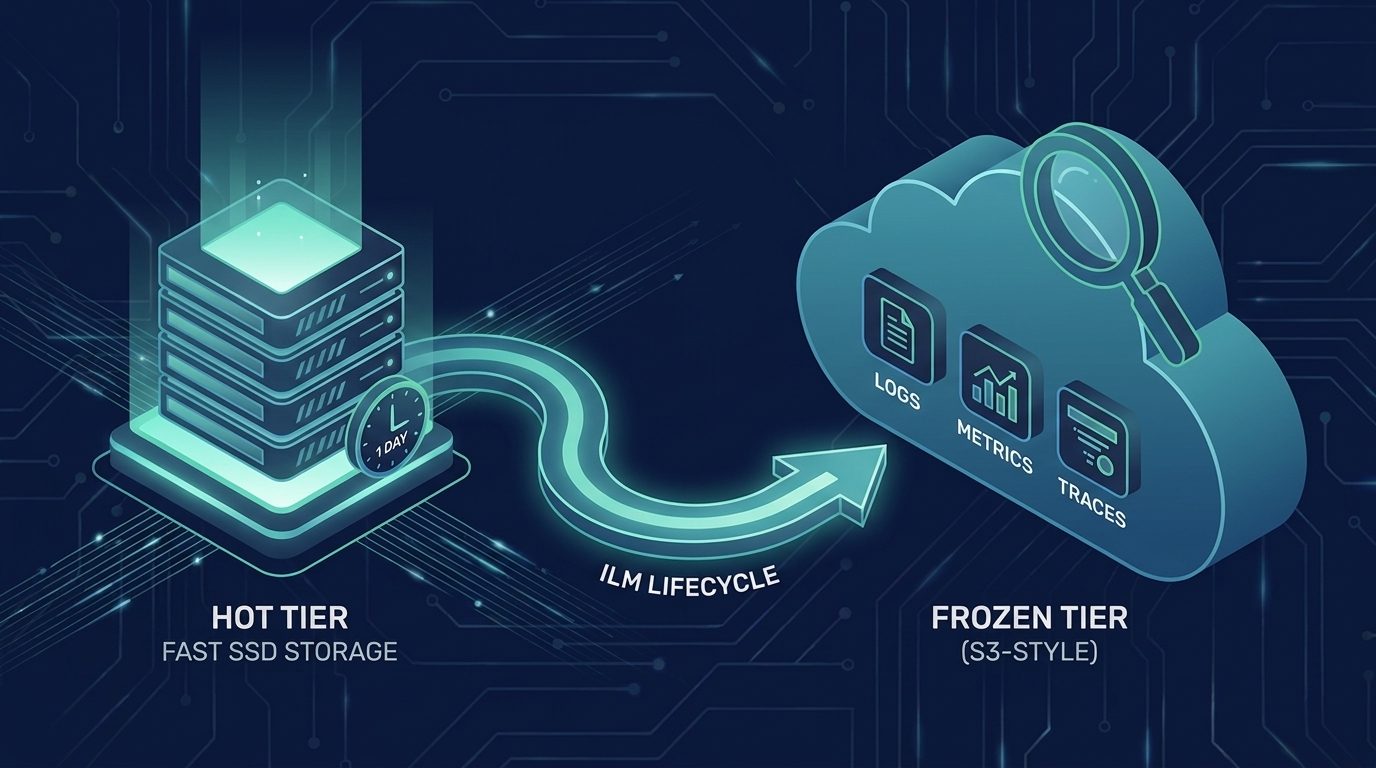
Cut log storage costs with two Elasticsearch data tiers instead of four
Elastic benchmarked one day of logs on SSD with everything older moved to frozen searchable snapshots, and it came out 16x cheaper than keeping all of it hot. The ILM policy and the cost model are both in the post.
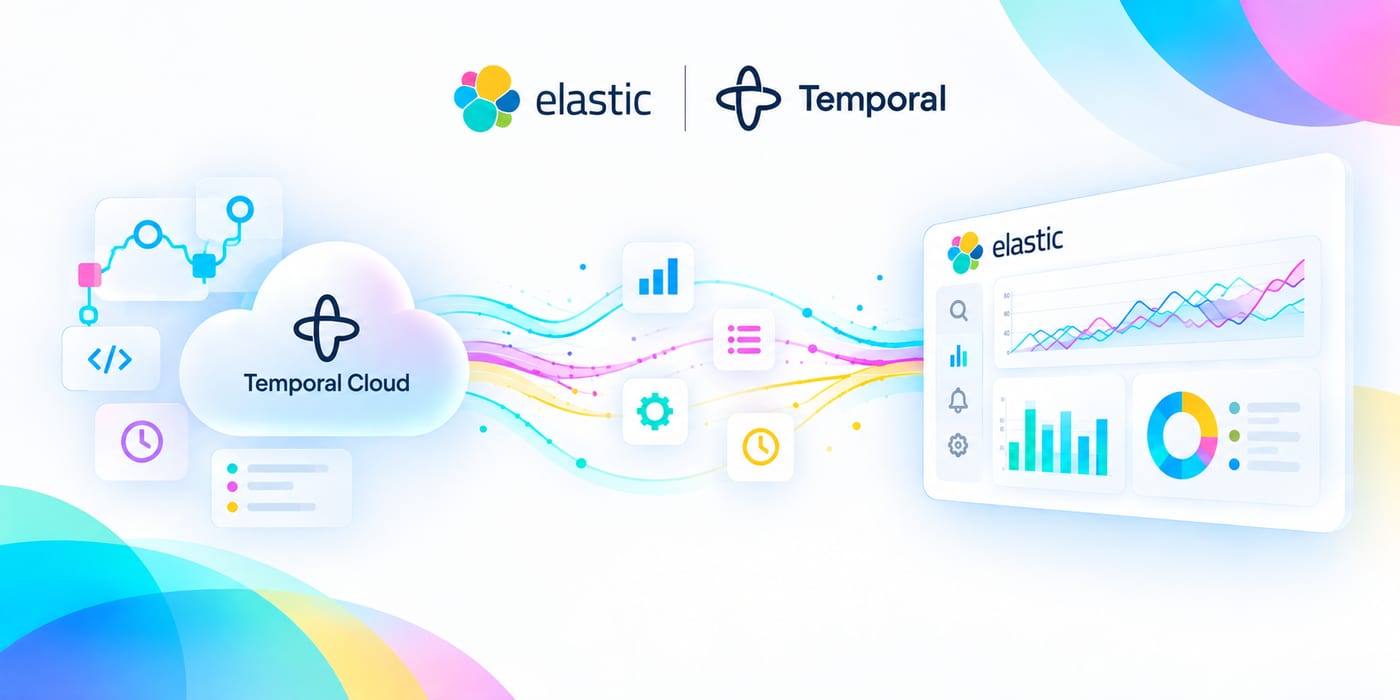
Temporal Cloud observability in Elastic: 50+ metrics, zero collectors
Elastic scrapes metrics.temporal.io, so the workflow that has been stuck in Running for an hour turns out to be a task queue nobody is polling, and you find that out before you open a single worker log.
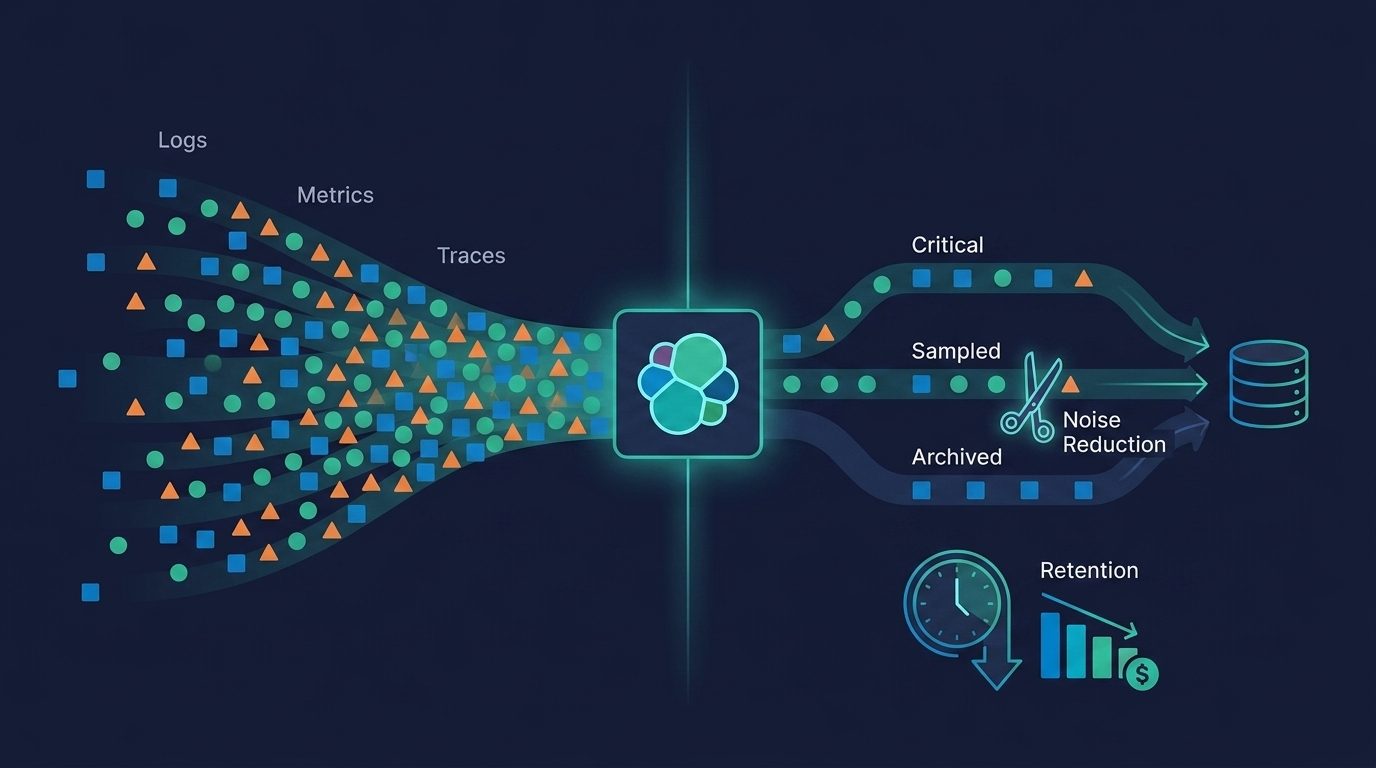
Not every log deserves 90 days: per-stream retention in Elastic Streams
AI Partitioning reads your data and proposes child streams. Retention, drops and downsampling then become per-stream settings, so the noisy ones expire on their own schedule.