Why do customers choose Elastic for logs?
Elastic is transforming the log experience to meet the needs of modern workflows


 Share on Twitter
Share on Twitter

 Share on LinkedIn
Share on LinkedIn

 Share on Facebook
Share on Facebook

 Share by Email
Share by Email

 Print this page
Print
In the absence of other observability signals, generally everything in your infrastructure (hardware, software, and services) emits log lines. Logs, however, are often structured at a developer’s whim and, first and foremost, serve the developer’s needs (e.g., debugging). Once in production, these same log lines are inherently promoted to a first-class means of observing your applications and infrastructure, regardless of their original intent. This makes logs a notoriously noisy observability signal whose rate can swing wildly with errors and scale.
The simplicity of the log line as an observability signal (fundamentally, it’s just text!) makes it deceivingly simple to observe. On the other hand, its noisy, unstructured nature and unpredictable rate make it among the most difficult of signals to make useful.
There are many vendors today providing observability solutions that include logging. Notably, most of these solutions serve only the most basic of use cases: text search. Elastic® understands that your log lines contain a lot more value than just the text contained in any one message. Harnessing machine learning (ML) and artificial intelligence (AI) and generative AI, Elastic can analyze your logs in aggregate, transforming log lines from reactive debugging tools into clean, proactive monitoring and alerting tools.
In this blog, we will convey the challenges facing developers and site reliability engineers (SREs) today and explain how Elastic can elevate the venerable log line to meet those challenges.
When minutes matter
When your SREs and developers are trying to root cause analyze (RCA) an issue, it’s all about mean time to resolution (MTTR): search speed coupled with an intuitive query language can make the difference between a significant outage and a minor service disruption.
When you are evaluating logging vendors, read the fine print: while many tools may theoretically meet your requirements for search, their strict “schema-on-read” approach (wherein the data is not indexed) can make queries frustratingly slow for end users, particularly in a time of need (e.g., trying to root cause a production-affecting issue).
In contrast, Elastic natively supports schema-on-write, wherein the data is indexed upon ingest in a manner optimized for search. This approach makes text searches blazingly fast by comparison to schema-on-read, significantly increasing the efficiency of developers and SREs who need to work with log signals on a daily basis. Further, by lowering friction, developers and SREs are more likely to adopt observability tools as a daily driver in their workflow, leading to better software and system quality.
Elastic also readily acknowledges the value of schema-on-read for use cases when you need to search your data in new ways. Runtime fields let operators extract new insights from existing data without reindexing. When performing RCA of a newfound issue, Elastic’s new ES|QL language enables analysts to rapidly build tactical queries by stringing together searches, data extraction, and enrichment in an intuitive, easy-to-read format.
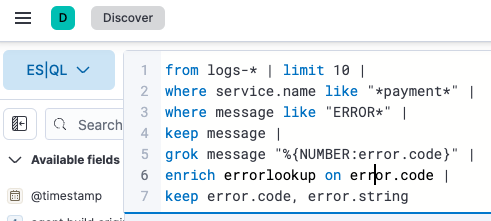
Together, these tools let your analysts query log lines in a manner most optimized for the task at hand, rather than limiting your analysts in artificial ways which could obfuscate or delay root cause analysis of issues.
Logging in the age of cloud scale
As customers shift workloads to the cloud and Kubernetes, another practical constraint is introduced: the non-linear scale enabled by these technologies makes trivial log observation and alerting (e.g., searching for “*error*” in your log lines) arguably impractical.
Elastic recognizes this inflection point in the industry and has responded with a set of unique and best-in-class AI-powered tools to let SREs and developers offload the complexities introduced by scale. Our out-of-the-box machine learning jobs can alert when a spike or dip in log rate is truly an anomaly versus simply an expected fluctuation. This added intelligence reduces alert fatigue and, as a result, brings greater attention to real problems.
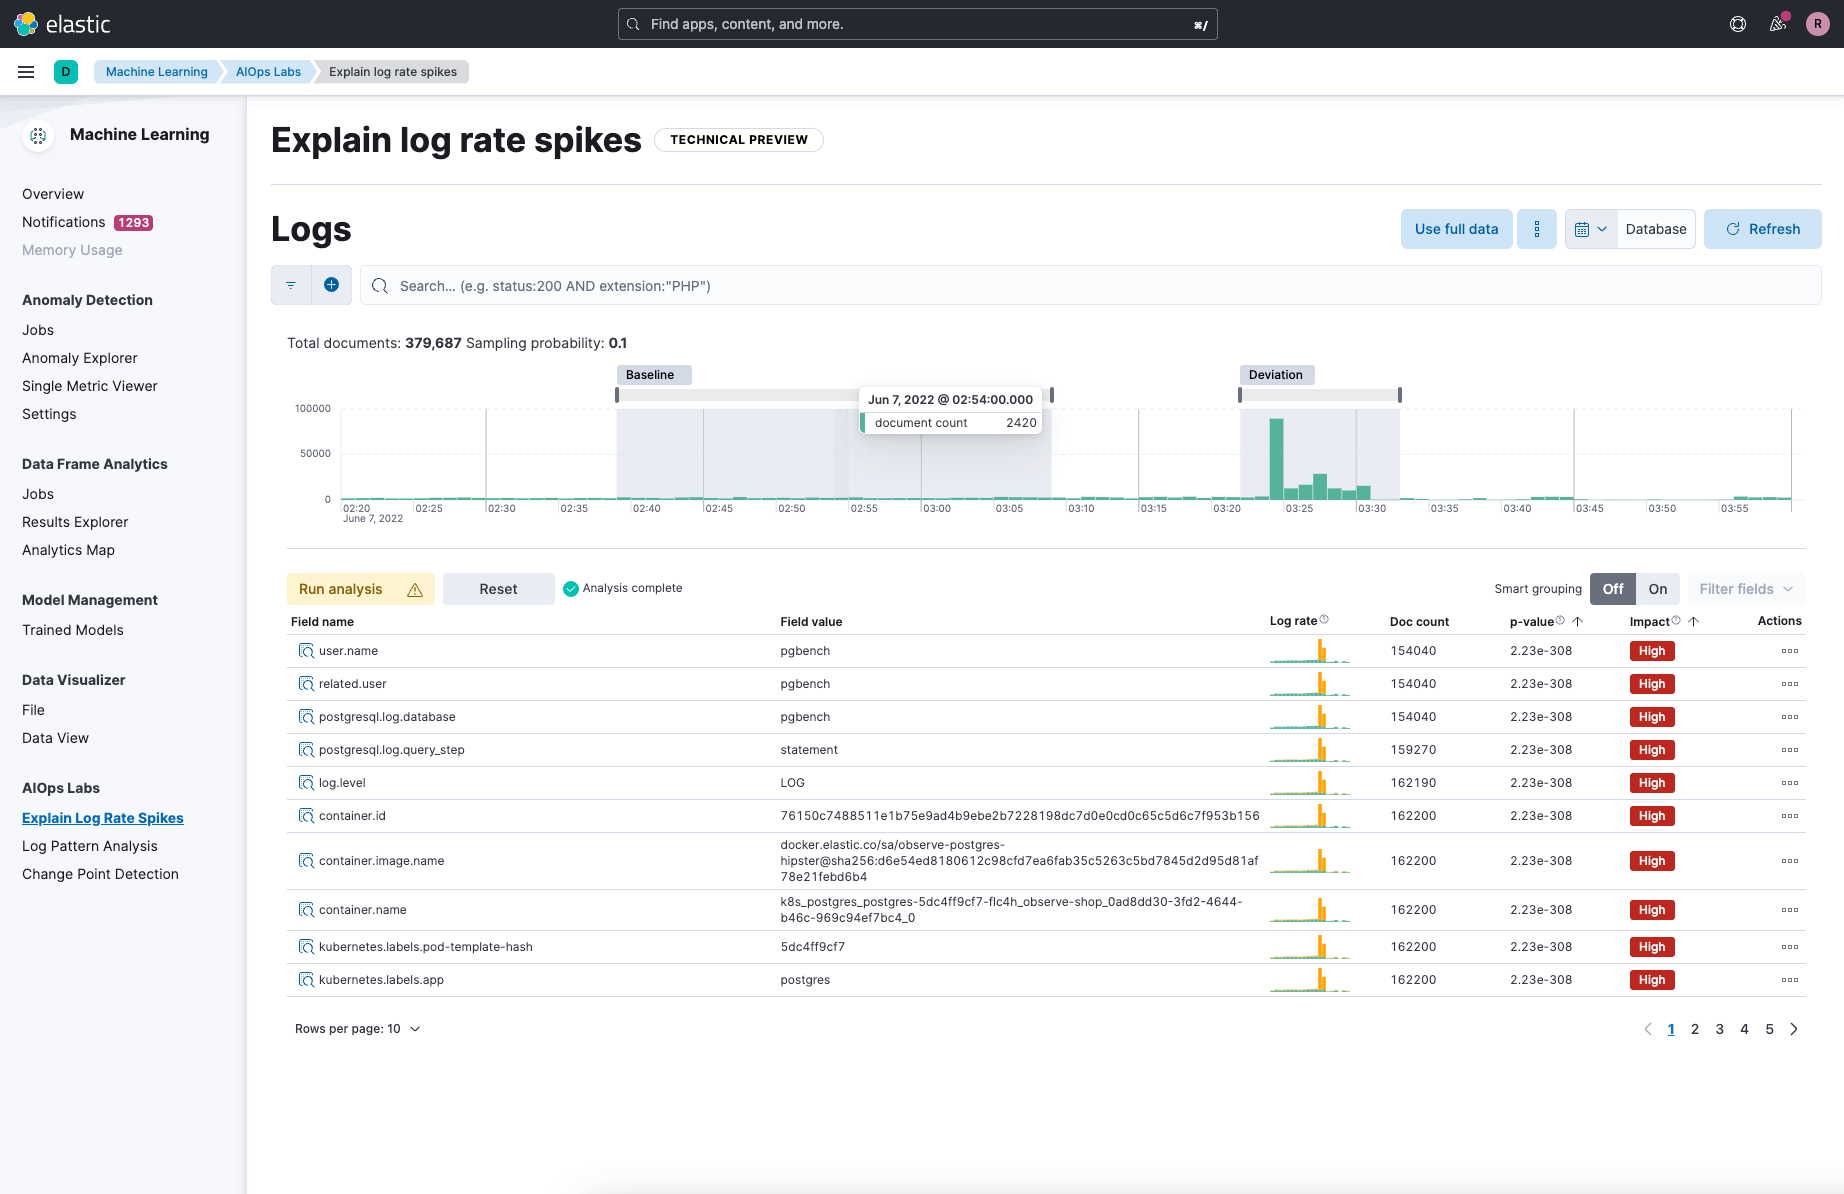
Once an alert has been triggered, Elastic’s AI-powered log spike analysis tool can quickly and automatically assess why the log rate changed: Is it one application? Is it happening only in one region? Is there commonality in the log messages that comprise this change? Historically to answer these questions, SREs would need to invest hours manually comparing logs and metadata in an effort to determine if the change in log rate is a real problem, and if so, its root cause. With Elastic’s log spike analysis tool, this arduous process is reduced to mere seconds.
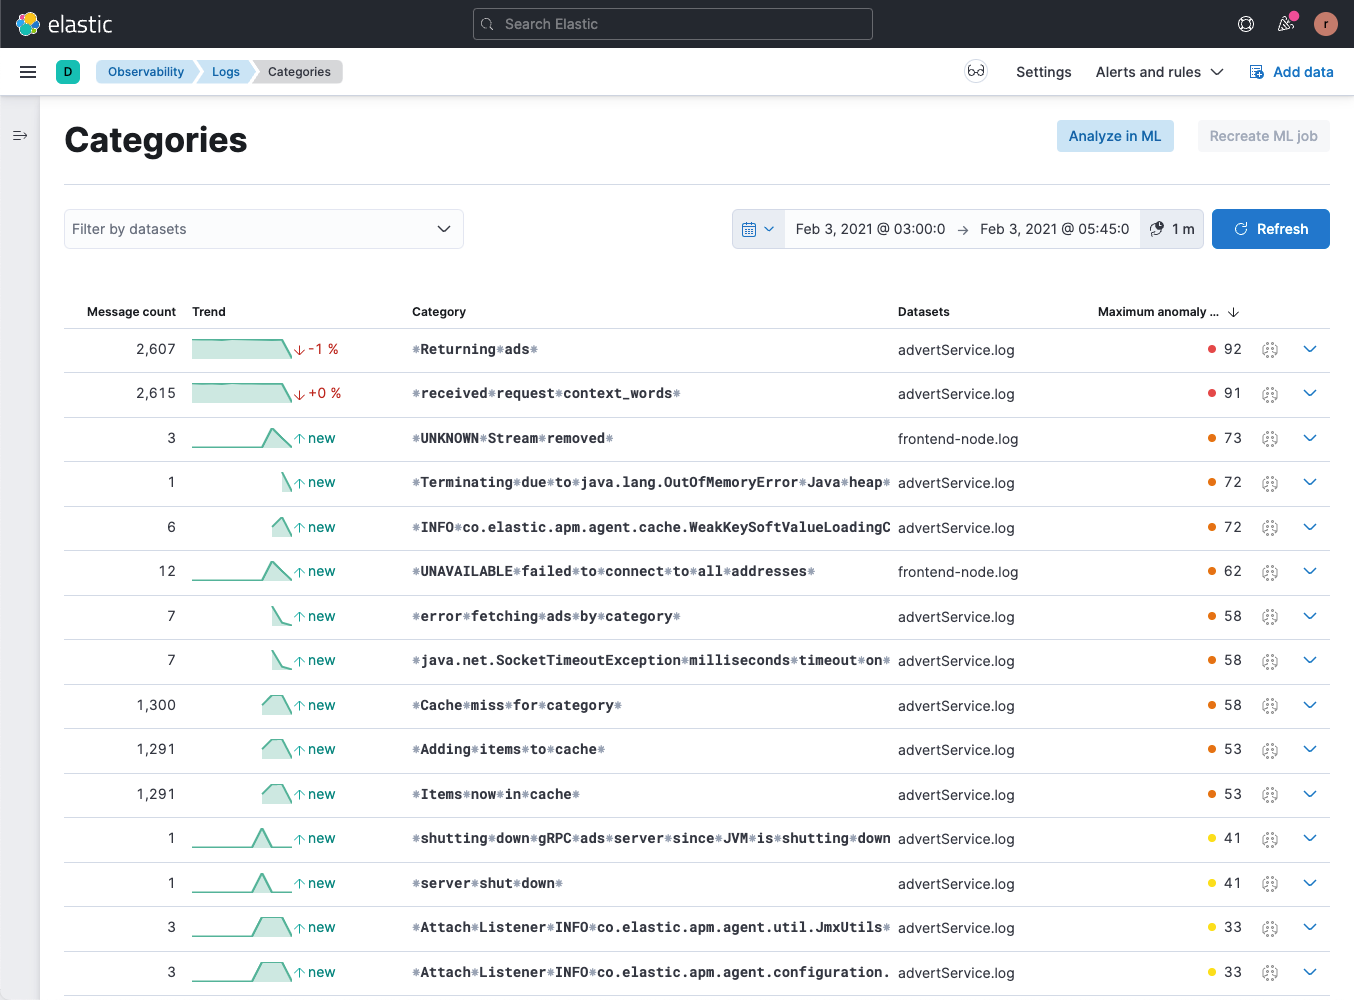
With the right tools, logs can be transformed from a reactive debugging tool into a proactive tool for business and operational monitoring. Elastic’s AI-powered log pattern analysis tool can quickly identify and bucketize the patterns of log lines coming from your applications. This makes it easy to spot recurring log patterns over time (and by frequency) which might be indicative of operational status or business KPIs. From there, you can leverage our ingest pipelines to liberate specific data points from your log lines into actionable data (e.g., alerts and visualizations).
What are your dependencies?
Developers today rely on countless third-party libraries, services, and container layers to rapidly construct complex applications and services. The sheer breadth of these dependencies, however, has become a real challenge to SREs. SREs typically don’t know what third-party libraries have been employed. Further, SREs can’t be expected to readily recognize the nomenclature used by these third-party libraries in their corresponding log lines.
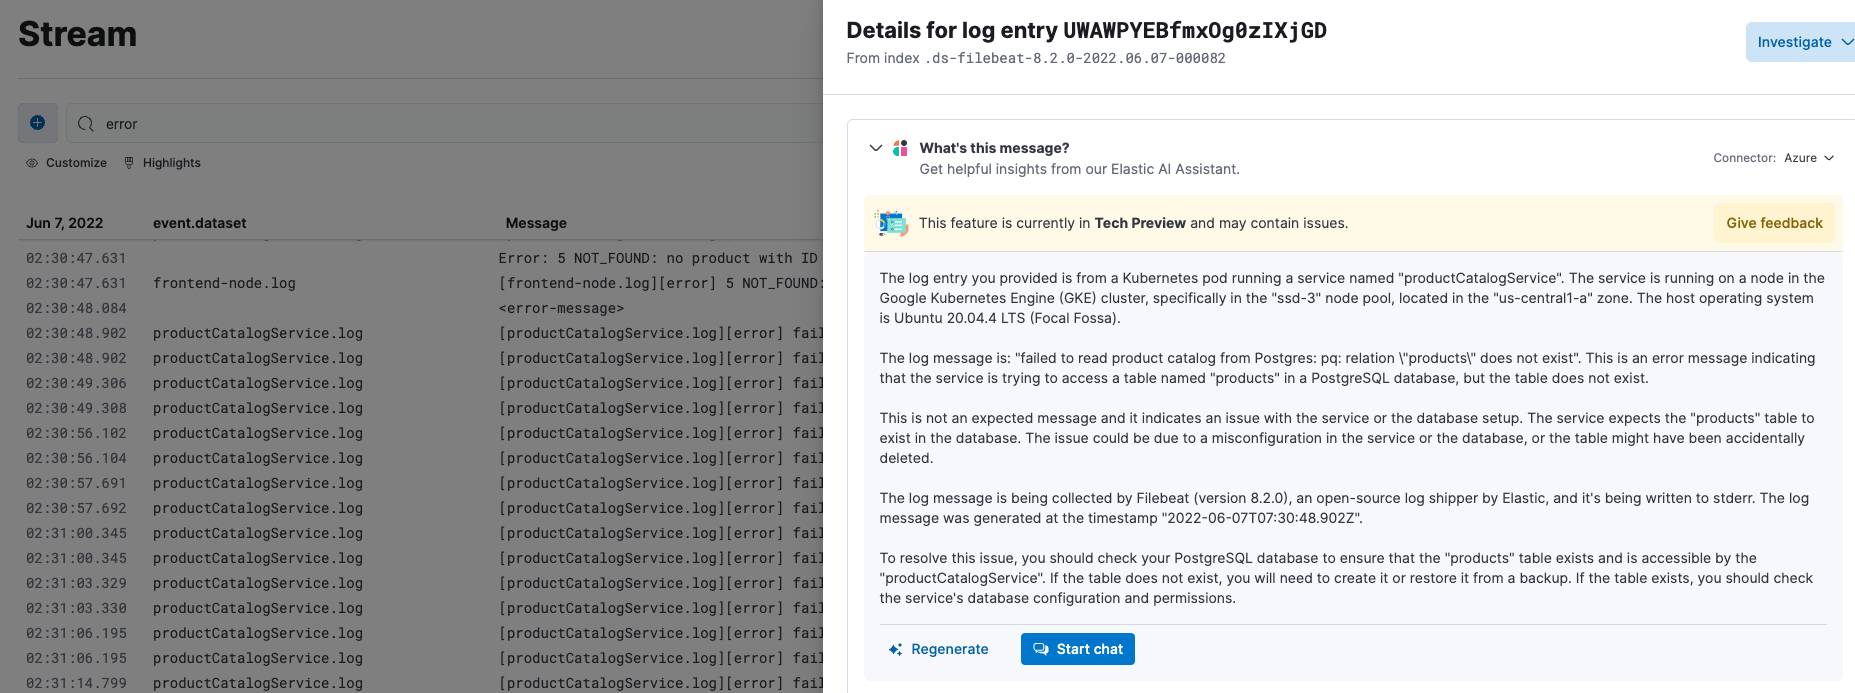
Elastic’s new AI Assistant aims to tackle this problem and level the playing field among SREs. When an SRE encounters a log line they don’t recognize, Elastic’s AI Assistant can quickly help them understand what library the log line emanated from, whether or not it’s an error message, and how the issue can be resolved, all while staying within the Elastic observability interface.
If the log line is coming from custom application code, Elastic’s AI Assistant can further reference your own runbooks and documentation to help SREs quickly understand what action to take. If the log line is indicative of an error, our AI Assistant can direct your SREs to existing, related GitHub issues so they can quickly know if this is a new or known issue.
The Elastic AI Assistant is designed to work with your analysts, saving them manual lookup time and leading them to RCA faster and more accurately than ever before. Elastic recognizes the security concerns inherent with any AI Assistant technology and has designed the Elastic AI Assistant specifically with these concerns in mind. Your runbooks and documentation are kept private, leveraging Elastic’s state-of-the-art ESRE and retrieval augmented generation (RAG) technology.
We’ll meet you where you are
Are your apps spread across multiple cloud environments (e.g., Azure and AWS)? Do you have a mix of both on-prem and cloud app deployments? Might your choice of preferred cloud provider change in the years to come?
Logging solutions native to the public cloud providers are, not surprisingly, generally ill-suited for capturing log data from outside the boundaries of the provider. While mechanisms exist, they are generally poorly supported and lack features (rich metadata, centralized configuration, error resilience) typically available to applications running within the walled garden of a given cloud provider.
Some customers may choose to use different logging solutions based on the location of their applications. This design pattern, however, can make it difficult in the future to move applications or developers between projects. Moreover, SREs often need to work across application teams, requiring them to learn the nuance of multiple logging tools. All of this adds delay to the RCA process, reduces the efficiency of your teams, and ultimately leads to friction. That friction will in turn reduce usage of the tools, leaving your teams blind to potential operational problems.
Choosing Elastic for logging means not tying yourself to a specific cloud provider. It means providing a unified user experience for your SREs and developers regardless of application or service. With Elastic, you can have a single centralized logging cluster, independent of the operational environment of your applications. Or, if there is a compelling reason to collocate logging clusters with applications (e.g., security policies or cost), you can have multiple Elastic clusters spread across your application deployments. With Elastic’s cross-cluster search technology, your end users will never know the difference — they’ll perform their work through a single user interface while Elastic handles the heavy lifting of figuring out where the requisite data resides.
Keeping costs in check
The noisy and bursty nature of log signals can quickly lead to runaway costs with competitive logging solutions.
For logging services native to cloud providers, cost structures are typically quite complex. This makes it challenging to understand how costs could be reduced. Further, charges related to cloud provider logging solutions often get obscured as a line item on an overall cloud provider bill, making them easy to miss, despite their substantial cost. By comparison, Elastic’s pricing is transparent and straightforward: we charge you for the storage and compute required to land, search, and retain your logs over a specified period of time.
For other cloud-hosted logging solutions, high retention costs negatively encourage shorter data retention periods or offline data lakes, leading to less visibility of problems and operational status. Elastic’s frozen data tier keeps all of your older log data online and searchable while keeping costs relatively flat. You gain all the cost benefits of a data lake with none of the operational overhead associated with data rehydration.
Additionally, Elastic’s flexible deployment patterns give you the tools to keep logging costs within reason:
To help reduce the cost of egressing logs from your applications running in the Cloud, we support VPC peering on all major cloud providers between your Cloud’s application VPC and the Elastic Cloud VPC.
To help reduce the cost of test, development, and non-production environments, Elastic Cloud lets you quickly deploy, scale, test, and tear down environments; you pay only for the hours that you need.
Tying it all together
Elastic strongly believes that the future of observability is one in which logging, APM, infrastructure monitoring, security, and profiling are fully integrated, providing a holistic view through a single unified interface. Doing so puts all your observability data in one place, free of friction. This in turn encourages your SREs to look at problems from multiple angles, helping them drive to a definitive RCA faster and with more accuracy.
Elastic Agent along with our support for OpenTelemetry makes it easy to ingest all of your observability signals into Elastic. Your log lines will be tagged with the same metadata as your APM data, allowing analysts to quickly and easily pivot between signals without requiring manual timespan or address correlation.
As your internal technology roadmaps lead toward tool consolidation and holistic monitoring, give consideration to which logging vendors are capable of ultimately ingesting all of your telemetry signals. Elastic allows you to start with logs, and over time add APM, infrastructure monitoring, profiling, and security to the same observability platform. Change is hard, but the cost and operational gains of a converged observability solution are immeasurable.
Finally, Elastic is also uniquely positioned to ingest, process, and tie together your business metrics and KPIs alongside your observability data. Do you know how your infrastructure impacts revenue? Or how a given outage impacted customer experience? This level of correlation, enabled by Elastic’s open data platform, empowers you to spend your infrastructure dollars in a manner optimized for your business; it can also help justify your spend on observability.
Keep it simple
Elastic understands that you want to keep your operational staff focused on running your business applications and not running your logging infrastructure. To that end, Elastic continues to make big investments in simplifying the onboarding and operation of our observability platform.
Our ongoing commitment to OpenTelemetry allows you to invest once in fully instrumenting your applications without worrying about vendor lock-in. In April 2023, Elastic contributed our Elastic Common Schema (ECS) to Open Telemetry, further making Elastic the premiere platform for observing OpenTelemetry-enabled applications.
Our fully fleet-managed Elastic Agent lets you deploy one unified agent per host with centralized configuration to easily configure and collect infrastructure and service telemetry. Elastic is also working with every major cloud provider to make sending logs to Elastic Cloud as easy as sending logs to a native cloud provider observability service.
We are changing the way in which the industry will think about onboarding log files. Our new experience will abstract away the complexities of indices, policies, and mappings, letting you focus on the data within the logs, rather than managing the log files themselves.
Are your developers and SREs coming from a competitive observability platform? Our Elastic AI Assistant can help onboard your end users, writing queries for them using natural language (i.e., “give me a list of pods whose memory was >= 90% of their limit”).
Finally, our forthcoming Elastic Cloud Serverless offering will provide observability (including logging) as a fully-managed Cloud service. With Serverless, Elastic will manage every aspect of compute, storage, and operations; you just need to bring the telemetry data and the end users!
We’re here to help!
In large part because of the innovations detailed here, Elastic has been recognized by Gartner and Forrester as a top 3 observability vendor. It’s also why big companies continue to turn to Elastic to meet their logging needs. But don’t take our word for it; see for yourself how Elastic is bringing new value to the venerable log line. You can play with our demo cluster here, or test against your own log data with a free Elastic Cloud trial.
The release and timing of any features or functionality described in this post remain at Elastic's sole discretion. Any features or functionality not currently available may not be delivered on time or at all.
Share
- Share on Twitter
Share on Twitter
- Share on LinkedIn
Share on LinkedIn
- Share on Facebook
Share on Facebook
- Share by Email
Share by Email
- Print this page
Print