Historically, software development and SRE have worked in silos with different cultural perspectives and priorities. The goal of DevOps is to establish common and complementary practices across software development and operations. However, for some organizations true collaboration is rare, and we still have a way to go to build effective DevOps partnerships.
Outside of cultural challenges, one of the most common reasons for this disconnect is using different tools to achieve similar goals — case in point, end-to-end (e2e) testing versus synthetic monitoring.
This blog shares an overview of these techniques. Using the example repository carlyrichmond/synthetics-replicator, we’ll also show how Playwright, @elastic/synthetics, and GitHub Actions can combine forces with Elastic Synthetics and the recorder to unite development and SRE teams in validating and monitoring the user experience for a simple web application hosted on a provider such as Netlify.
Elastic recently introduced synthetics monitoring, and as highlighted in our prior blog, it can replace e2e tests altogether. Uniting around a single tool to validate the user workflow early provides a common language to recreate user issues to validate fixes against.
Synthetics Monitoring versus e2e tests
If development and operations tools are at war, it’s difficult to unify their different cultures together. Considering the definitions of these approaches shows that they in fact aim to achieve the same objective.
e2e tests are a suite of tests that recreate the user path, including clicks, user text entry, and navigations. Although many argue it’s about testing the integration of the layers of a software application, it’s the user workflow that e2e tests emulate. Meanwhile, Synthetic Monitoring, specifically a subset known as browser monitoring, is an application performance monitoring practice that emulates the user path through an application.
Both these techniques emulate the user path. If we use tooling that crosses the developer and operational divide, we can work together to build tests that can also provide production monitoring in our web applications.
Creating user journeys
When a new user workflow, or set of features that accomplish a key goal, is under development in our application, developers can use @elastic/synthetics to create user journeys. The initial project scaffolding can be generated using the init utility once installed, as in the below example. Note that Node.js must be installed prior to using this utility.
npm install -g @elastic/synthetics
npx @elastic/synthetics init synthetics-replicator-tests
Before commencing the wizard, make sure you have your Elastic cluster information and the Elastic Synthetics integration set on your cluster. You will need:
- Monitor Management must be enabled within the Elastic Synthetics app as per the prerequisites in the documentation getting started.
- The Elastic Cloud cluster Cloud ID if using Elastic Cloud. Alternatively, if you are using on-prem hosting you need to enter your Kibana endpoint.
- An API key generated from your cluster. There is a shortcut in the Synthetics application Settings to generate this key under the Project API Keys tab, as shown in the documentation.
This wizard will take you through and generate a sample project containing configuration and example monitor journeys, with a structure similar to the below:
For web developers, most of the elements such as the README and package.json and lock files will be familiar. The main configuration for your monitors is available in synthetics.config.tsas shown below. This configuration can be amended to include production and development-specific configuration. This is essential for combining forces and reusing the same monitors for e2e tests and allowing for any journeys to be used as e2e tests and production monitors. Although not in this example, details of private locations can be included if you would prefer to monitor from your own dedicated Elastic instance rather than from Elastic infrastructure.
import type { SyntheticsConfig } from "@elastic/synthetics";

export default (env) => {
  const config: SyntheticsConfig = {
    params: {
      url: "http://localhost:5173",
    },
    playwrightOptions: {
      ignoreHTTPSErrors: false,
    },
    /**
     * Configure global monitor settings
     */
    monitor: {
      schedule: 10,
      locations: ["united_kingdom"],
      privateLocations: [],
    },
    /**
     * Project monitors settings
     */
    project: {
      id: "synthetics-replicator-tests",
      url: "https://elastic-deployment:port",
      space: "default",
    },
  };
  if (env === "production") {
    config.params = { url: "https://synthetics-replicator.netlify.app/" };
  }
  return config;
};
Writing your first journey
Although the above configuration applies to all monitors in the project, it can be overridden for a given test.
import { journey, step, monitor, expect, before } from "@elastic/synthetics";

journey("Replicator Order Journey", ({ page, params }) => {
  // Only relevant for the push command to create
  // monitors in Kibana
  monitor.use({
    id: "synthetics-replicator-monitor",
    schedule: 10,
  });

  // journey steps go here
});
The @elastic/synthetics wrapper exposes many standard test methods such as the before and after constructs that allow for setup and tear down of typical properties in the tests, as well as support for many common assertion helper methods. A full list of supported expect methods are listed in the documentation. The Playwright page object is also exposed, which enables us to perform all the expected activities provided in the API such as locating page elements and simulating user events such as clicks that are depicted in the below example.
import { journey, step, monitor, expect, before } from "@elastic/synthetics";

journey("Replicator Order Journey", ({ page, params }) => {
  // monitor configuration goes here

  before(async () => {
    await page.goto(params.url);
  });

  step("assert home page loads", async () => {
    const header = await page.locator("h1");
    expect(await header.textContent()).toBe("Replicatr");
  });

  step("assert move to order page", async () => {
    const orderButton = await page.locator("data-testid=order-button");
    await orderButton.click();

    const url = page.url();
    expect(url).toContain("/order");

    const menuTiles = await page.locator("data-testid=menu-item-card");
    expect(await menuTiles.count()).toBeGreaterThan(2);
  });

  // other steps go here
});
As you can see in the above example, it also exposes the journey and step constructs. This construct mirrors the behavior-driven development (BDD) practice of showing the user journey through the application in tests.
Developers are able to execute the tests against a locally running application as part of their feature development to see successful and failed steps in the user workflow. In the below example, the local server startup command is outlined in blue at the top. The monitor execution command is presented in red further down.
As you can see from the green ticks next to each journey step, each of our tests pass. Woo!
Gating your CI pipelines
It’s important to use the execution of the monitors within your CI pipeline as a gate for merging code changes and uploading the new version of your monitors. Each of the jobs in our GitHub Actions workflow will be discussed in this and the subsequent section.
The test job spins up a test instance and runs our user journeys to validate our changes, as illustrated below. This step should run for pull requests to validate developer changes, as well as on push.
jobs:
  test:
    env:
      NODE_ENV: development
    runs-on: ubuntu-latest
    steps:
      - uses: actions/checkout@v3
      - uses: actions/setup-node@v3
        with:
          node-version: 18
      - run: npm install
      - run: npm start &
      - run: "npm install @elastic/synthetics && SYNTHETICS_JUNIT_FILE='junit-synthetics.xml' npx @elastic/synthetics . --reporter=junit"
        working-directory: ./apps/synthetics-replicator-tests/journeys
      - name: Publish Unit Test Results
        uses: EnricoMi/publish-unit-test-result-action@v2
        if: always()
        with:
          junit_files: "**/junit-*.xml"
          check_name: Elastic Synthetics Tests
Note that, unlike the journey execution on our local machine, we make use of the --reporter=junit option when executing npx @elastic/synthetics to provide visibility of our passing, or sadly sometimes failing, journeys to the CI job.
Automatically upload monitors
To ensure the latest monitors are available in Elastic Uptime, it’s advisable to push the monitors programmatically as part of the CI workflow such as the example task below does. Our workflow has a second job push, shown below, which is dependent on the successful execution of our test job that uploads your monitors to your cluster. Note that this job is configured in our workflow to run on push to ensure changes have been validated rather than just raised within a pull request.
jobs:
  test: …
  push:
    env:
      NODE_ENV: production
      SYNTHETICS_API_KEY: ${{ secrets.SYNTHETICS_API_KEY }}
    needs: test
    defaults:
      run:
        working-directory: ./apps/synthetics-replicator-tests
    runs-on: ubuntu-latest
    steps:
      - uses: actions/checkout@v3
      - uses: actions/setup-node@v3
        with:
          node-version: 18
      - run: npm install
      - run: npm run push
The @elastic/synthetics init wizard generates a push command for you when you create your project that can be triggered from the project folder. This is shown below through the steps and working_directory configuration. The push command requires the API key from your Elastic cluster, which should be stored as a secret within a trusted vault and referenced via a workflow environment variable. It is also vital that monitors pass ahead of pushing the updated monitor configuration to your Elastic Synthetics instance to prevent breaking your production monitoring. Unlike e2e tests running against a testing environment, broken monitors impact SRE activities and therefore any changes need to be validated. For that reason, applying a dependency to your test step via the needs option is recommended.
Monitoring using Elastic Synthetics
Once monitors have been uploaded, they give a regular checkpoint to SRE teams as to whether the user workflow is functioning as intended — not just because they will run on a regular schedule as configured for the project and individual tests as shown previously, but also due to the ability to check the state of all monitor runs and execute them on demand.
The Monitors Overview tab gives us an immediate view of the status of all configured monitors, as well as the ability to run the monitor manually via the card ellipsis menu.
From the Monitor screen, we can also navigate to an overview of an individual monitor execution to investigate failures.
The other monitoring superpower SREs now have is the integration between these monitors to familiar tools SREs already use in scrutinizing the performance and availability of applications such as APM, metrics, and logs. The aptly named Investigate menu allows easy navigation while SREs are performing investigations into potential failures or bottlenecks.
There is also a balance between finding issues and being notified of potential problems automatically. SREs already familiar with setting rules and thresholds for notification of issues will be happy to know that this is also possible for browser monitors. The editing of an example rule is shown below.
The status of browser monitors can be configured not only to consider if any individual or collective monitors have been down several times, such as in the status check above, but also to gauge the overall availability by looking at the percentage of passed checks within a given time period. SREs are not only interested in reacting to issues in a traditional production management way — they want to improve the availability of applications, too.
Recording user workflows
The limitation of generating e2e tests through the development lifecycle is that sometimes teams miss things, and the prior toolset is geared toward development teams. Despite the best intentions to design an intuitive product using multi-discipline teams, users may use applications in unintended ways. Furthermore, the monitors written by developers will only cover those expected workflows and raise the alarm either when these monitors fail in production or when they start to behave differently if anomaly detection is applied to them.
When user issues arise, it’s useful to recreate that problem in the same format as our monitors. It’s also important to leverage the experience of SREs in generating user journeys, as they will consider failure cases intuitively where developers may struggle and focus on happy cases. However, not all SREs will have the experience or confidence to write these journeys using Playwright and @elastic/synthetics.
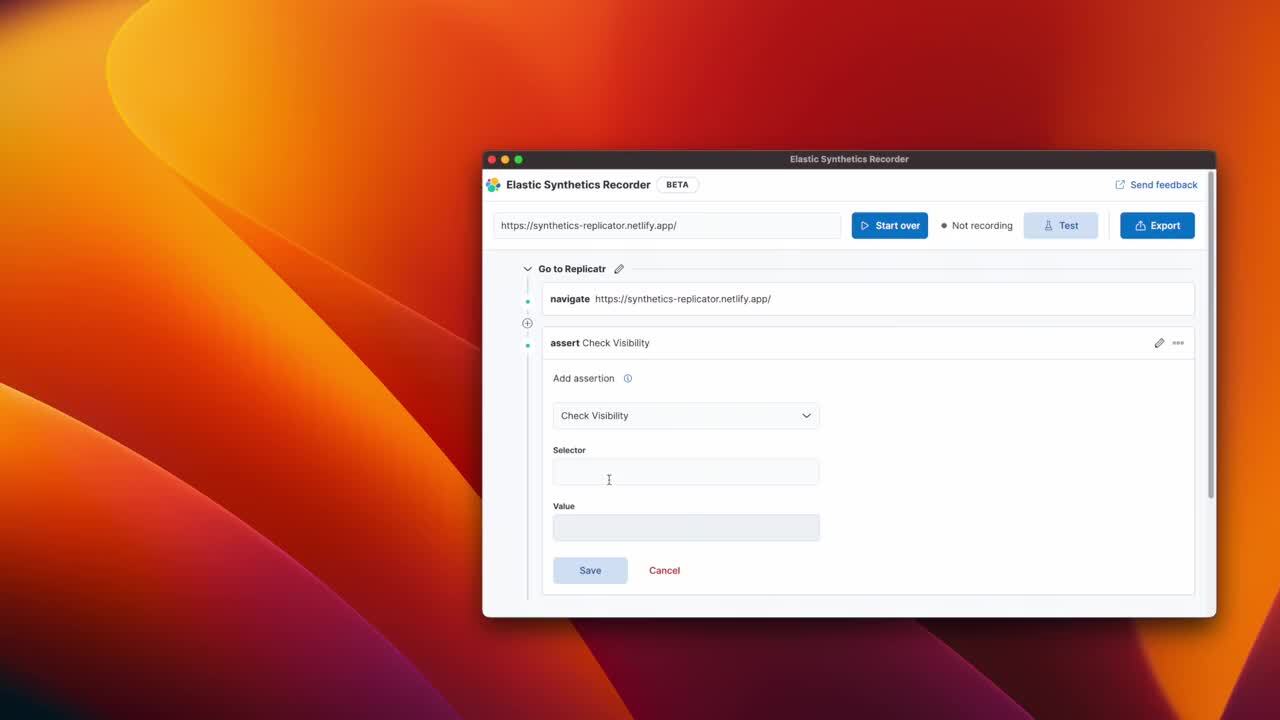
Enter the Elastic Synthetics Recorder! The above video gives a walkthrough of how it can be used to record the steps in a user journey and export them to a JavaScript file for inclusion in your monitor project. This is useful for feeding back into the development phase and testing developed fixes to solve the problem. This approach cannot be made unless we all combine forces to use these monitors together.
Try it out!
As of 8.8, @elastic/synthetics and the Elastic Synthetics app are generally available, and the trusty recorder is in beta. Share your experiences of bridging the developer and operations divide with Synthetic Monitoring via the Uptime category in the Community Discuss forums or via Slack.
Happy monitoring!
Originally published February 6, 2023; updated May 23, 2023.