Why and how to replace end-to-end tests with synthetic monitors


 Share on Twitter
Share on Twitter

 Share on LinkedIn
Share on LinkedIn

 Share on Facebook
Share on Facebook

 Share by Email
Share by Email

 Print this page
Print
A thousand tests can't prove your software works. They can only prove it doesn't. When your code reaches production, even the most thorough end-to-end tests can't prevent your users from seeing that "500 - Unexpected Server Error" screen that keeps you awake at night.
In this blog post, you'll learn why even the most thorough end-to-end tests can't prove your software works and get to know an alternative to these classic end-to-end tests: synthetic monitors.
The latest version of Kibana is shipping with many improvements to Elastic's Synthetics and this blog post will help you use them.
First, we'll explain what synthetic monitors are and the advantages of writing synthetics tests over traditional end-to-end tests.
Then, we'll describe how you can use Elastic's Synthetic Monitors to help you build software that "works on your machine" and everyone else's, both before and after your code reaches production.
Why can't end-to-end tests prove your software works and what can you do about it?
This section will use an anecdote to explain why you need more than just automated tests to write software that works both in production and your machine. You'll also learn about the advantages of replacing classic end-to-end tests with synthetic monitors.
Imagine your impressive new feature has been weeks in the making, and it's about time to #ShipIt. Given how critical your new feature is to your e-commerce platform, you've made sure to write plenty of end-to-end tests using Selenium or Cypress. Everything is green on CI, and you're confident that everything will work fine in production.
Because you work in an organization that considers itself highly technically mature, you don't mind shipping the new feature on a Friday. You then press the deploy button, double-check everything looks okay in production and head home for a well-earned rest.
By the time you come back on Monday, you see that there have been zero sales in the past 48 hours. How could that be? Your tests were passing, CI was green, and you even double-checked everything after deploying your software to production. However, even the most numerous and thorough end-to-end tests can't prove your software works because you can't validate all of your application's possible states.
End-to-end tests are just like any other scientific experiment. You pick a few states and inputs, and, if your application behaves as you expect, you choose to extrapolate your results and assume it will work for all other states and inputs, even though that may not always be the case.
After reverting your change, you look at the logs for Friday night and notice that a salesperson has created a coupon that threw the application into a bad state. While the application is in this state, any checkout, with or without coupons, ends in an "unexpected server error".
How could you prevent that from ever happening again? You can't write end-to-end tests that validate all of your application's possible states.
Furthermore, what if your customers' requests latency got too high, and these requests timed out? No matter how much effort you put into simulating your production environment in CI, you simply can't foresee and replicate all possible failure scenarios.
Perhaps improving your synthetic website monitoring practices would help, but what would you do if you're dealing with a feature that doesn't see much usage? Certainly, hiring someone to test all of your website's features in production routinely would be pretty expensive, and prohibiting deployments on Fridays could be even worse for your team's morale and the business dynamics.
Synthetic monitors solve all of those problems.
Synthetic journeys are end-to-end tests executed by a real browser and that you can run on your machine and CI, and configure to run periodically on the cloud, against any deployment environments, including production.
Using Kibana, you can then create Synthetic Monitors, which will periodically run your synthetic journeys against the desired deployment environments.
Had synthetic journeys and monitors been used in the story you've just read, you could've discovered problems sooner and thus made customers happier and the business more money.
Had you written a few synthetic journeys that exercise your feature and check your application's behavior, you could have used those journeys to test the application in your machine and CI. With synthetics, you write end-to-end tests once, and you can run them anywhere, using a real browser environment.
Furthermore, had you created a Synthetic monitor for that journey in Kibana, you could've kept those tests running against production during the whole weekend. By doing that, you'd receive alerts if your feature ever stops working. Doing so would help you catch errors before your users do, even for features that barely get used. After all, your synthetic monitors are exercising them.
Finally, if your production infrastructure is handling lots of users simultaneously, you must make sure it performs adequately. You must do so because if your software works but performs poorly, causing users to get frustrated and leave, that's as bad as having an application that doesn't work at all.
Because Elastic knows how important it is for websites to perform well, our synthetic monitors allow you to run journeys from servers all around the world and track user-centric metrics, like FCP, and LCP, for example. Furthermore, Elastic's machine learning capabilities can automatically detect anomalies and send out alerts to your team.
In addition to helping you prevent failure, Synthetics can help you embrace it. Synthetic monitors allow you to catch and fix problems even before a customer notices them.Writing your first synthetic journeys
Now that you've seen the benefits of using synthetic monitors, you'll learn how to write synthetic journeys, how to run them on your machine and CI, and how to set up synthetic monitors using Elastic Synthetics.
Before creating your first synthetic journey, make sure you create a `package.json` file within your test's directory. To do this quickly, you can run `npm init -y'. Then, install the synthetics runner as a dev-dependency using `npm install -D @elastic/synthetics`.
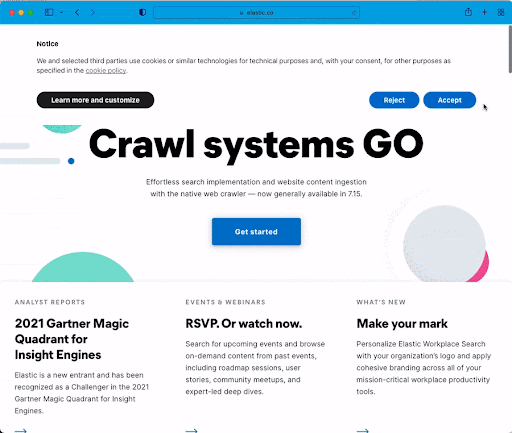
Now, let's create a synthetic journey: an end-to-end test that runs in a real browser. In this example, you'll write a synthetic journey to test the newsletter subscription feature on Elastic's website.
Go ahead and write your first journey within a file called newsletter.journey.js.
This journey will access Elastic's website, subscribe to Elastic's newsletter, and check whether the text "Thanks for subscribing!" appears on the page.
const { journey, step } = require("@elastic/synthetics");

journey('Subscribe to newsletter', ({ page }) => {
    step("access Elastic's website", async () => {
        await page.goto("https://elastic.co");
    });

    step("fill email field", async () => {
        const inputEmail = await page.$("input#Email");
        await inputEmail.scrollIntoViewIfNeeded();
        await inputEmail.type("example@example.com");
    });

    step("click newsletter signup button", async () => {
        const newsletterSignupBtn = await page.$('button:text("Sign up")');
        await newsletterSignupBtn.click();
    });

    step("ensure a success message appears", async () => {
        await page.waitForSelector("text=Thanks for subscribing!");
    });
});In the journey you've just written, you're passing a callback to the global `journey` function to encapsulate the whole test, just like you use Jest's `test` or `it` functions, for example. This callback function receives a Playwright Page instance so that you can interact with the real browser used for the test.
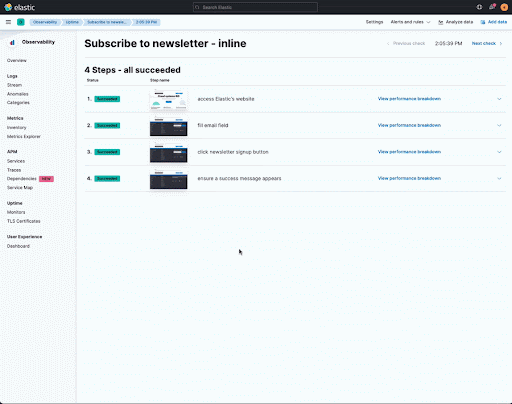
Within the journey, you're also using steps to break down your test into multiple parts. When you create a synthetic monitor for this journey, you'll see screenshots and detailed results for each of these steps in Kibana.
Now, run this journey by executing `npx @elastic/synthetics .` within the tests directory. Alternatively, you can use an `npm script` to run your tests or the @elastic/synthetics executable within `node_modules/.bin`.
As an exercise, you could also try creating a few other journeys to check different aspects of your application.
IMPORTANT: All these tests run in a real browser, so you can test any type of application. To see your browser when running your synthetics journeys, you can use the `--no-headless` option.
As you've just seen, synthetic journeys are just like end-to-end tests, but, as you'll see in the following sections, you can also configure Kibana to run them periodically against the production version of your application. Furthermore, Elastic's Synthetics product also offers you an intuitive API similar to the most popular JavaScript test runners, and a test environment with all the powerful features of Playwright, allowing you to test any web application out there.
Running Synthetics Journeys on CI
Besides replacing your end-to-end tests locally, synthetic journeys can replace the end-to-end tests you run on your CI environment.
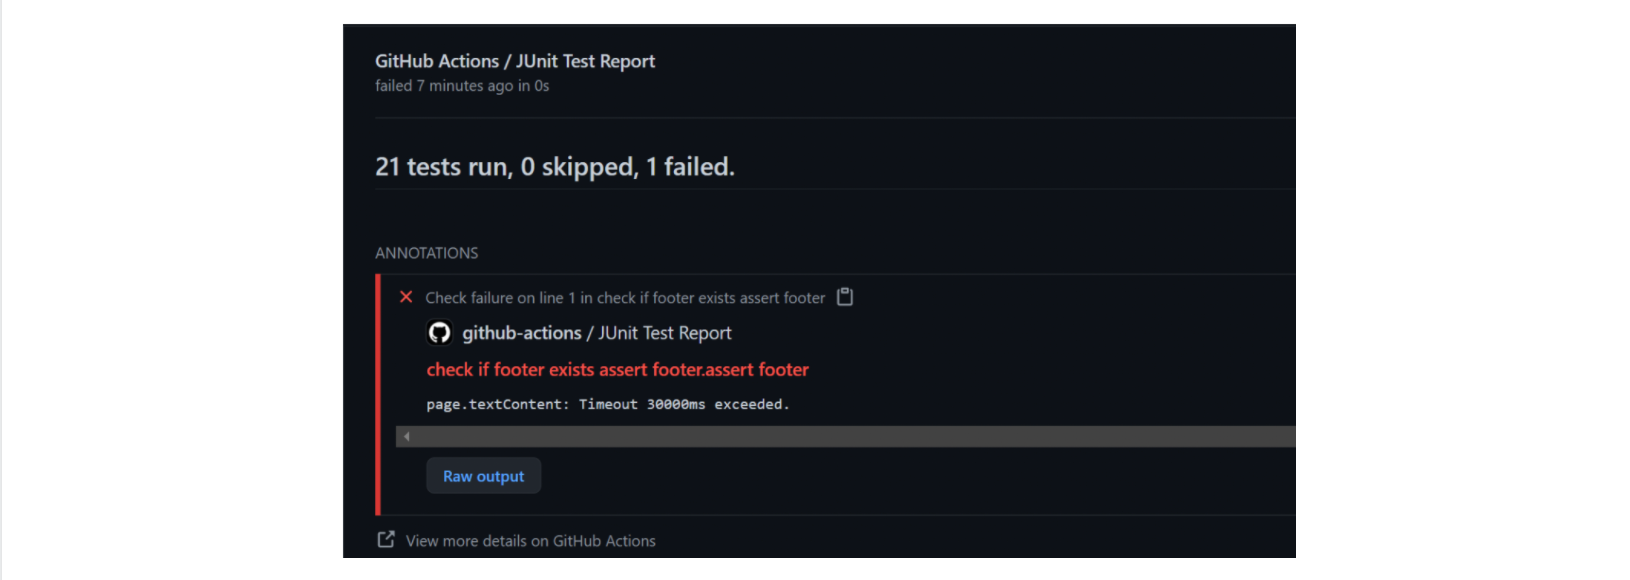
Just like you'd use Jest or Mocha to test your code within a CI environment, you can use the @elastic/synthetics runner to execute journeys. When any of your journeys fail, the runner will yield a non-zero exit code, which most CI systems pick up as a failure.
Furthermore, Elastic's synthetics runner can output results in multiple formats, including JSON, which is easy to parse, and JUnit, the standard format supported by most CI platforms.
As an example, you can see in one of our demo repositories how we use GitHub Actions to set up a job that executes the synthetics runner and tells the runner to yield results in a JUnit format.
jobs:
  e-commerce-tests:
    runs-on: ubuntu-latest
    defaults:
      run:
        working-directory: 'e-commerce'
    steps:
      - uses: actions/checkout@v2
      - uses: actions/setup-node@v2
        with:
          node-version: '12.22.3'
      - run: npm install
      - run: "SYNTHETICS_JUNIT_FILE='junit-synthetics.xml' npx @elastic/synthetics . --reporter=junit"
        continue-on-error: true
      - name: Publish JUnit Test Report
        uses: mikepenz/action-junit-report@v2
        with:
          report_paths: '**/junit-*.xml'
          fail_on_failure: true
require_tests: trueWhen one of the journeys within the repo fails, you'll have a failing check, just like you would with another end-to-end test runner.
Setting up Synthetic Monitors through Kibana
Now that you know how to create synthetic journeys, run them, and set them up on CI, in this section, you'll learn how to make the most out of your journeys by configuring synthetic monitors that will run these journeys periodically against your deployment environments.
As a first example, let's take the journey you've written earlier in this blog post and create a new Synthetics Integration, which your Elastic Agents will run.
Within this integration, you'll paste the contents of your journey — that is, only its steps.
As you configure your new Synthetics Integration, you can determine how frequently your Elastic Agents should run it. If you have a critical piece of functionality, like checking out a shopping cart, for example, you may want to run a journey that tests that journey at least every five minutes, for example.
After you've created that monitor integration, you'll be able to see the results of your journeys within Kibana itself.
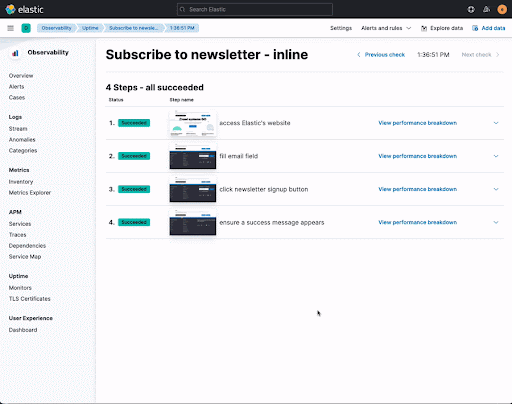
Furthermore, you'll have a detailed breakdown of the journey's results, including screenshots for each step, and insights into how your website is performing, all powered by the Elastic stack.
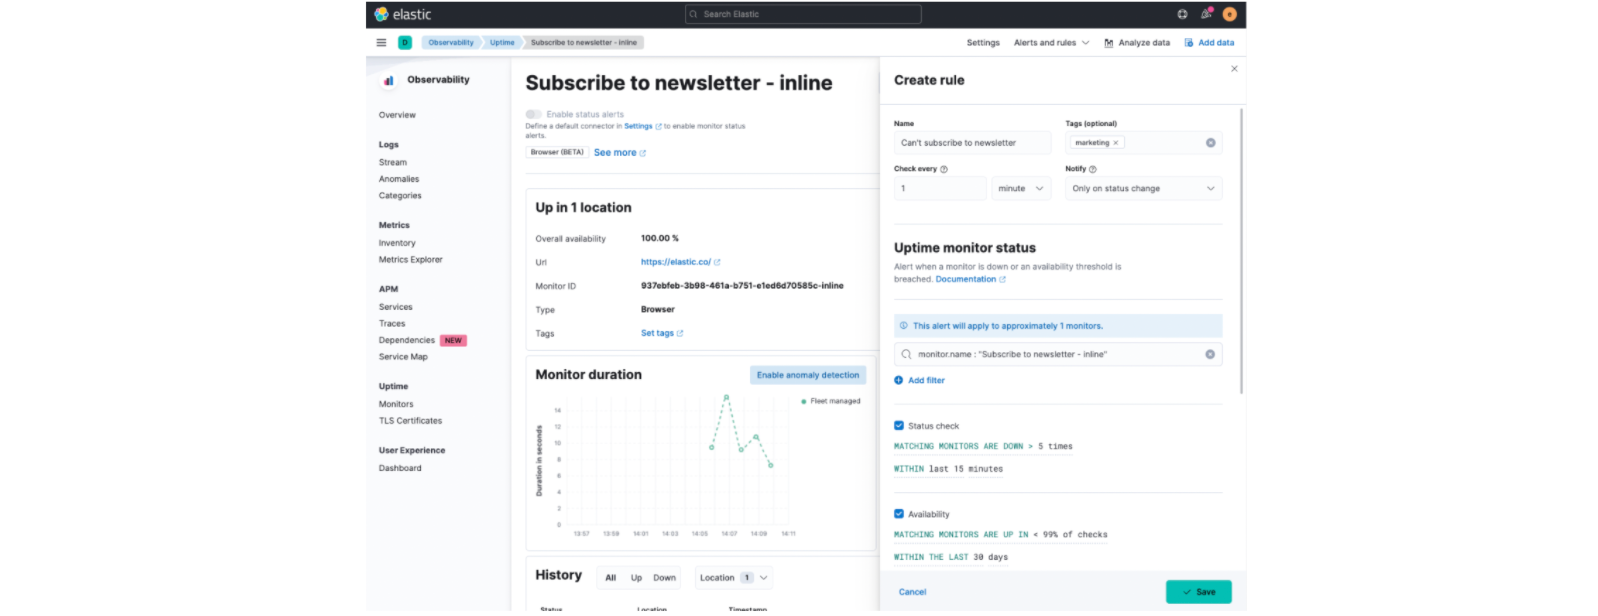
And, to help you address issues as soon as they arise, you can also set up an alert that will send out an email or Slack message, for example, whenever your monitors fail.
Notice how you've only written tests once, but now you're capable of running them anywhere. Being able to run your tests anywhere, multiple times, helps you extract the most out of your end-to-end tests. Instead of only validating your application as you develop it and integrate your code, you can now continuously run tests in production.
Before synthetic monitors, you extracted a few minutes of value from your end-to-end tests by replacing hours of manual testing with minutes of automated testing. After synthetic monitors, you continue to extract value from your tests even after your code has reached production.
Another advantage of using synthetic monitors is that this practice helps foster a DevOps culture as it helps bridge the gap between developers and QA professionals. Now, QA can help developers better test their software locally, and developers can help QA free up time to perform more proactive work by contributing to automating the tests which run against production.
Automatically updating monitors and running tests against multiple environments
Manually copying and pasting a journey's code into Kibana is not scalable. If you have hundreds or thousands of journeys, manually editing all of your synthetic monitors through Kibana's UI will take a lot of unnecessary time.
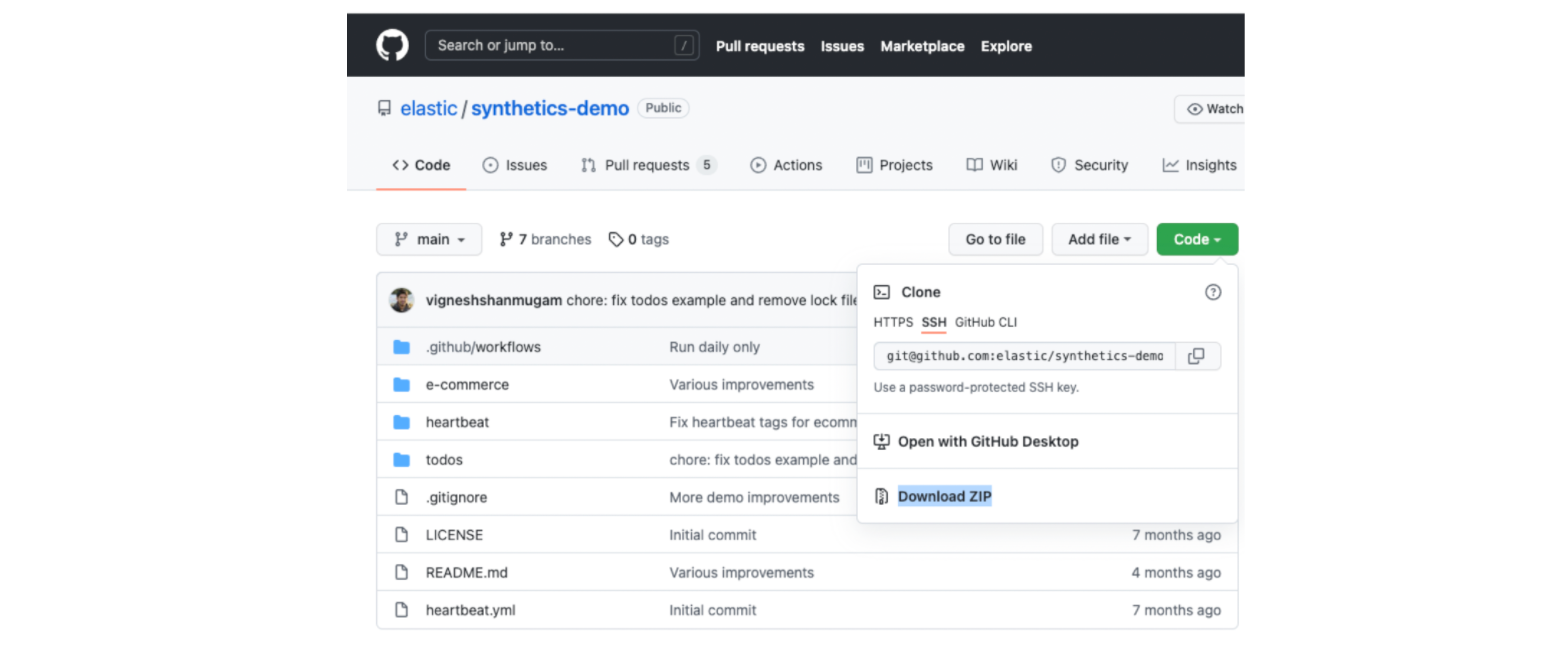
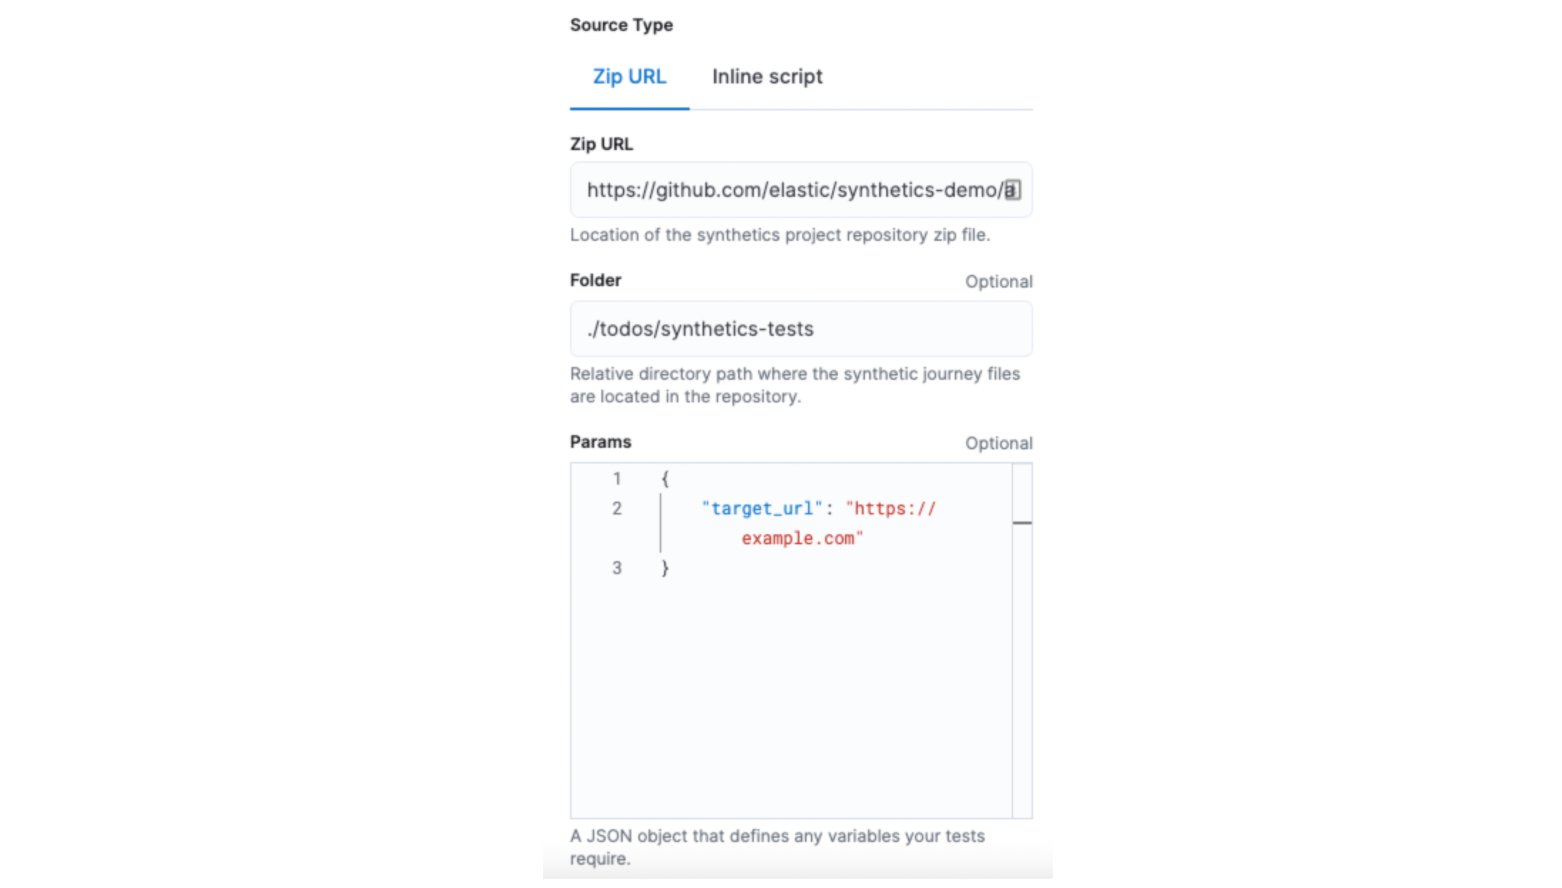
To save yourself this time and effort and automatically update your monitors as you deploy new versions of your journeys, you can set up a synthetic integration that will download and run journeys from your repository's ZIP file, whose URL you can easily find on GitHub.
For that, when setting up your Synthetics integration, you'll need to choose the ZIP URL source type and enter both the repository's ZIP URL and the relative path for your journeys within the repository's ZIP file.
As you configure this integration using a ZIP URL, you can also define a few variables which will be passed to each of your journeys. In the screenshot below, for example, we're defining a configuration parameter called `target_url`, whose value is `https://example.com`.
You can then read this variable within your journeys by accessing the `params` property in the object passed your journey's callback, as in the example below.
journey('Subscribe to newsletter', ({ page, params }) => {
    step("access Elastic's website", async () => {
        await page.goto(params.target_url);
    });

    step("fill email field", async () => {
        const inputEmail = await page.$("input#Email");
        await inputEmail.scrollIntoViewIfNeeded();
        await inputEmail.type("example@example.com");
    });

    step("click newsletter signup button", async () => {
        const newsletterSignupBtn = await page.$('button:text("Sign up")');
        await newsletterSignupBtn.click();
    });

    step("ensure a success message appears", async () => {
        await page.waitForSelector("text=Thanks for subscribing!");
    });
});Thanks to these parameters, you can have multiple suites running against various environments, with different configurations for each.
Next Steps
The latest version of Kibana is shipping with many improvements to Elastic's Synthetics, including, for example, a script recorder, which will make it easier for professionals other than developers to create journeys.
If you've found this blog post helpful, see our Synthetics Guide and drop us a line in the Discuss Forums for Uptime, we'd love to learn more about how you're using Synthetics. We look forward to hearing your feedback!
Share
- Share on Twitter
Share on Twitter
- Share on LinkedIn
Share on LinkedIn
- Share on Facebook
Share on Facebook
- Share by Email
Share by Email
- Print this page
Print