Kubernetes observability tutorial: Monitoring application performance with Elastic APM
This post is the third in our Kubernetes observability tutorial series, where we explore how you can monitor all aspects of your applications running in Kubernetes, including:
- Ingesting and analysing logs
- Collecting performance and health metrics
- Monitoring application performance with Elastic APM
We’ll discuss using Elastic Observability to perform application performance monitoring (APM) with the Elastic APM.
| Before you get started: The following tutorial relies on having a Kubernetes environment setup. We’ve created a supplementary blog that walks you through the process of setting up a single-node Minikube environment with a demo application to run the rest of the activities. |
Monitoring application performance
APM focuses on the automatic measurement of key user-facing service level indicators (SLI): request/response latency and user-facing errors. By effectively monitoring these, you can quickly find the component (even the code block) responsible for issues like performance degradation or an increase in errors. APM provides a great first-level triage tool that can pinpoint the root cause of the problem, reducing the mean time to respond (MTTR).
Distributed tracing with Elastic APM
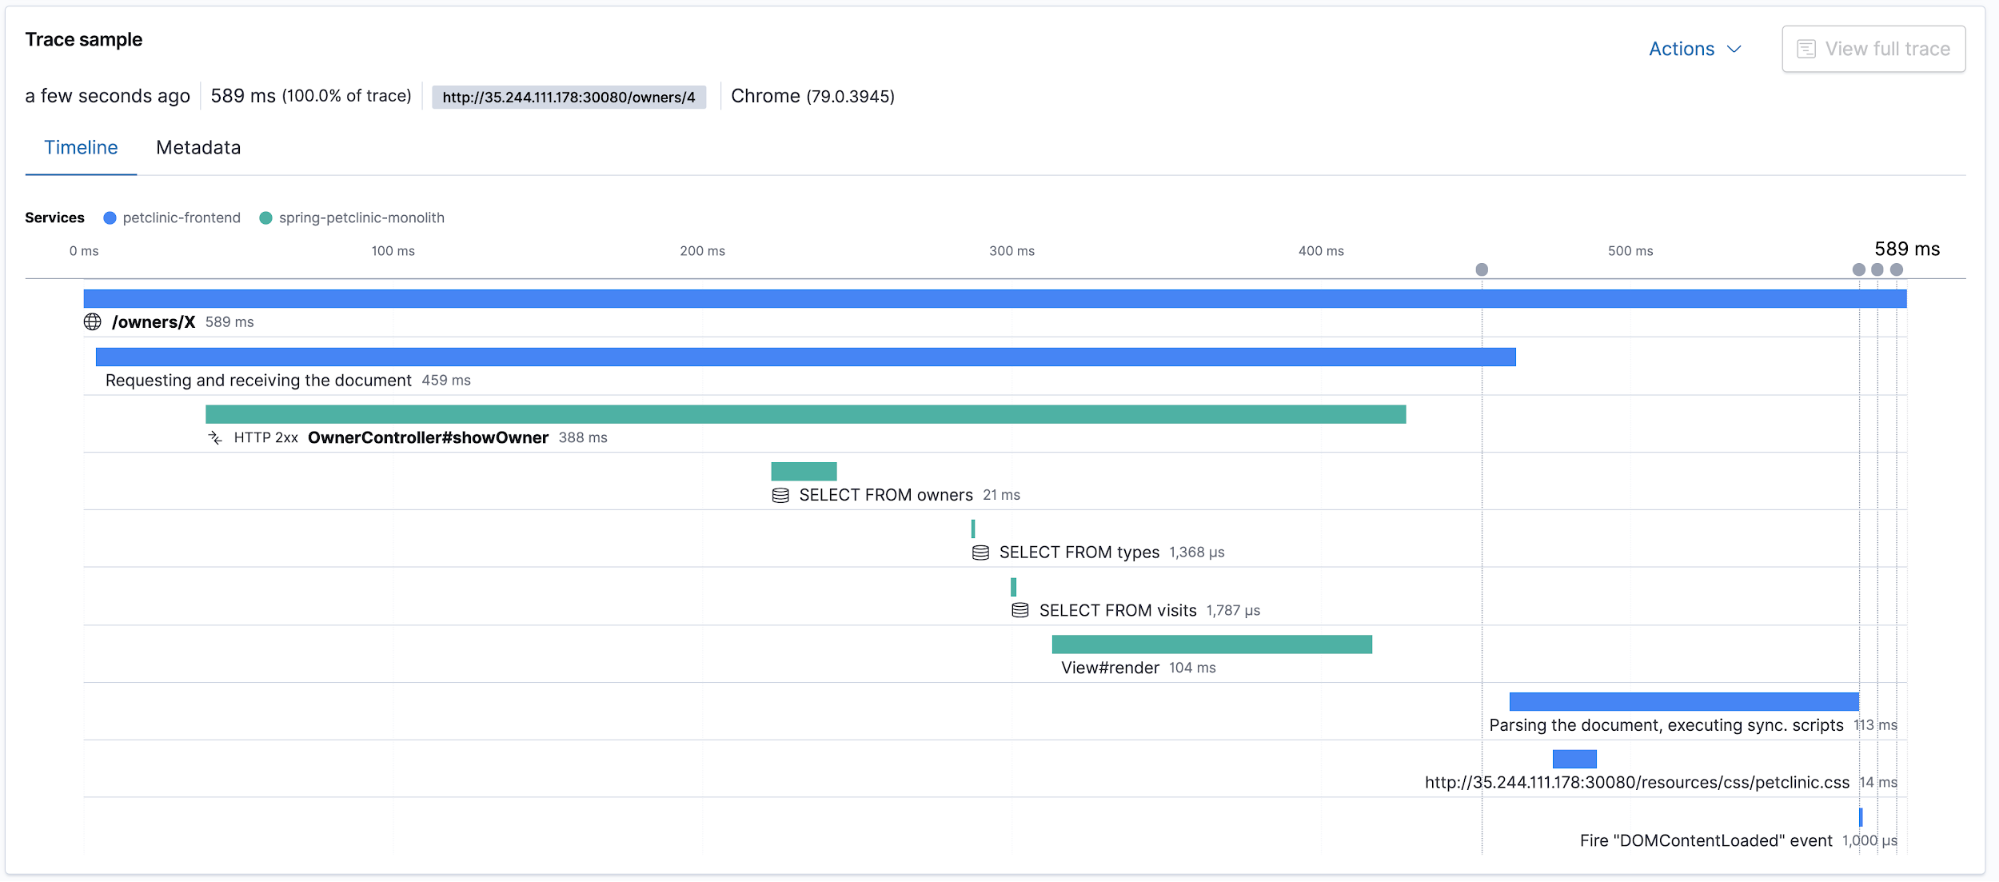
Elastic APM supports distributed tracing, which allows measuring an end-to-end request/response latency of different distributed application components participating in serving the same user request. The APM app displays the overall trace duration as well as the breakdown of component-related latencies participating in the distributed trace. Let’s head to the APM app in Kibana and check out the traces and transactions. Note: Make sure to generate some user traffic by clicking around in the petclinic app first!
Traces in context with logs and metrics
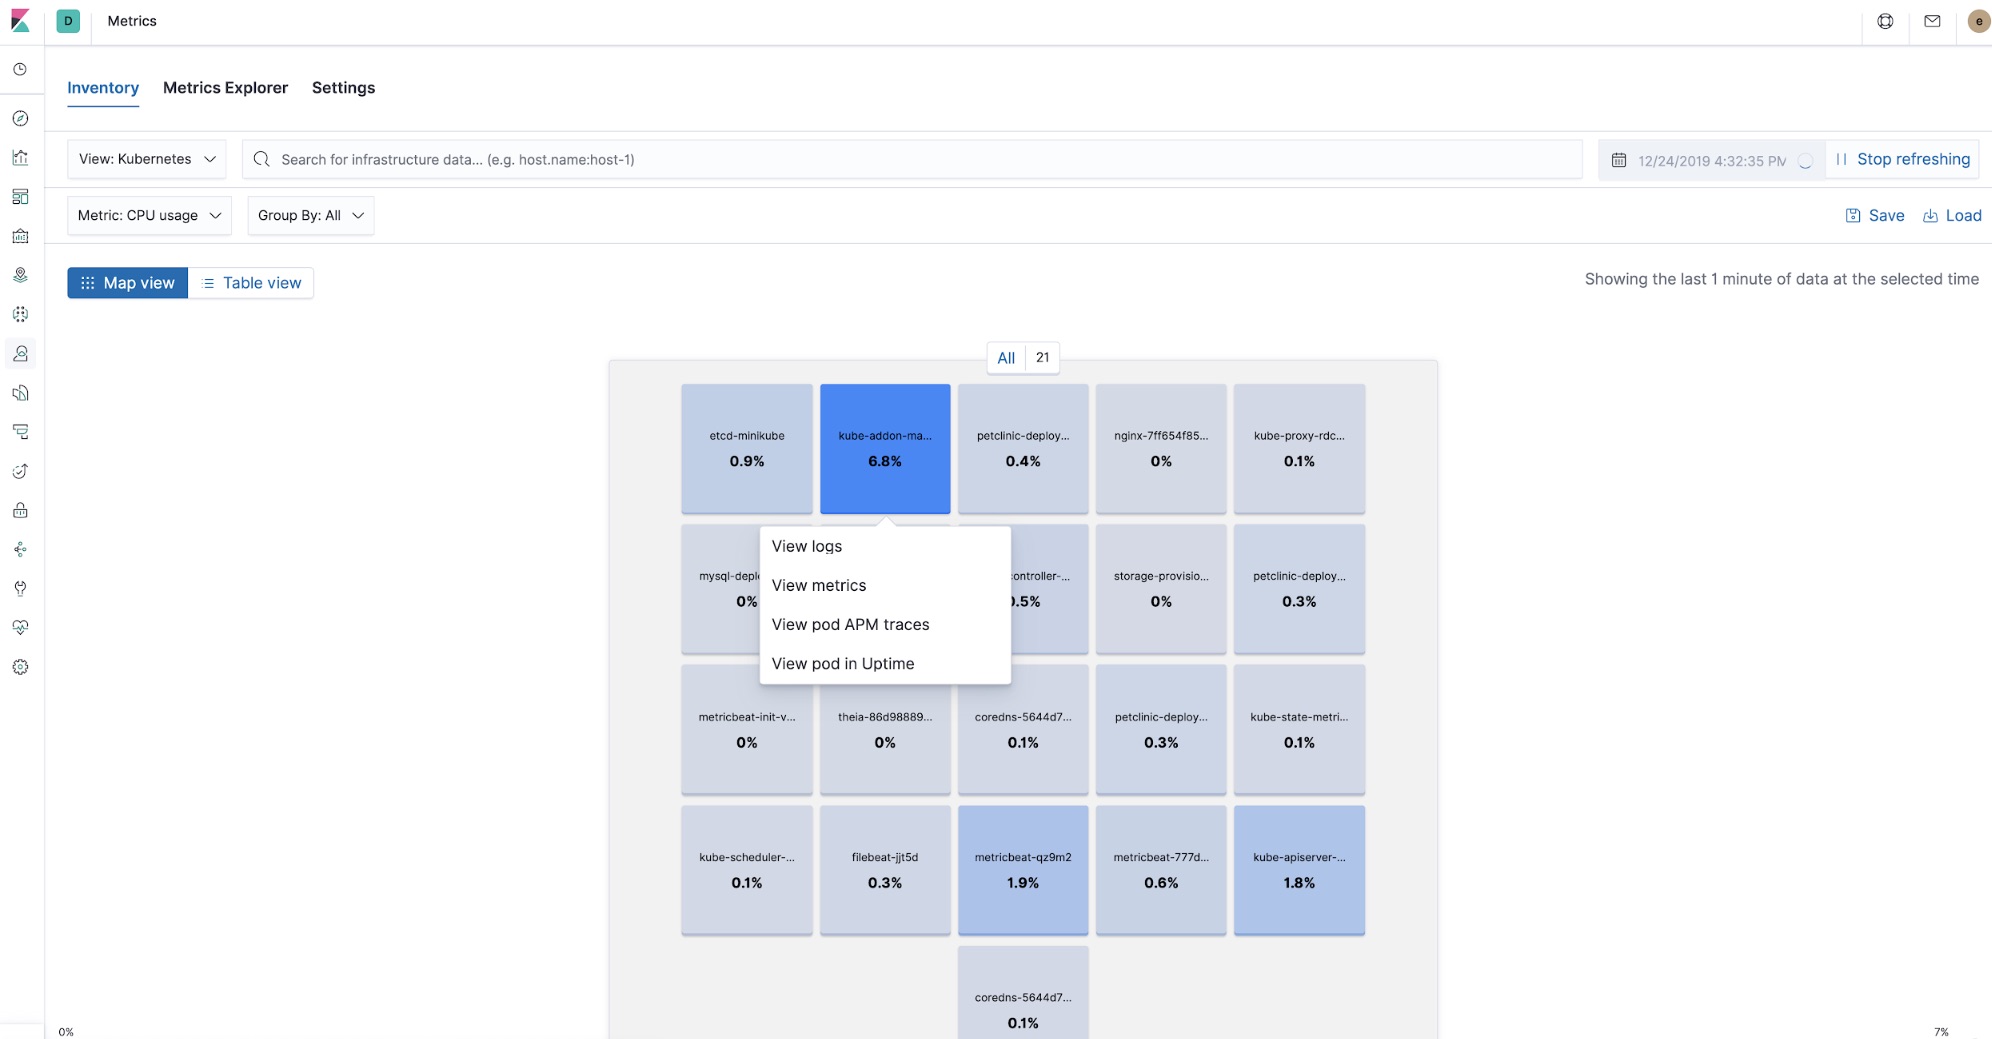
When it comes to deploying an application into Kubernetes, distributed tracing and APM continue to provide the benefit of being able to quickly triage problems while also capturing and cross-referencing other pieces of the observability puzzle: logs and metrics. With each of these pieces at your fingertips, latency spike troubleshooting can start by narrowing the scope of the investigation to a single component using APM, and can be easily linked to CPU and memory utilisation metrics and error log entries of a particular Kubernetes pod, all without leaving Kibana.
Now, thanks to processors in Beats and the metadata collected by the APM agents, all the observability data in Kibana is cross-referenced. You can start looking at APM traces, check out the metrics of the pods that were part of processing that trace, and look into the logs left behind by the components that run at the time when the trace was processed, all in the same place.
Elastic APM agents deployment
APM agents are co-deployed with the application components they monitor. With Kubernetes, the application components are made part of the code that is running in the pods. In this tutorial, we are using two agents: the APM Real User Monitoring (RUM) JavaScript Agent and the APM Java Agent.
Elastic APM Java Agent
This is the initialisation part of the APM Java Agent in petclinic pod deployment descriptor $HOME/k8s-o11y-workshop/petclinic/petclinic.yml:
          env:
          - name: ELASTIC_APM_SERVER_URLS
            valueFrom:
              secretKeyRef:
                name: apm-secret
                key: apm-url
          - name: ELASTIC_APM_SECRET_TOKEN
            valueFrom:
              secretKeyRef:
                name: apm-secret
                key: apm-token
          - name: ELASTIC_APM_SERVICE_NAME
            value: spring-petclinic-monolith
          - name: ELASTIC_APM_APPLICATION_PACKAGES
            value: org.springframework.samples
The APM agent is included as a dependency in the pom.xml file of the petclinic application $HOME/k8s-o11y-workshop/docker/petclinic/pom.xml:
<!-- Elastic APM dependencies -->
        <dependency>
            <groupId>co.elastic.apm</groupId>
            <artifactId>apm-agent-attach</artifactId>
            <version>${elastic-apm.version}</version>
        </dependency>
        <dependency>
            <groupId>co.elastic.apm</groupId>
            <artifactId>apm-agent-api</artifactId>
            <version>${elastic-apm.version}</version>
        </dependency>
        <dependency>
            <groupId>co.elastic.apm</groupId>
            <artifactId>elastic-apm-agent</artifactId>
            <version>${elastic-apm.version}</version>
        </dependency>
        <!-- End of Elastic APM dependencies -->
This way of deploying bakes in the Java Agent as a Maven dependency. There are other ways of deploying the APM agents, such as runtime attachment with Java Agent. Please refer to the Elastic APM Java Agent documentation for details.
Elastic APM Real User Monitoring (RUM) Agent
The RUM Agent runs as part of the user browser application and provides all the user-facing metrics straight from the browser. In this tutorial, it is used for exactly that, as well as the starting point for distributed traces. This is where the APM agent is instantiated in the Javascript user side code $HOME/k8s-o11y-workshop/docker/petclinic/src/main/resources/templates/fragments/layout.html:
 <script th:inline="javascript">
...
    var serverUrl = [[${apmServer}]];
    elasticApm.init({
     serviceName: 'petclinic-frontend',
     serverUrl: serverUrl,
     distributedTracingOrigins: [],
     pageLoadTransactionName: pageName,
     active: true,
     pageLoadTraceId: [[${transaction.traceId}]],
     pageLoadSpanId: [[${transaction.ensureParentId()}]],
     pageLoadSampled: [[${transaction.sampled}]],
     distributedTracing: true,
    })
...
 </script>
Petclinic is a server-side rendered application, Thymeleaf is a template rendering framework used with Spring Boot, and as such, it populates some of the values sent to the front end, in the controller’s Java code. Here is an example how the transaction model attribute is being populated in $HOME/k8s-o11y-workshop/docker/petclinic/src/main/java/org/springframework/samples/petclinic/owner/OwnerController.java:
    @ModelAttribute("transaction")
    public Transaction transaction() {
        return ElasticApm.currentTransaction();
    }
Monitoring errors
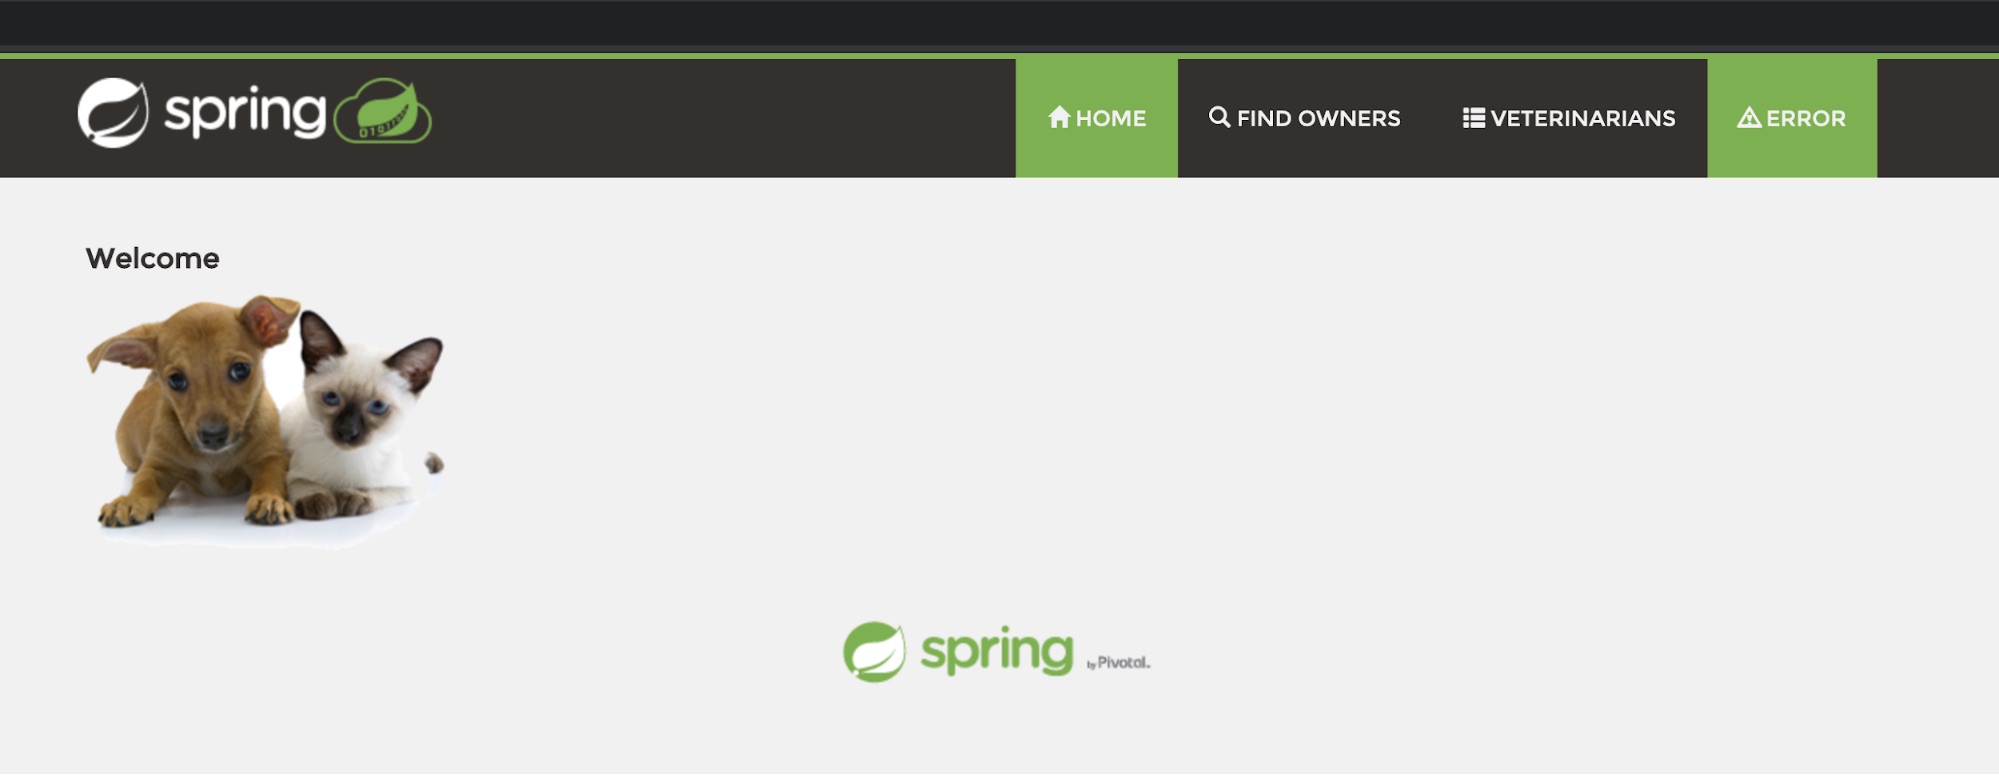
APM agents also capture unhandled exceptions. Try clicking at the “ERROR” menu and check the APM app in Kibana for the thrown exception details.
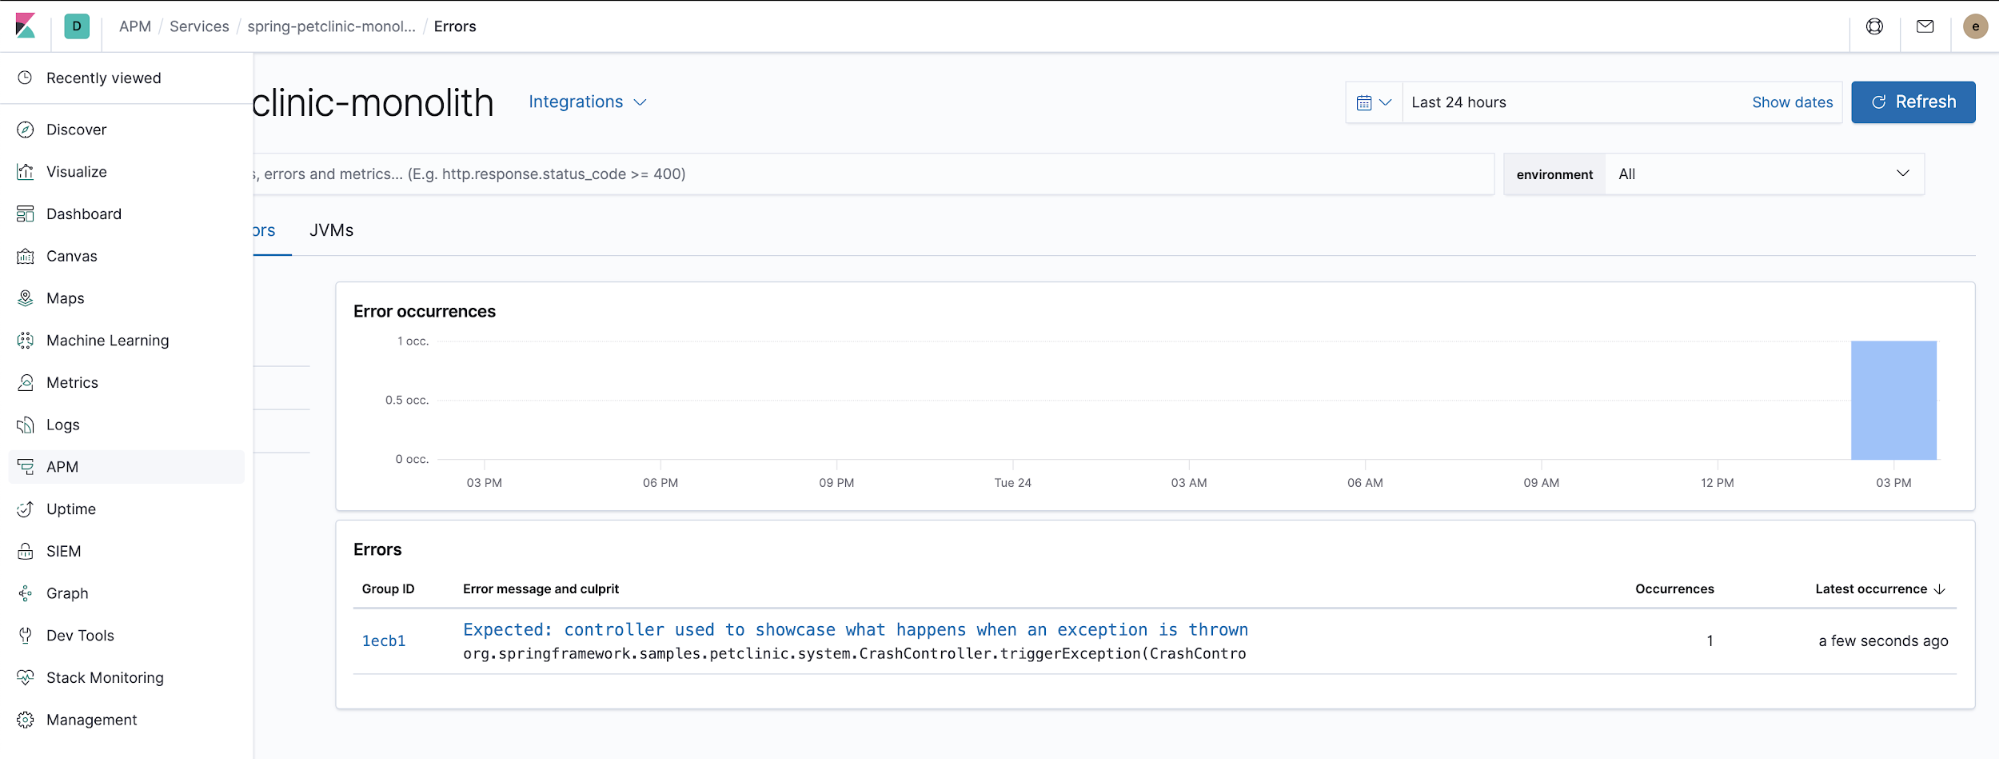
This is the Java code responsible for how the APM agent catches unhandled exceptions thrown by the application. $HOME/k8s-o11y-workshop/docker/petclinic/src/main/java/org/springframework/samples/petclinic/system/CrashController.java:
    @GetMapping("/oups")
    public String triggerException() {
        throw new RuntimeException("Expected: controller used to showcase what "
                + "happens when an exception is thrown");
    }
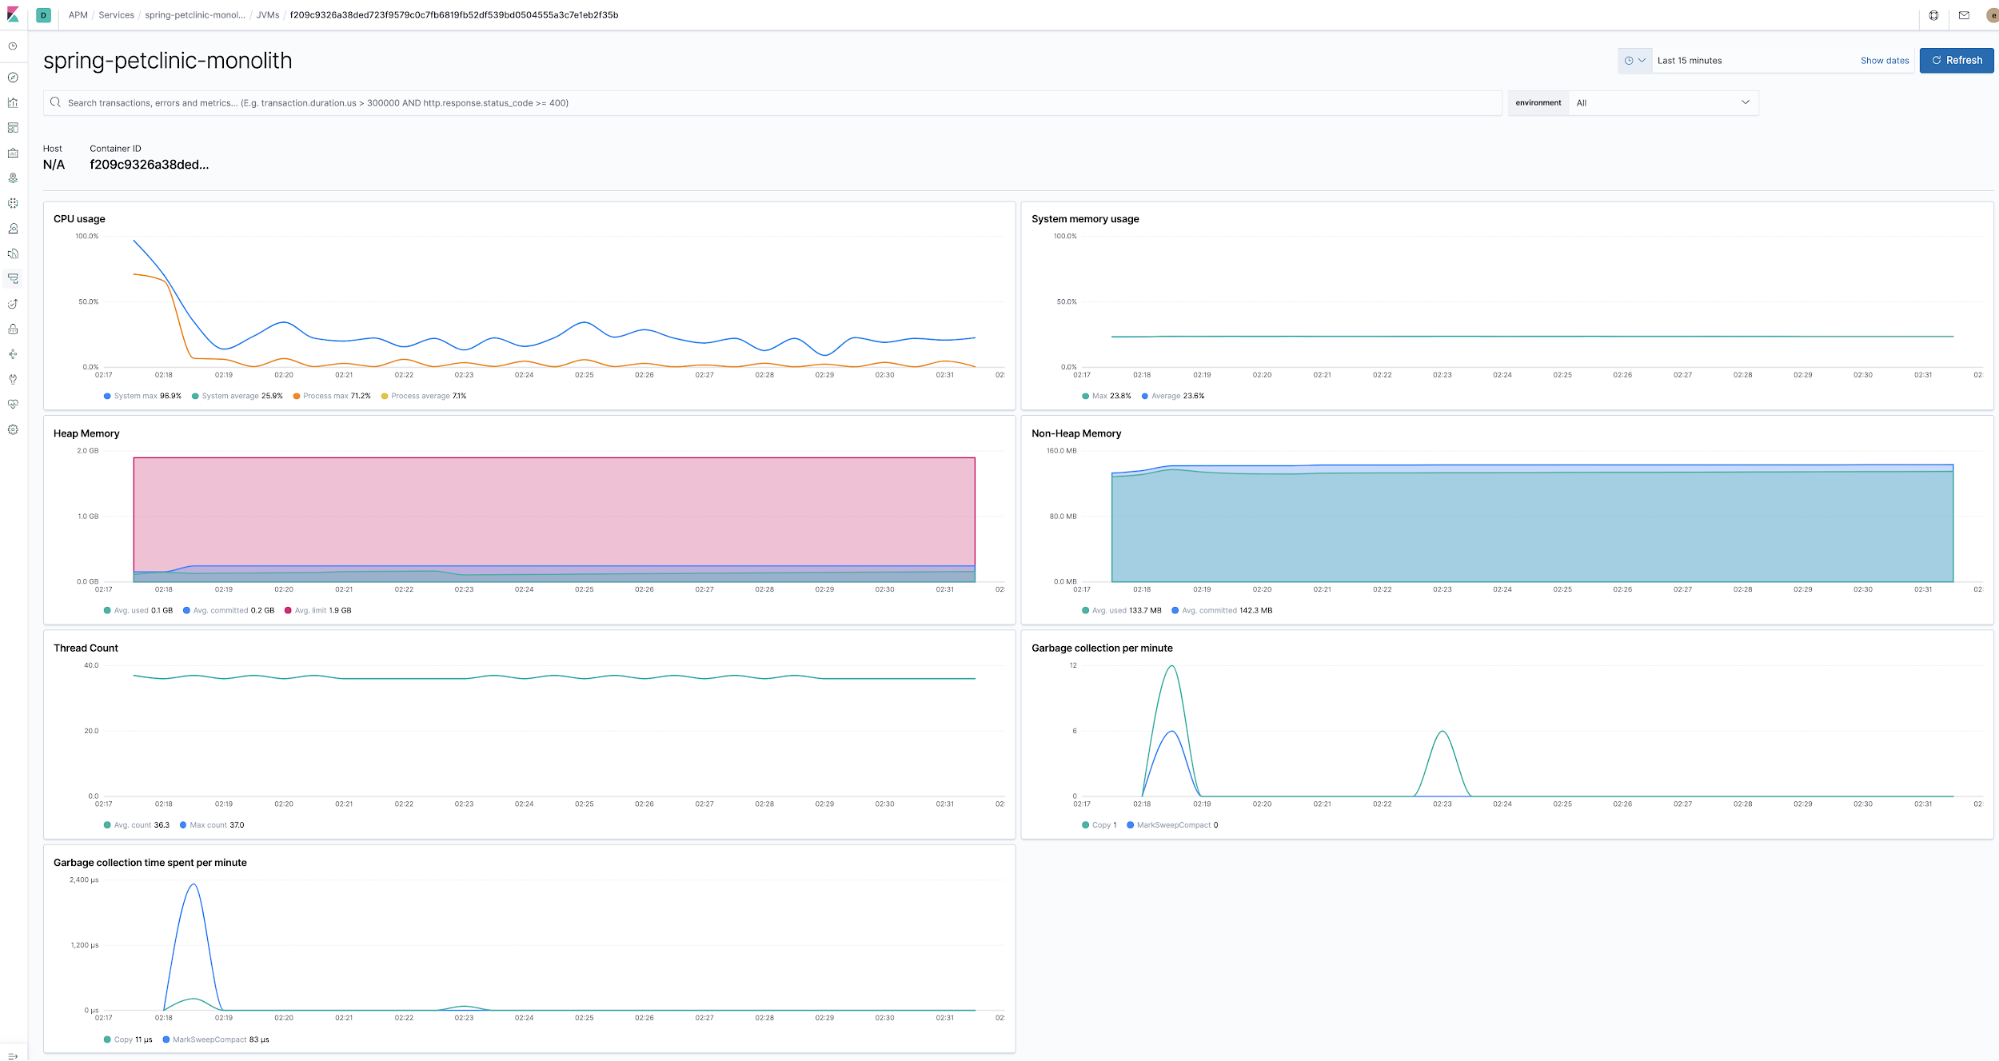
Monitoring runtime metrics
Agents are co-deployed with the application components in the runtime and collecting runtime metrics. For example, the Java Agent collects these out of the box without any need to supply any code or config, well apart from enabling metrics collection.
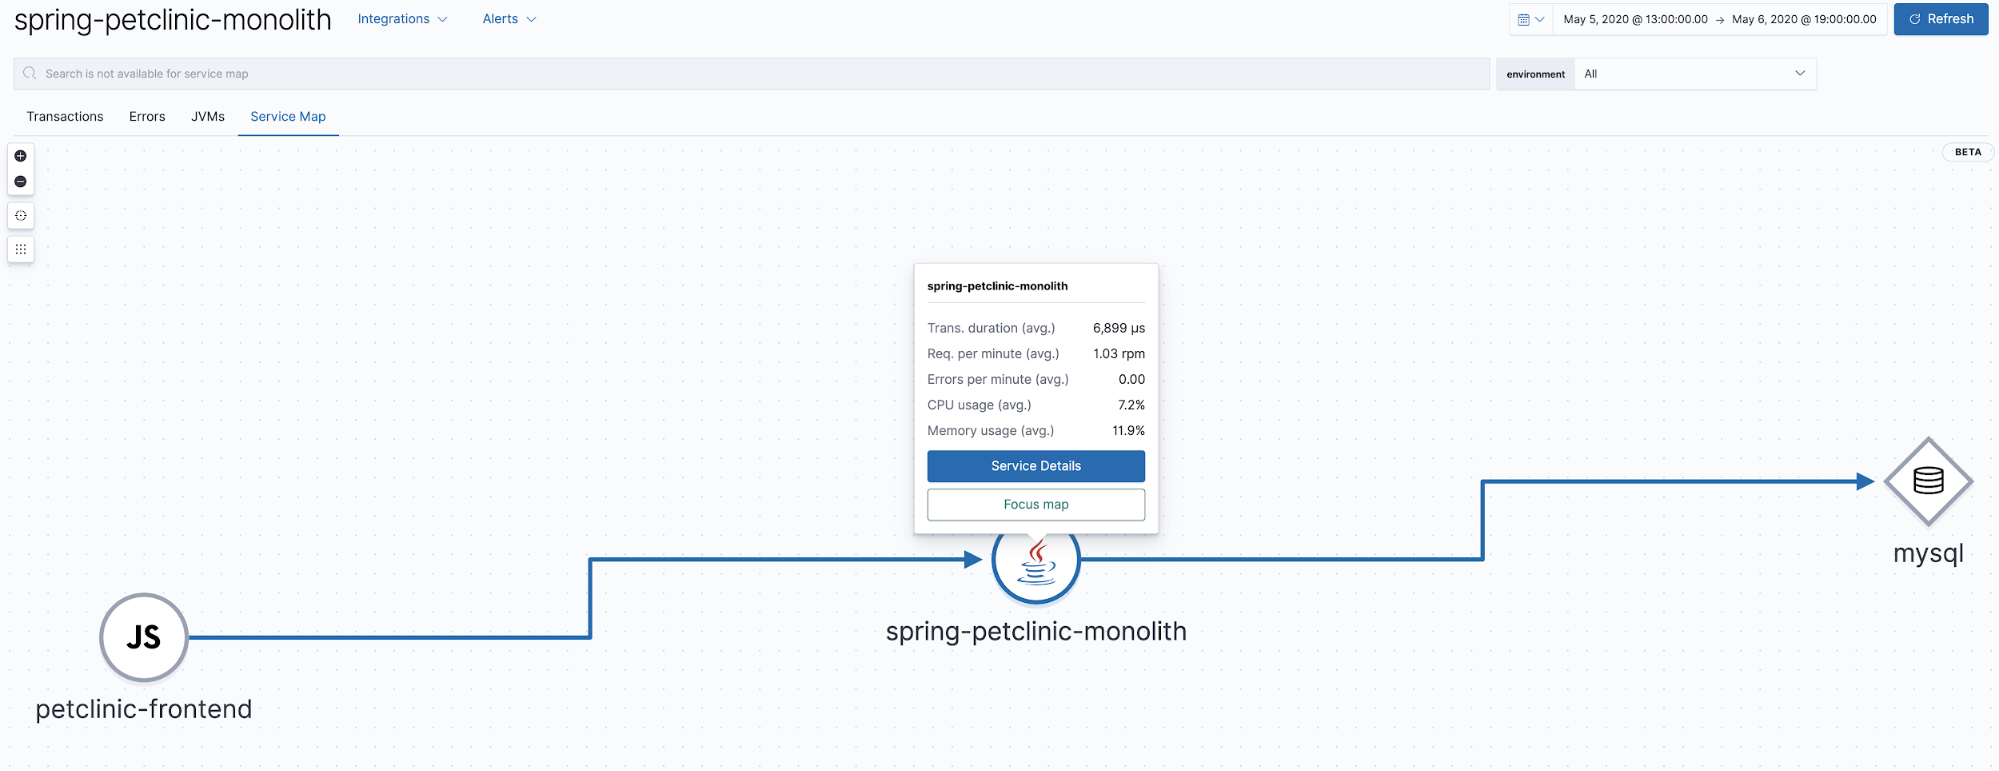
Service maps
Elastic APM 7.7 introduced the beta version of service maps, a graphic representation of relationships represented in APM traces. This view shows which components are involved in the traces displayed in the APM app. Our application is very simple, just a browser client with Java and MySQL backend, so the resulting map will be quite simple.
Collecting JMX metrics with an Elastic APM agent
The Java Agent can be configured to collect JMX metrics exposed by the application. The Petclinic component in this tutorial is configured to collect the following metrics $HOME/k8s-o11y-workshop/petclinic/petclinic.yml:
- name: ELASTIC_APM_CAPTURE_JMX_METRICS
  value: >-
   object_name[java.lang:type=GarbageCollector,name=*]
     attribute[CollectionCount:metric_name=collection_count]
     attribute[CollectionTime:metric_name=collection_time],
   object_name[java.lang:type=Memory] attribute[HeapMemoryUsage:metric_name=heap]
Visualising custom metrics with Lens
Not all metrics are represented in the APM app. As in the example above, JMX metrics are very specific to the application and therefore can’t be visualised within the APM app. Also, sometimes metrics need to be made part of other visualisations or visualised in a different way in order for them to be valuable. Kibana visualisations and dashboards can natively be used to visualise these metrics, but I want to show you a new and exciting way to do it even quicker.
Recently, Lens was introduced in Kibana as a more intuitive analyst-driven visualisation tool. This example can show how Lens can be used to visualise a custom JMX metric collected by the agent.
Lens example
To make things interesting, let’s run a scale-out command to increase the pod count of the petclinic component, so we get multiple lines per running JVM.
$ kubectl scale --replicas=3 deployment petclinic-deployment
# Validate the scale-out did what it was supposed to
$ kubectl get pods
You should see the following:
NAME                                    READY   STATUS    RESTARTS   AGE
mysql-deployment-7ffc9c5897-grnft       1/1     Running   0          37m
nginx-7ff654f859-xjqgn                  1/1     Running   0          28m
petclinic-deployment-86b666567c-5m9xb   1/1     Running   0          9s
petclinic-deployment-86b666567c-76pv7   1/1     Running   0          9s
petclinic-deployment-86b666567c-gncsw   1/1     Running   0          30m
theia-86d9888954-867kk                  1/1     Running   0          43m
Now, here comes the power of Lens:
Search bar. You know, for search
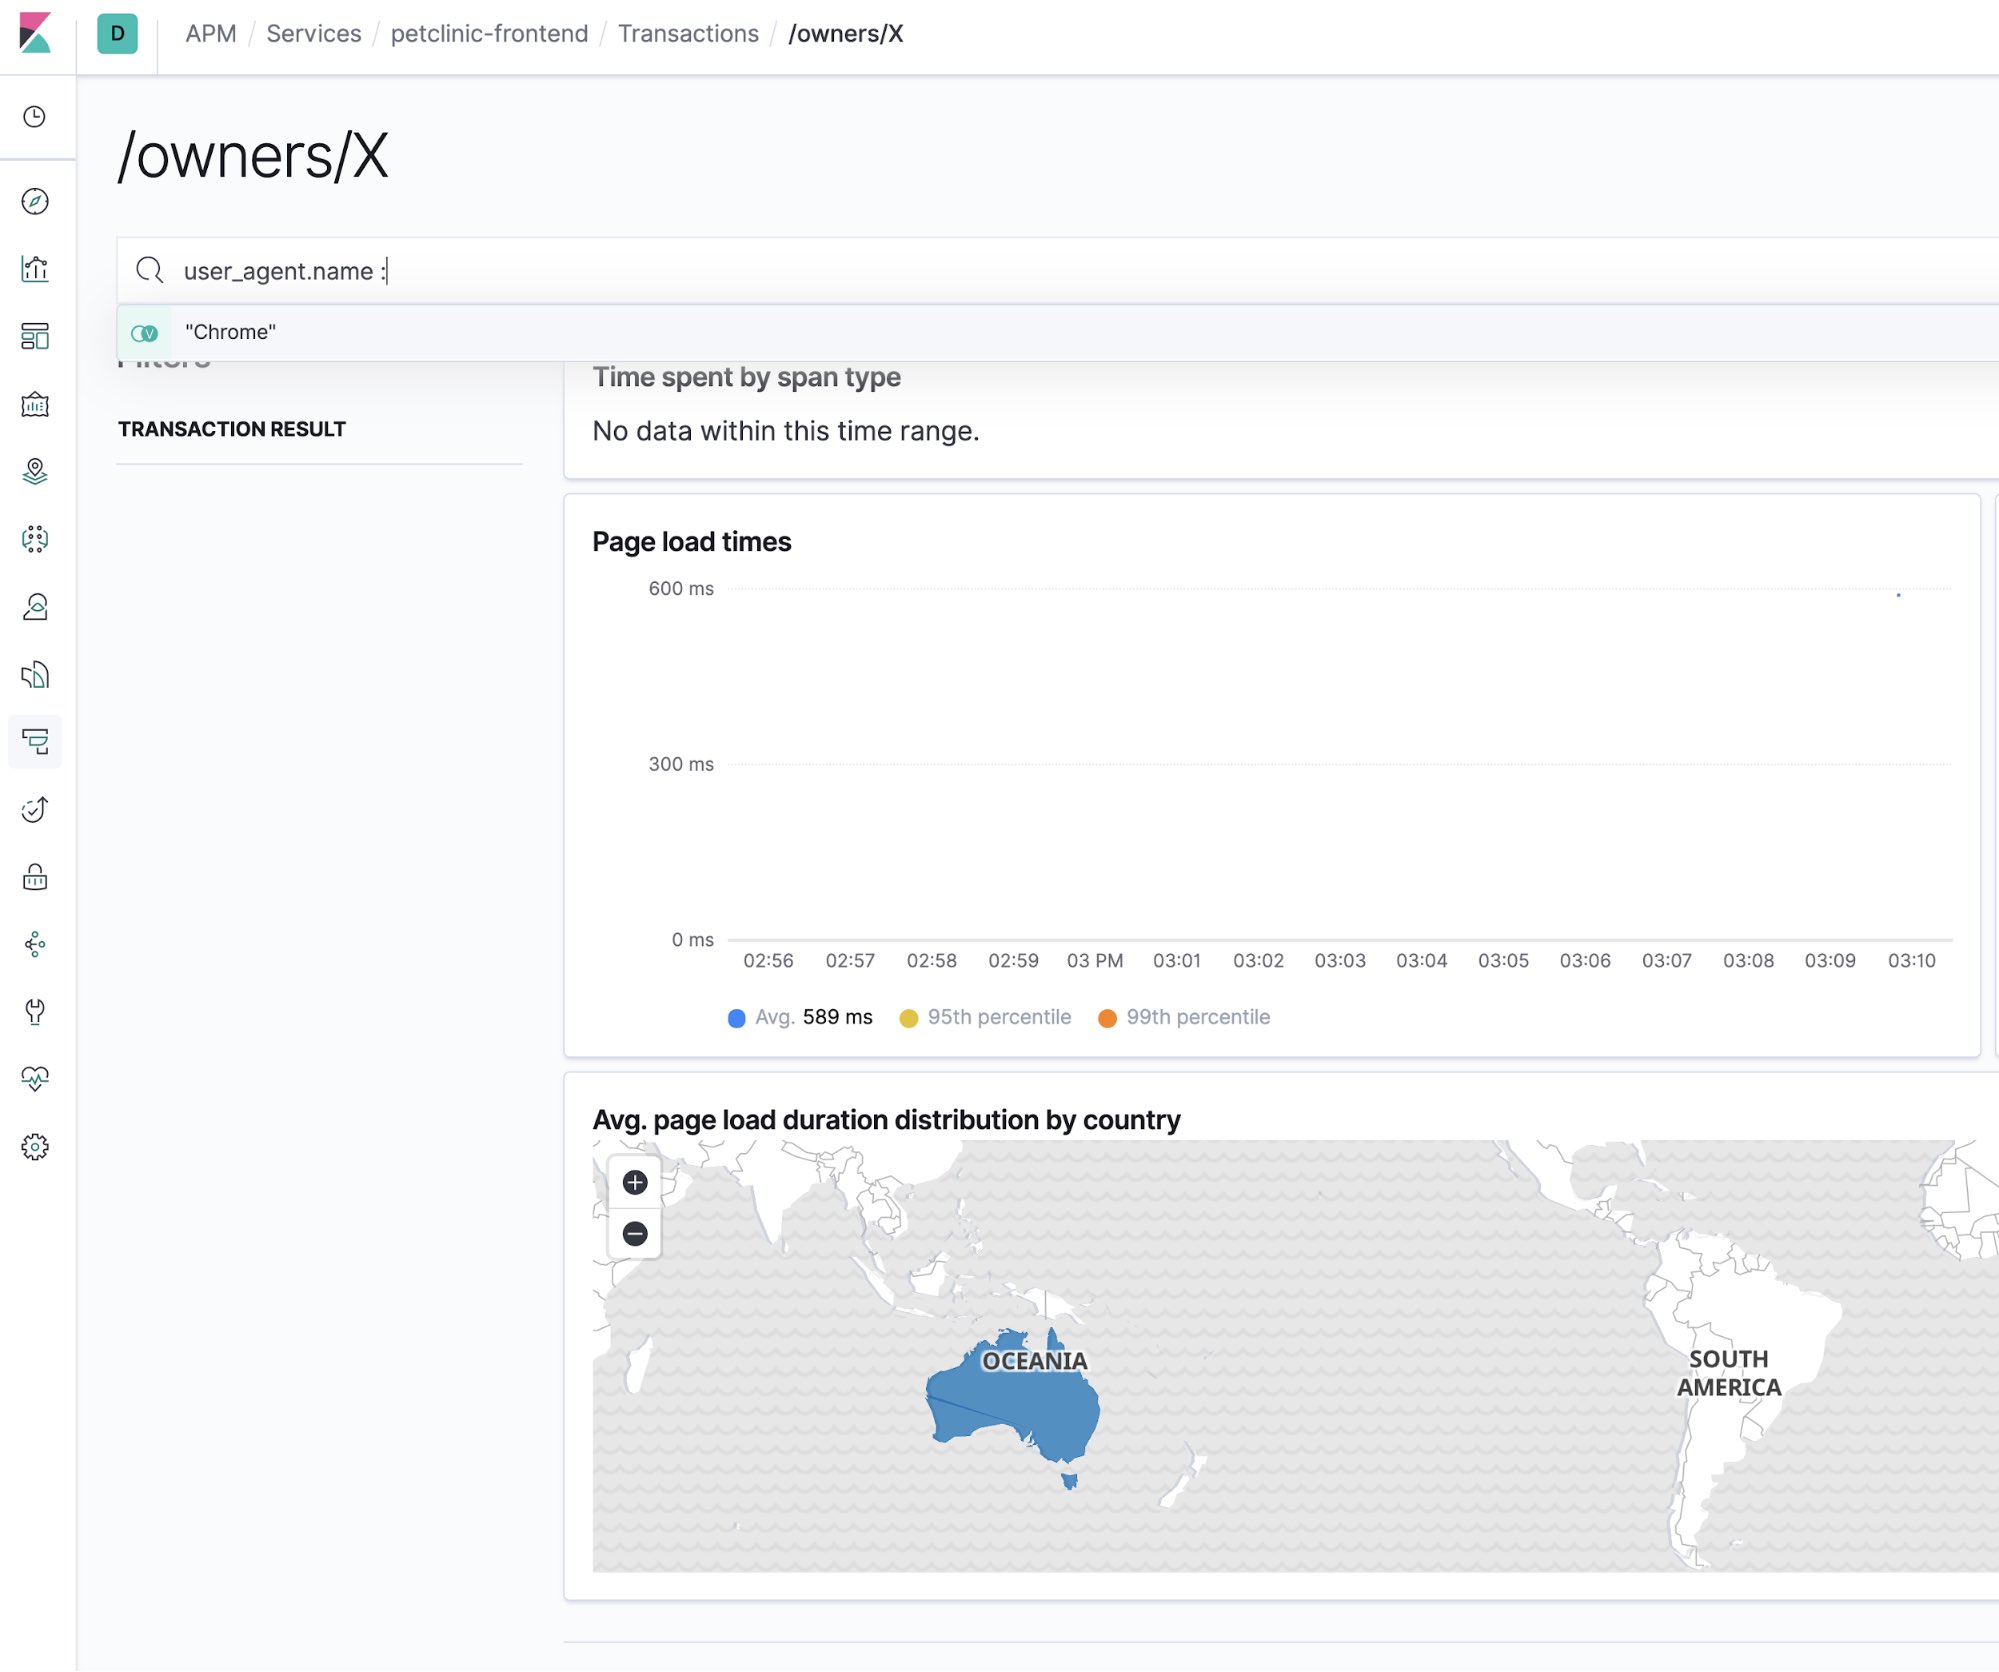
Of course, the Elastic APM app has a search bar. And it is great for searching for that needle in a haystack to narrow down the scope of the problem you are trying to assess. For example, here how APM UI view can be narrowed down to a particular browser type:
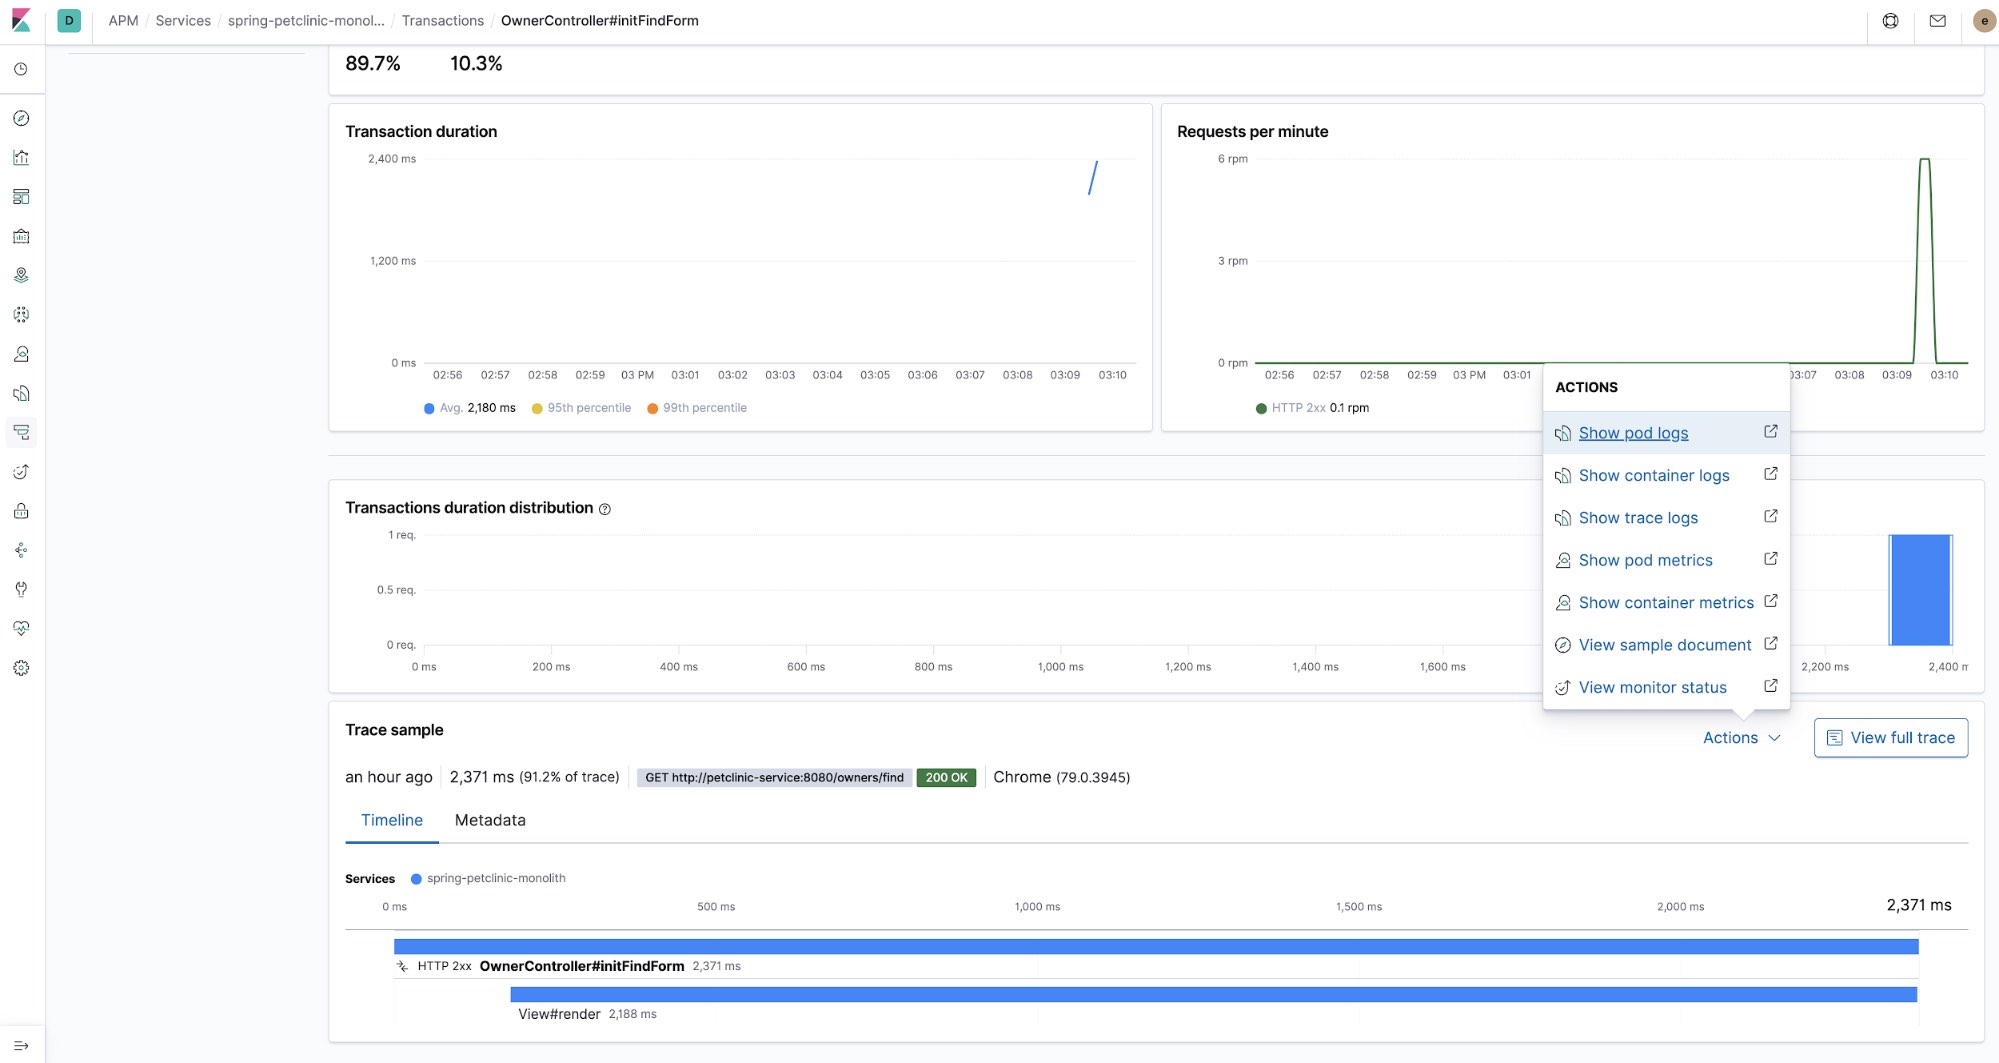
APM traces and logs correlation
Another useful example of the whole being more than its constituent parts is correlating APM traces with the log entries that were produced by the code traced. APM traces can be linked to the log entries by their trace.id<code> field. And all of it just happens without much effort, only through a few simple configurations. First, let’s see an example of such a correlation.
Let’s have a look at a trace:
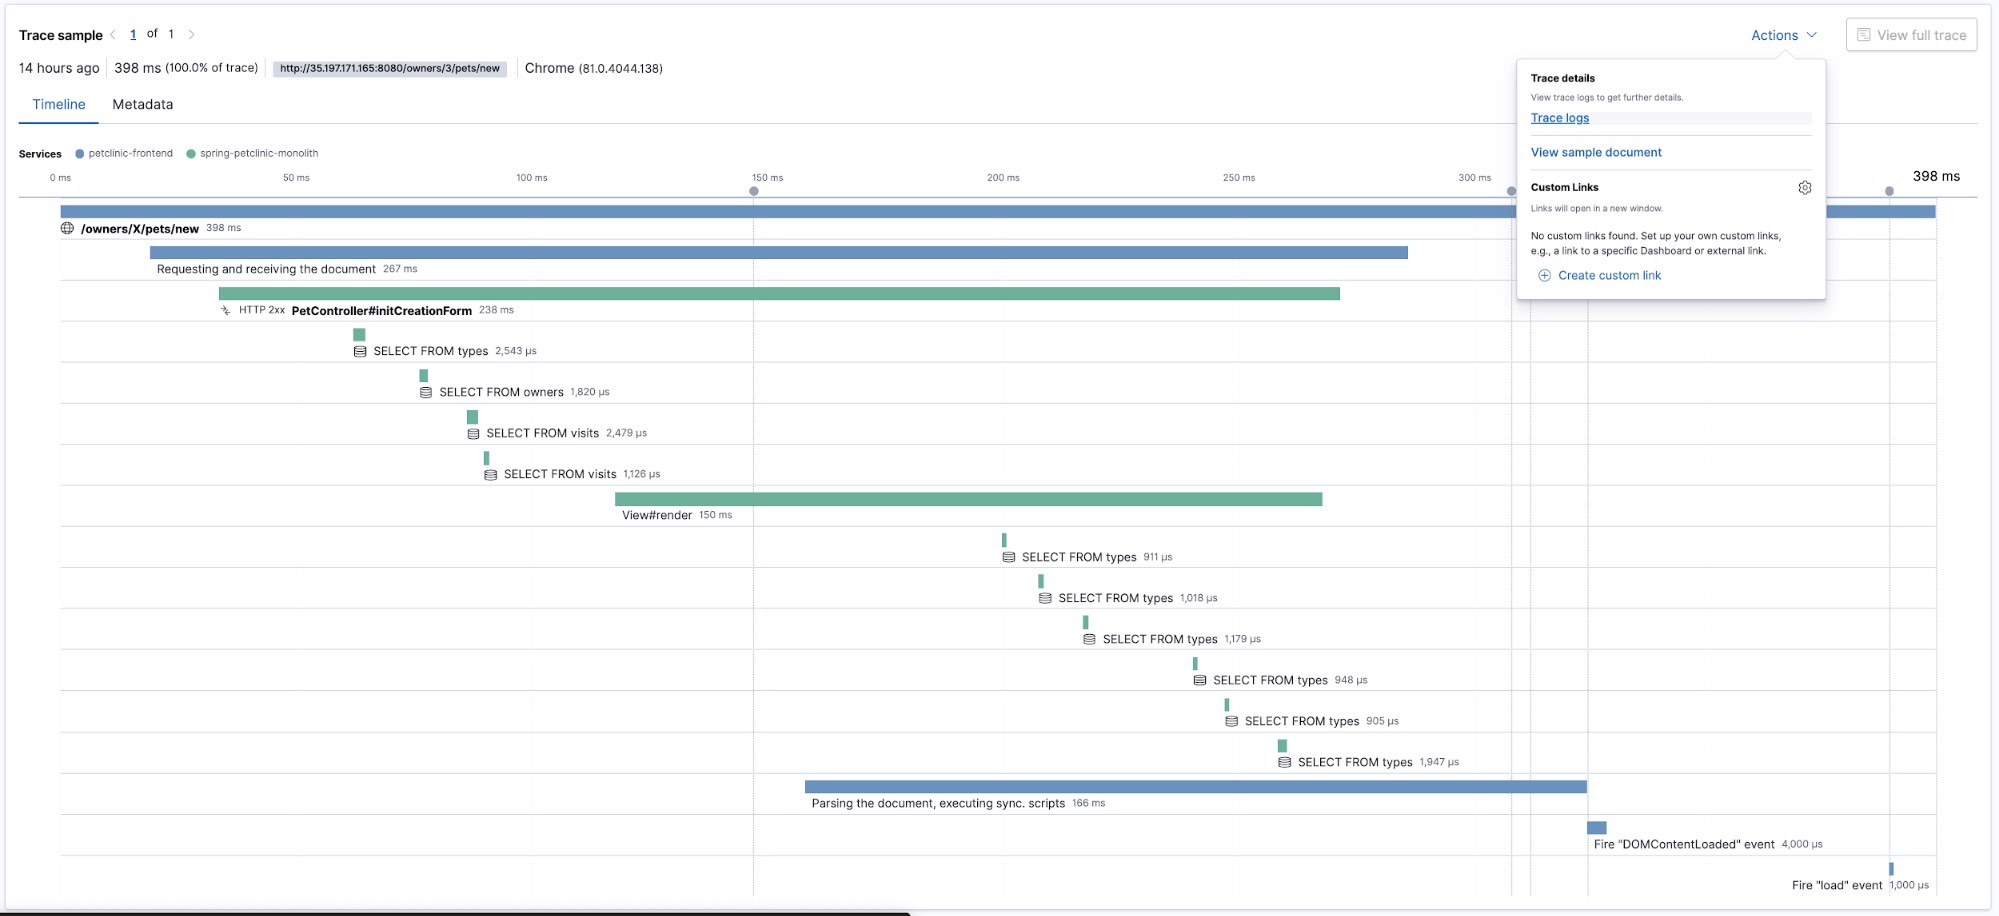
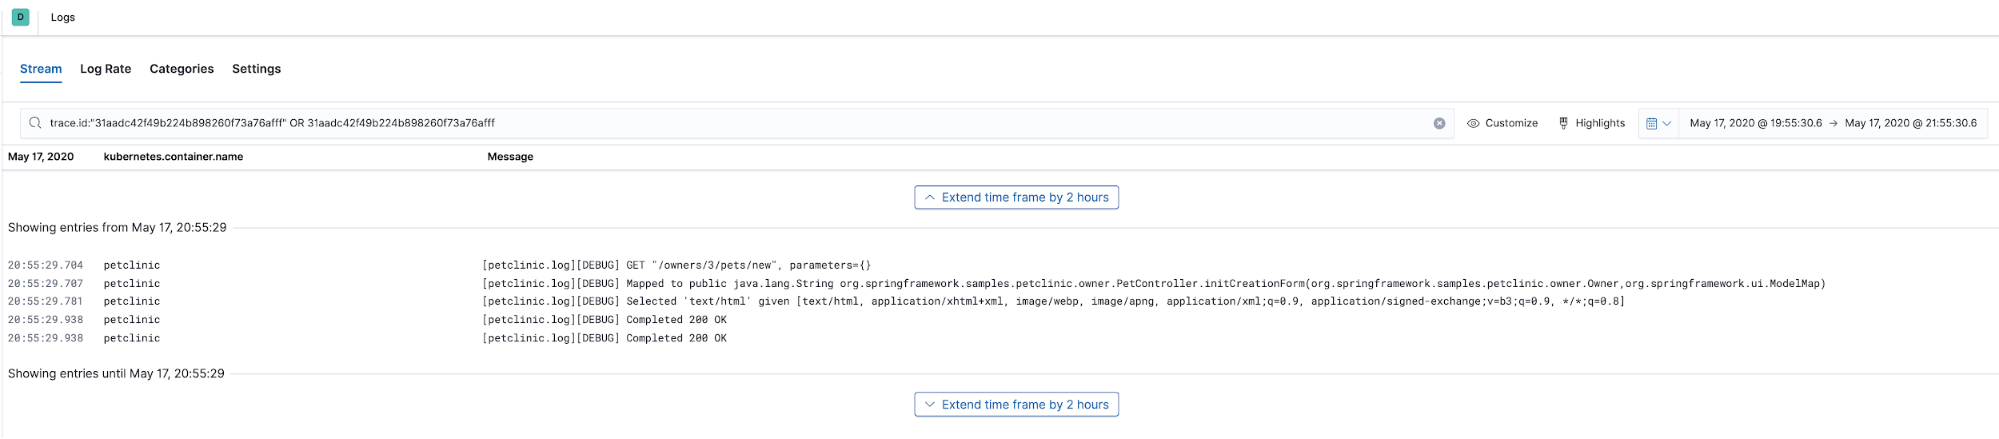
This trace shows us the timeline view of how different pieces of code were executed, now let’s see what logs were produced by the code that we just traced. We will select Trace logs from the Actions menu. It will take us to the Logs UI preselecting the time when the trace data was captured and will use the trace.id to filter for the log data annotated with the same trace.id:
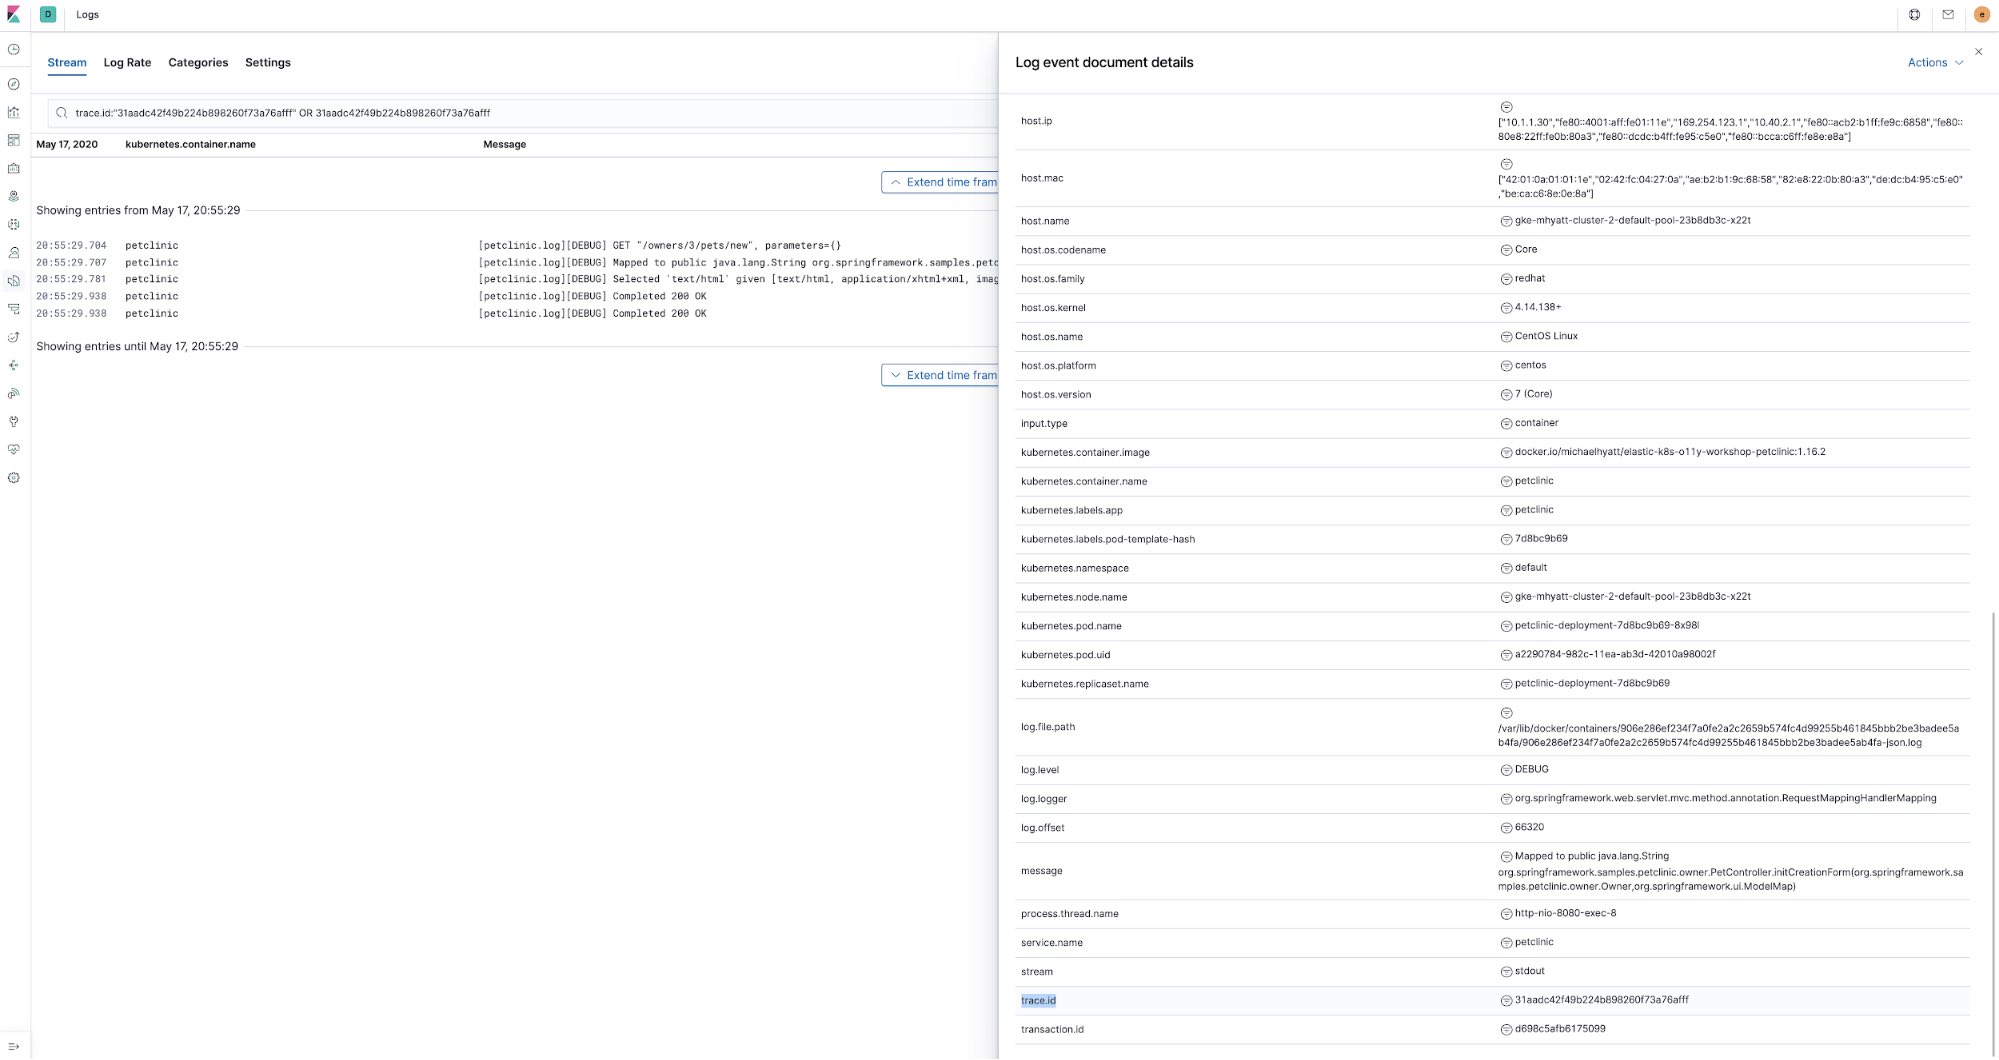
Obviously, trace.id is inherent to the APM traces, but how did we manage to enrich logs data with it? First, since we are using Elastic APM Java Agent, we used the log correlation feature it implements. In essence, it populates trace.id and transaction.id fields in the Java logging framework’s (logback in case of Spring Boot) MDC context map. All that requires is setting this environment variable in petclinic ConfigMap petclinic/petclinic.yml :
          - name: ELASTIC_APM_ENABLE_LOG_CORRELATION
            value: "true"
Then, the petclinic app logging is configured with ECS logging that enriches log entries sent to Elastic stack with additional fields corresponding to Elastic Common Schema, such as log.level, transaction.id , etc. To enable that we included the following dependency in the pom.xml of the petclinic application:
        <dependency>
            <groupId>co.elastic.logging</groupId>
            <artifactId>logback-ecs-encoder</artifactId>
            <version>${ecs-logging-java.version}</version>
        </dependency>
There is also docker/petclinic/src/main/resources/logback-spring.xml file with ECS logging configured to be written out as JSON to stdout:
    <appender name="console" class="ch.qos.logback.core.ConsoleAppender">
      <encoder class="co.elastic.logging.logback.EcsEncoder">
        <serviceName>petclinic</serviceName>
      </encoder>
    </appender>
    <root level="INFO">
        <appender-ref ref="console"/>
    </root>
Lastly, there is the annotation on petclinic ConfigMap ( petclinic/petclinic.yml ) that leverages beats autodiscovery to instruct filebeat to parse the resulting JSON coming out of petclinic:
container:
      annotations:
...
        co.elastic.logs/type: "log"
        co.elastic.logs/json.keys_under_root: "true"
        co.elastic.logs/json.overwrite_keys: "true"
So, to enable this correlation to work, we need to enable both, the Java Agent and the logging framework to log trace correlations and we can link the two pieces of observability data together.
That’s a series wrap
Logs, metrics, and APM... we did it! In this series of blogs, we looked at instrumenting an application to collect its logs, metrics and APM traces with the Elastic Stack using Filebeat, Metricbeat, and APM. The tutorial also demonstrates how to collect Kubernetes logs and metrics using the same components. There are additional components in Elastic ecosystem that can add more details to complete the observability picture of your Kubernetes environment:
- Heartbeat - A great way to measure the uptime and responsiveness of your application and the whole Kubernetes environment. It can be deployed outside of your cluster closer to where your users are. Heartbeat can illustrate how your users see your application, what kind of network and response latency they are observing, and how many errors they are exposed to.
- Packetbeat - Get the view of the internal Kubernetes cluster network traffic, TLS certificate handshakes, DNS lookups, etc.
- I have included a sample deployment of Jupyter notebook and added a sample notebook that illustrates how you can get access to the raw observability data stored in Elasticsearch, so you can data science it like a boss:
k8s-o11y-workshop/jupyter/scripts/example.ipynb
Feel free to become a contributor on the Github repo or raise a Github issue if something is not working as expected.
You can get started monitoring your systems and infrastructure today. Sign up for a free trial of Elasticsearch Service on Elastic Cloud, or download the Elastic Stack and host it yourself. Once you are up and running, monitor the availability of your hosts with Elastic Uptime, and instrument the applications running on your hosts with Elastic APM. You'll be on your way to a fully observable system, completely integrated with your new metrics cluster. If you run into any hurdles or have questions, jump over to our Discuss forums — we're here to help.