Kubernetes observability tutorial: K8s cluster setup and demo app deployment
This blog will walk you through configuring the environment you’ll be using for the Kubernetes observability tutorial blog series. If you haven’t seen Part 1: Log monitoring and analysis, please start there, as this post is supplementary to the series and is not intended as a standalone piece. Once you've taken a look at that post, come back to get your tutorial environment set up.
Step 1: Spin up a (free) Elasticsearch Service deployment
The easiest way to get the Elastic Stack up and running for this tutorial, is to spin up a 14-day free trial of our Elasticsearch Service on Elastic Cloud. A few clicks (no credit cards) and you’ll have your cluster up and running. Or if you prefer, download the Elastic Stack and install locally. All of the instructions in this tutorial can be easily amended to work with a standalone Elasticsearch cluster on your own hardware.
Step 2: Minikube single-node Kubernetes cluster setup
Now that your Elastic Stack deployment is up and running, let's get the Minikube environment going.
Preparing a Kubernetes environment
This walkthrough will set up a single node Minikube environment to run the rest of the tutorial activities, such as capturing logs, metrics, and application performance data. While there are other ways to create an environment that supports the tutorial, such as Strigo.io classes, GKE, AWS standalone hosts, this example outlines the creation of a Debian 9 host environment with screenshots taken from Google Cloud.
Note: If you have your own Kubernetes cluster running in one of the cloud environments, or your own servers, this part is not needed. Only run these steps if you don’t have your own Kubernetes cluster handy.
Initial configuration
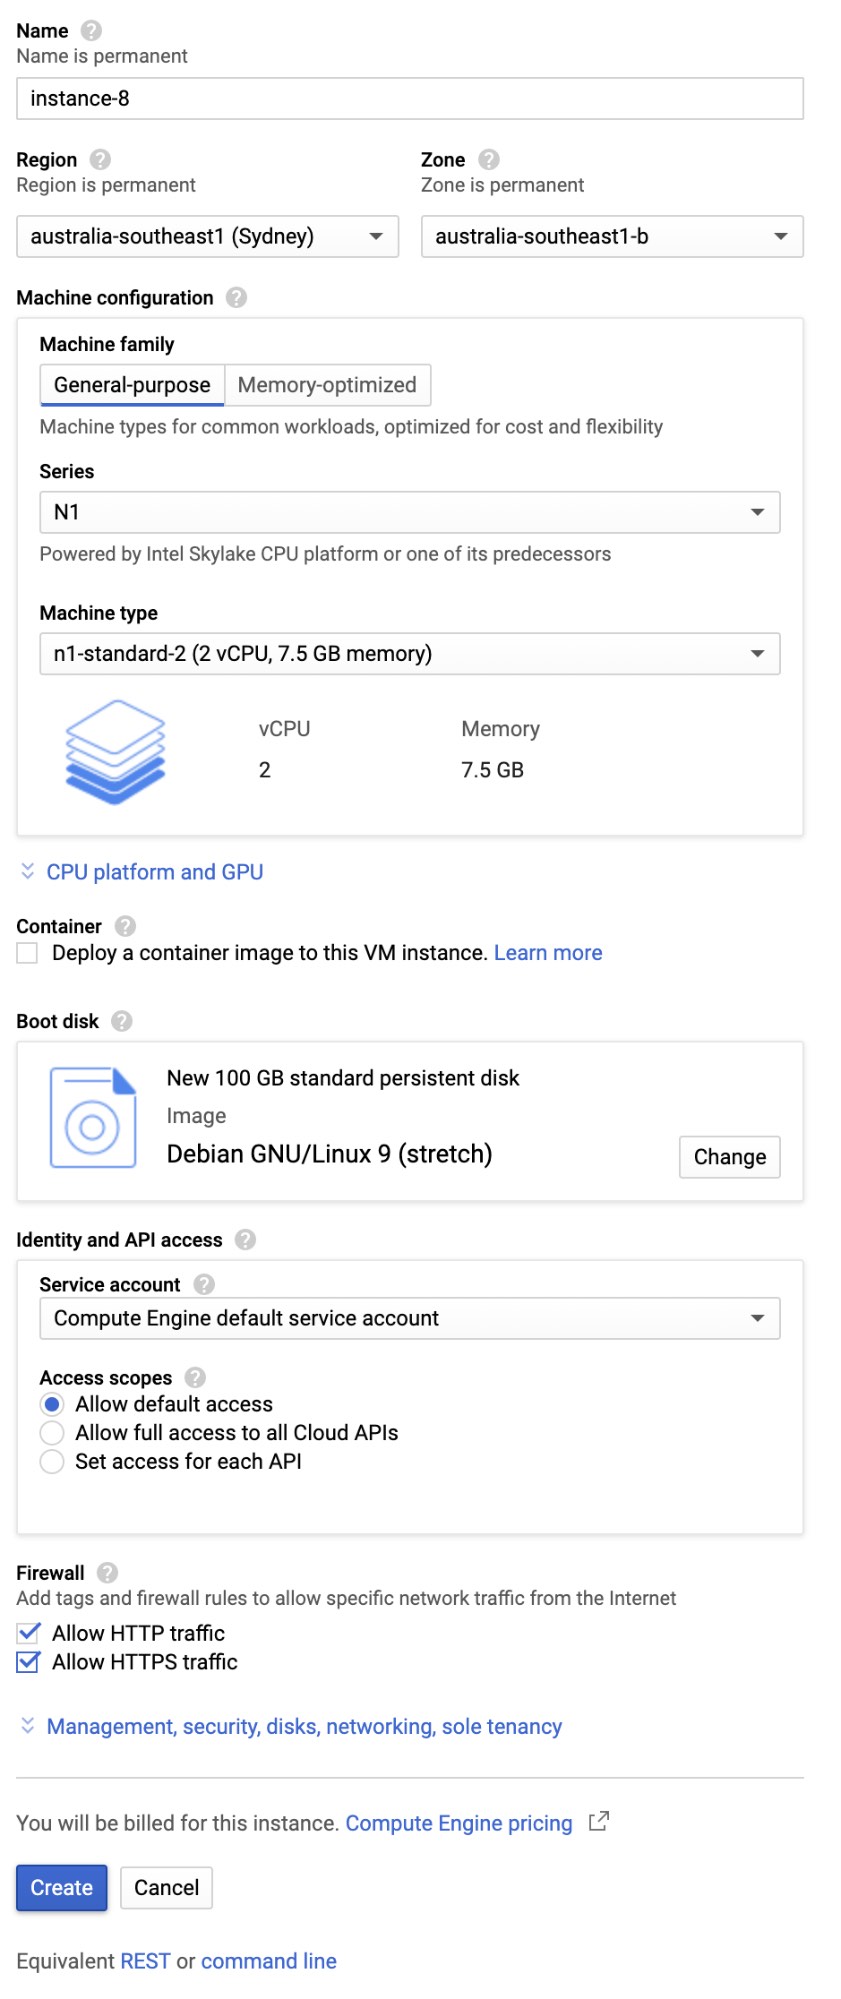
Create a Debian 9 server. Start with lower specifications and then try something larger if you need to. Here are the specifications required:
- 2 or 4 CPUs
- 8 or 16GB RAM
- 100GB disk space.
- Debian 9 Linux OS (Stretch)
- Ensure external connectivity to ports 30080-30085 on the selected servers. This may require configuring the firewall rules for the server.
Example configuration from Google Cloud:
Install prerequisite packages
The following steps will install your own Kubernetes single-node cluster on Debian 9 server. Start by runing the following command:
$ sudo apt-get install -y git tmux
Check out the code from my GitHub repo
Run the following command to clone the example code from my GitHub repo:
$ git clone https://github.com/michaelhyatt/k8s-o11y-workshop
Install the prerequisites
Run the following command to install kubectl, Minikube, and Docker:
$ cd k8s-o11y-workshop
$ ./install/install-debian9.sh
Start Minikube and Kubernetes
This command will start the Minikube environment:.
$ ./install/start_k8s.sh
Ensure the environment is up and running without errors by running the following command and seeing the services in the Running state:
$ kubectl get pods --namespace=kube-system
The output should look like this:
NAME                                 READY   STATUS    RESTARTS   AGE
coredns-5644d7b6d9-jhjlm             1/1     Running   0          106s
coredns-5644d7b6d9-npwr7             1/1     Running   0          105s
etcd-minikube                        1/1     Running   0          55s
kube-addon-manager-minikube          1/1     Running   0          43s
kube-apiserver-minikube              1/1     Running   0          57s
kube-controller-manager-minikube     1/1     Running   0          47s
kube-proxy-fm476                     1/1     Running   0          105s
kube-scheduler-minikube              1/1     Running   0          50s
kube-state-metrics-57cd6fdf9-gfgl8   1/1     Running   0          102s
storage-provisioner                  1/1     Running   0          101s
Your Minikube single-node Kubernetes cluster is now up and running.
Step 3: Deploying the demo application
Now that you have your Kubernetes cluster up and running, let’s deploy the demo application.
Create and update the connection details and secrets
Validate that Theia editor is up and running. You can also use other editors like vim and nano to edit install/create_secrets.sh file.
$ kubectl get pods
The output should look like this:
NAME                     READY   STATUS    RESTARTS   AGE
theia-86d9888954-npk7l   1/1     Running   0          74s
Ensure you have recorded the following details from your Elastic Cloud cluster setup:
- cloud_id - should be in the form of “<cluster-name>:<very-long-string>”
- cloud_auth - should be in the form “elastic:<Password>”
- apm_url - the URL for the APM server starting with https://
- apm_token - a secret token to connect to the APM server.
These details will be used to create Kubernetes secrets that connect the components running on this server with the Elastic Cloud cluster.
Find the public IP address of the server and open a browser window at http://<ip-address>:30083
In the editor, open install/create_secrets.sh, file and update the four details, as per the above. Save the file at the end.
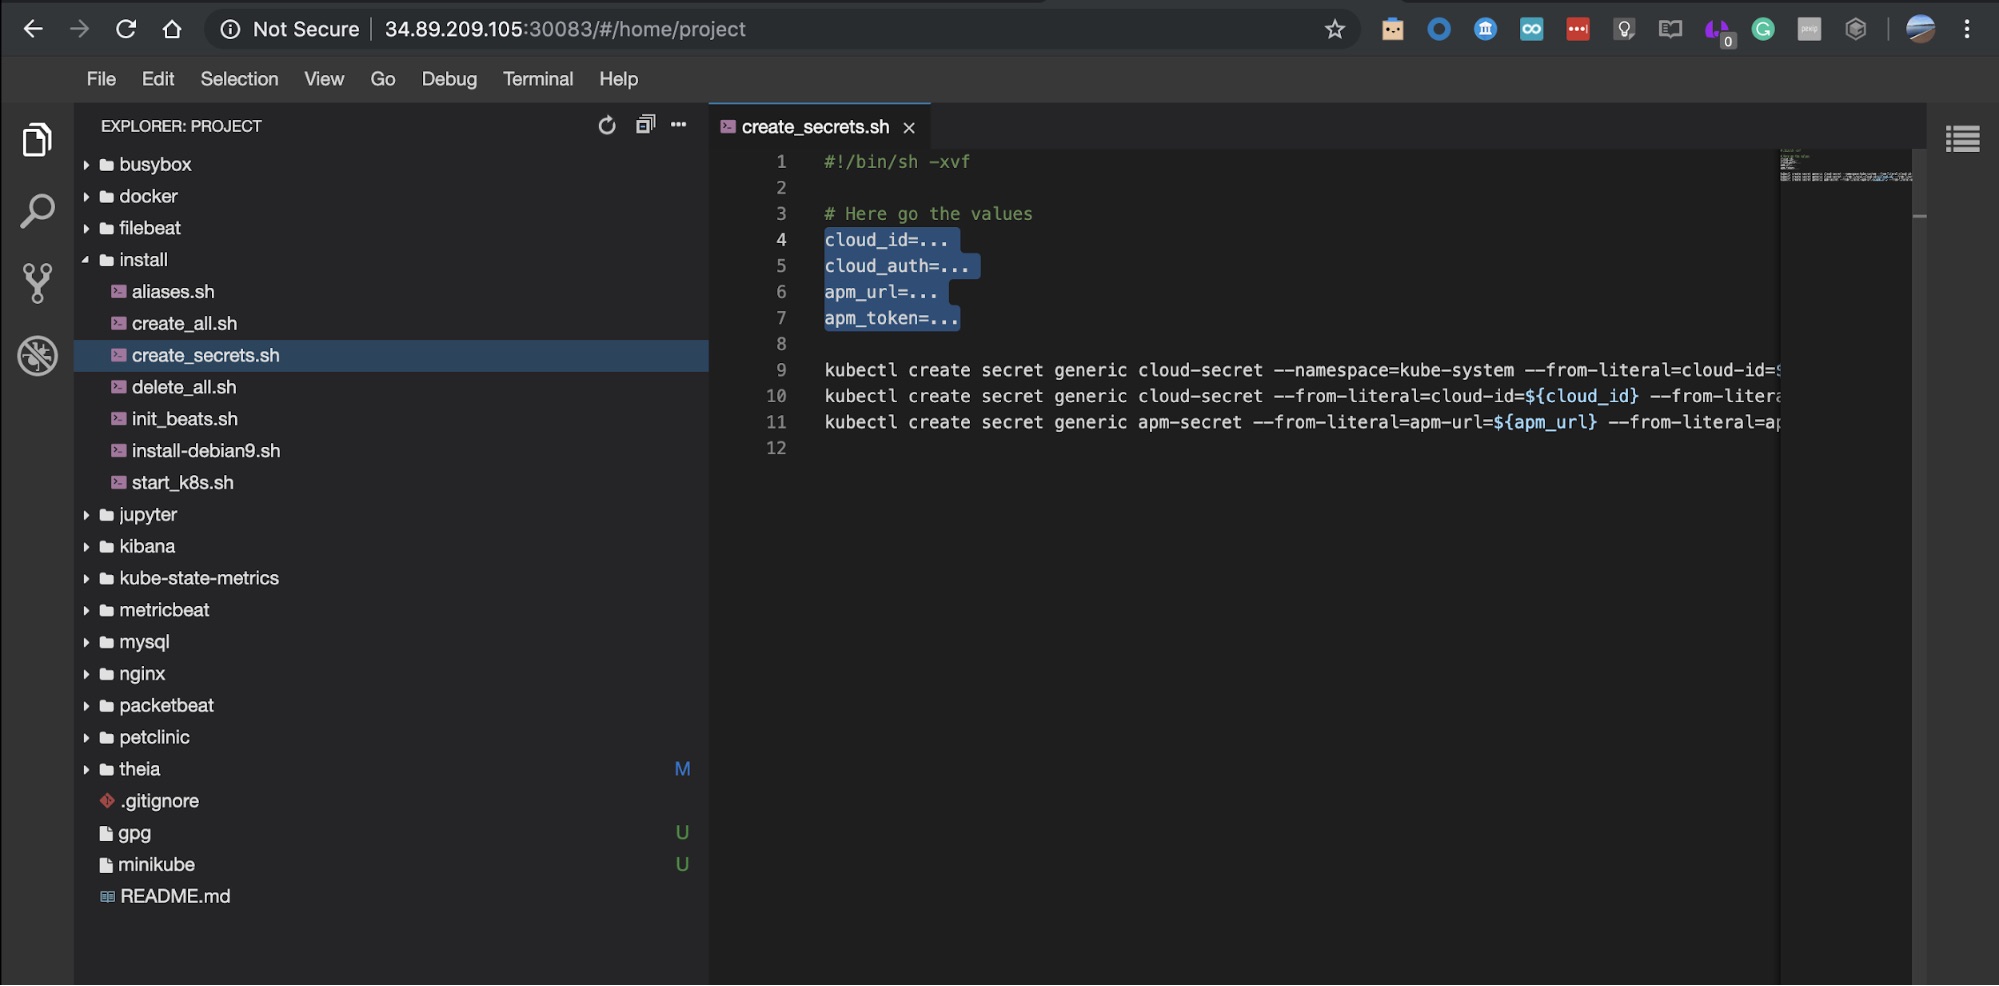
Create the secrets by running this command in the terminal window:
$ ./install/create_secrets.sh
Run Beats setup
The Elastic Stack offers various Beats to ship data to Elasticsearch. To tail k8s log files, we’re going to use Filebeat. To collect various metrics from application and system pods including Kubernetes itself, we are going to use Metricbeat.
Beats setup requires you to create all the artifacts related to data ingest: ingest pipelines, index templates, and out-of-the-box Kibana visualisations. One command run once will take care of all the above and it only needs to run once per Beat deployed into Kubernetes cluster.
To run the Metricbeat and Filebeat setup jobs, run the following setup commands:
$ kubectl create -f $HOME/k8s-o11y-workshop/filebeat/filebeat-setup.yml
$ kubectl create -f $HOME/k8s-o11y-workshop/metricbeat/metricbeat-setup.yml
Then, simply wait for the job to complete by observing the status change from ContainerCreation to Running, and finally to Completed with the following kubectl command:
$ kubectl get pods --namespace=kube-system
The resulting pods status should be similar to this:
NAME                                 READY   STATUS      RESTARTS   AGE
coredns-5644d7b6d9-jhjlm             1/1     Running     0          2d
coredns-5644d7b6d9-npwr7             1/1     Running     0          2d
etcd-minikube                        1/1     Running     0          2d
filebeat-init-nkghj                  0/1     Completed   0          2m
kube-addon-manager-minikube          1/1     Running     0          2d
kube-apiserver-minikube              1/1     Running     0          2d
kube-controller-manager-minikube     1/1     Running     0          2d
kube-proxy-fm476                     1/1     Running     0          2d
kube-scheduler-minikube              1/1     Running     0          2d
kube-state-metrics-57cd6fdf9-gfgl8   1/1     Running     0          2d
storage-provisioner                  1/1     Running     0          2d
metricbeat-init-gm6wj                0/1     Completed   0          2m
Just in case you forgot to create secrets...
The most common reason for errors at this stage will be incorrect Elastic Cloud credentials. Only if you see errors denoting that it is unable to connect to the cloud cluster, proceed with the following steps.
- Verify the four cloud and APM values again, as per the previous section.
- Delete the credentials and Beats setup jobs, as following:
$ kubectl delete secret cloud-secret --namespace=kube-system
$ kubectl delete secret cloud-secret
$ kubectl delete secret apm-secret - Update the credentials in Theia web editor, as per the section above, or through vim/nano editors.
- Recreate the secrets by running the command again:
$ ./install/create_secrets.sh
- Retry Beats setup commands.
Deploy your Beats
To deploy Filebeat and Metricbeat run the following two commands:
$ kubectl create -f $HOME/k8s-o11y-workshop/filebeat/filebeat.yml
$ kubectl create -f $HOME/k8s-o11y-workshop/metricbeat/metricbeat.yml
To validate the Beats are running, run the following command:
$ kubectl get pods --namespace=kube-system
There should be three additional Kubernetes pods running, one for Filebeat and two for Metricbeat:
NAME                                 READY   STATUS      RESTARTS   AGE
coredns-5644d7b6d9-jhjlm             1/1     Running     0          2d
coredns-5644d7b6d9-npwr7             1/1     Running     0          2d
etcd-minikube                        1/1     Running     0          2d
filebeat-init-nkghj                  0/1     Completed   0          2d
filebeat-wnltr                       1/1     Running     0          4m
kube-addon-manager-minikube          1/1     Running     0          2d
kube-apiserver-minikube              1/1     Running     0          2d
kube-controller-manager-minikube     1/1     Running     0          2d
kube-proxy-fm476                     1/1     Running     0          2d
kube-scheduler-minikube              1/1     Running     0          2d
kube-state-metrics-57cd6fdf9-gfgl8   1/1     Running     0          2d
metricbeat-777d6c6c45-gzfwr          1/1     Running     0          4m
metricbeat-init-rjz4q                0/1     Completed   0          4m
metricbeat-vxbj5                     1/1     Running     0          4m
storage-provisioner                  1/1     Running     0          2d
Verify Beats are sending data to Elasticsearch
For additional verification that the Beats are successfully connecting to the Elastic Cloud cluster and sending data, open the Logs and Metrics apps in Kibana. There should be some action going on there.
Deploy the application components
Deploy MySQL:
$ kubectl create -f $HOME/k8s-o11y-workshop/mysql/mysql.yml
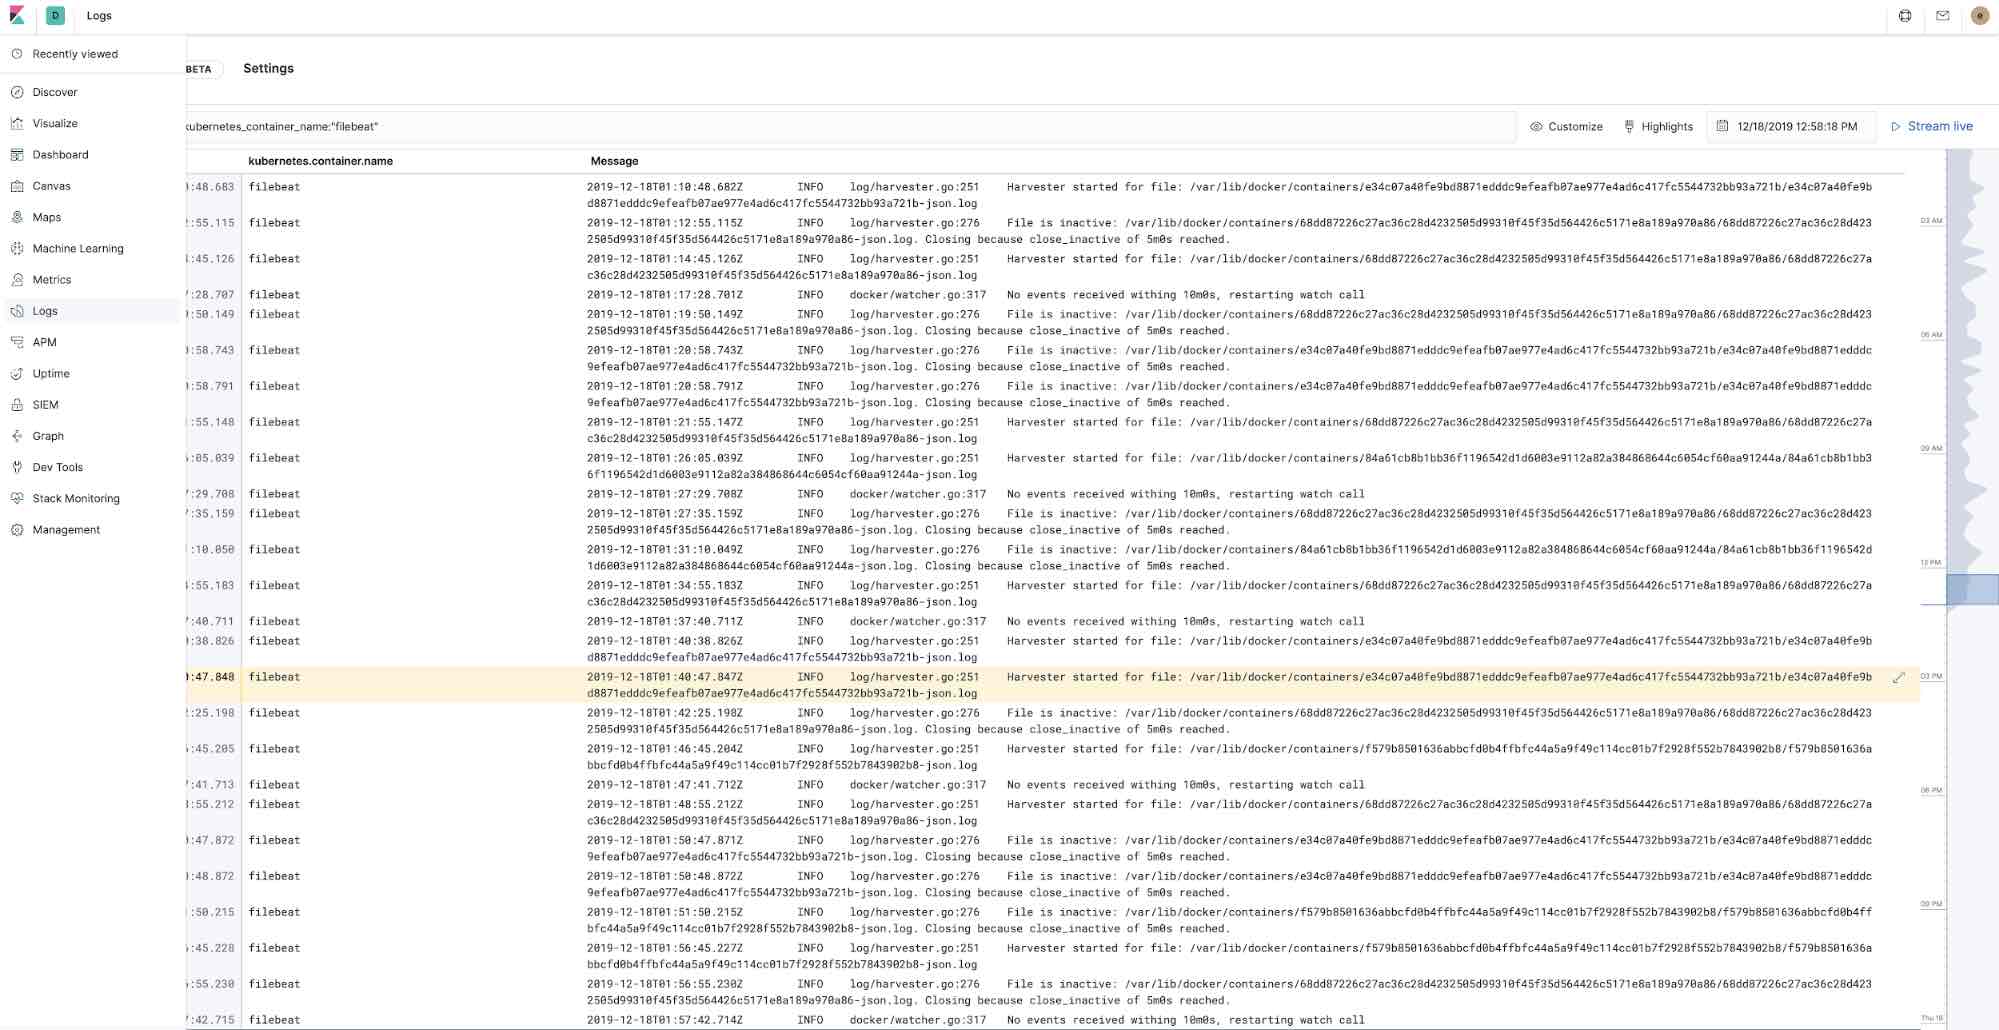
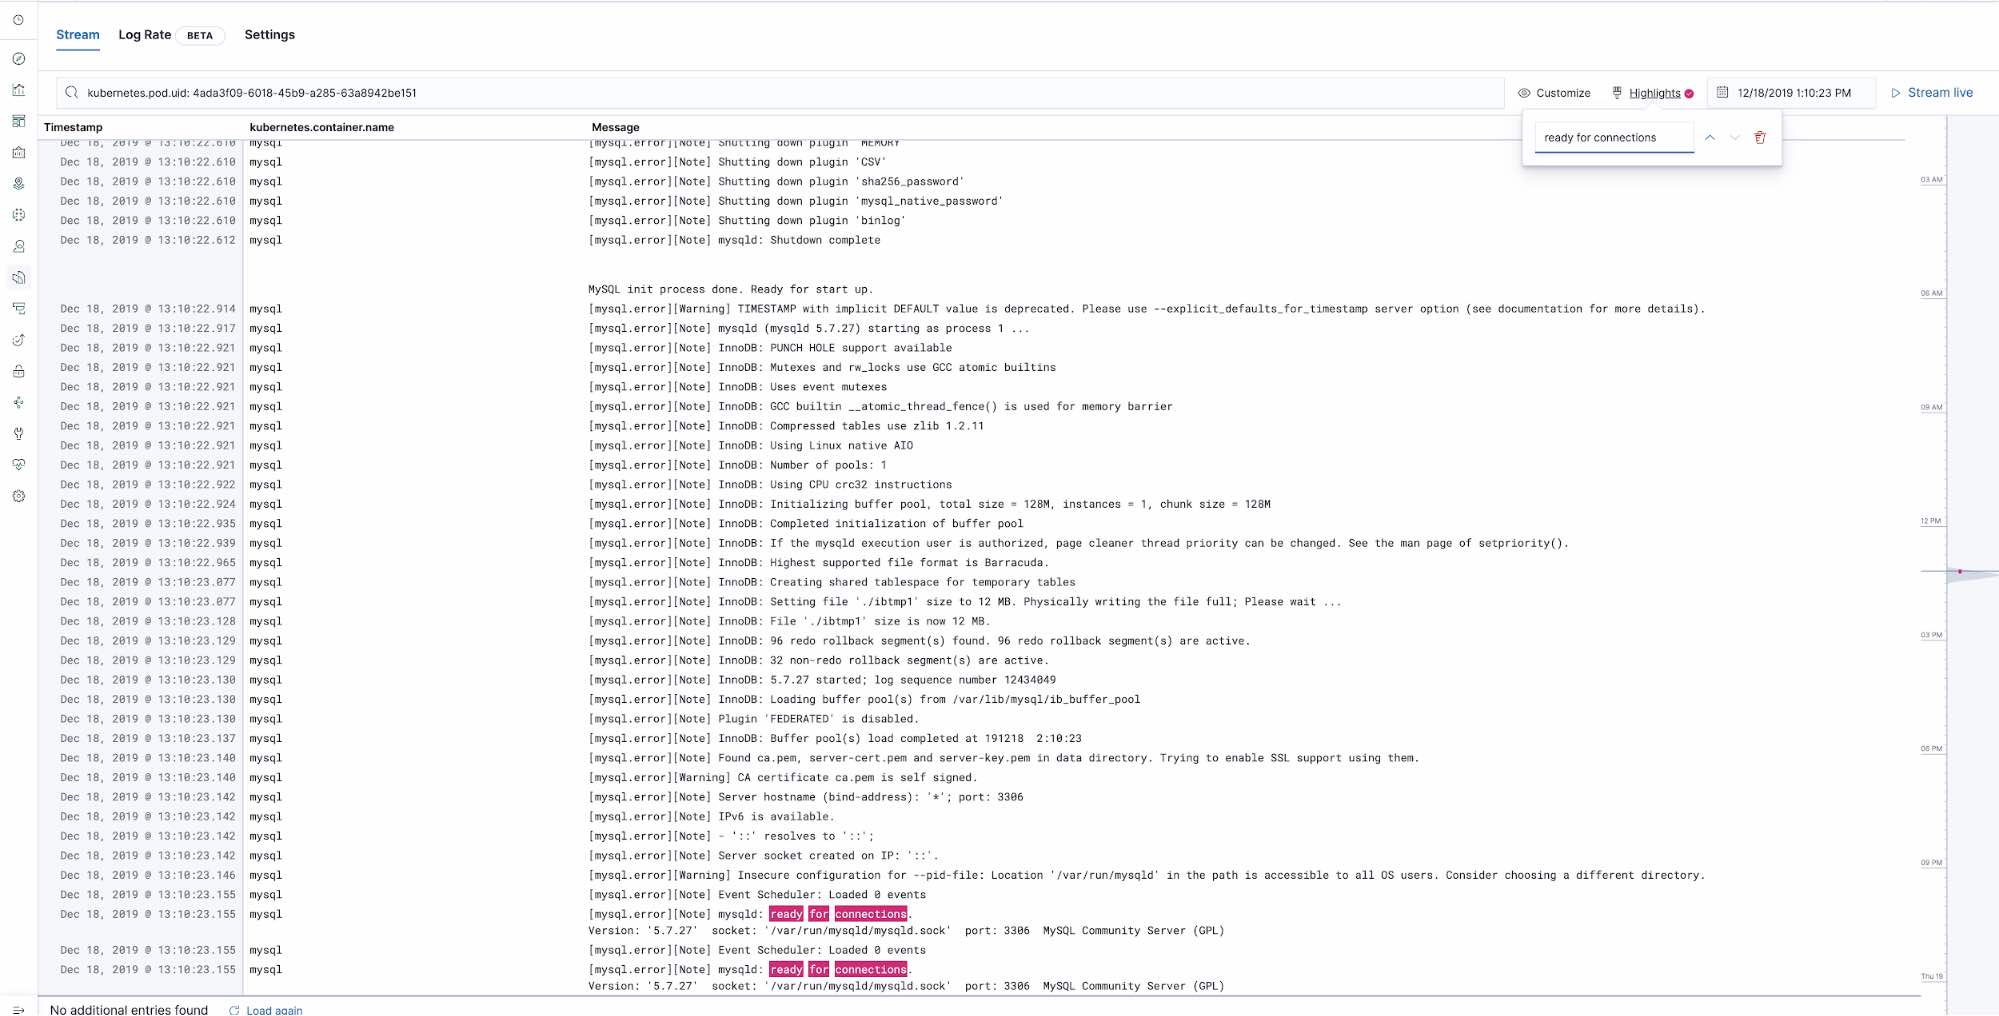
Validate the container is up by seeing the pod running in the Metrics app and observing MySQL logs through selecting it from the pod menu:

Wait for “ready for connections” MySQL log line:
Deploy the petclinic app and NGINX proxy:
$ kubectl create -f $HOME/k8s-o11y-workshop/petclinic/petclinic.yml
$ kubectl create -f $HOME/k8s-o11y-workshop/nginx/nginx.yml
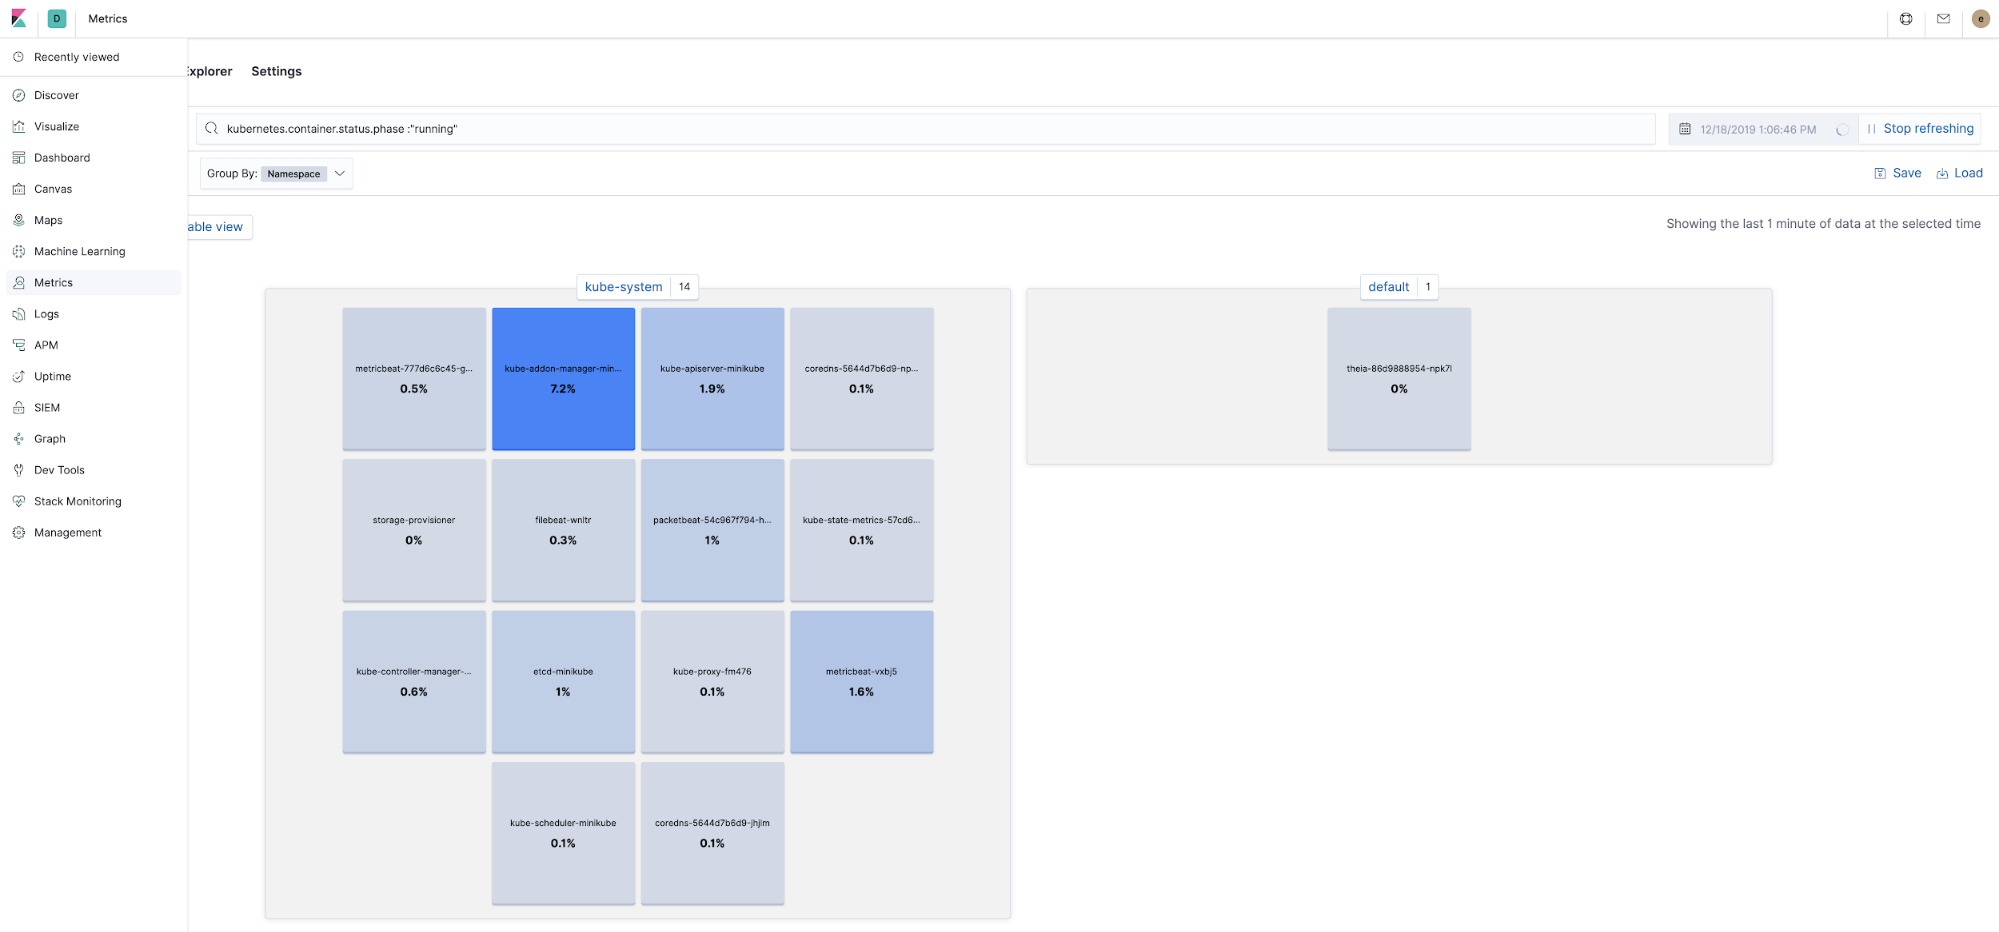
Verify all the components are running
See all the components running in Metrics app in Kibana:
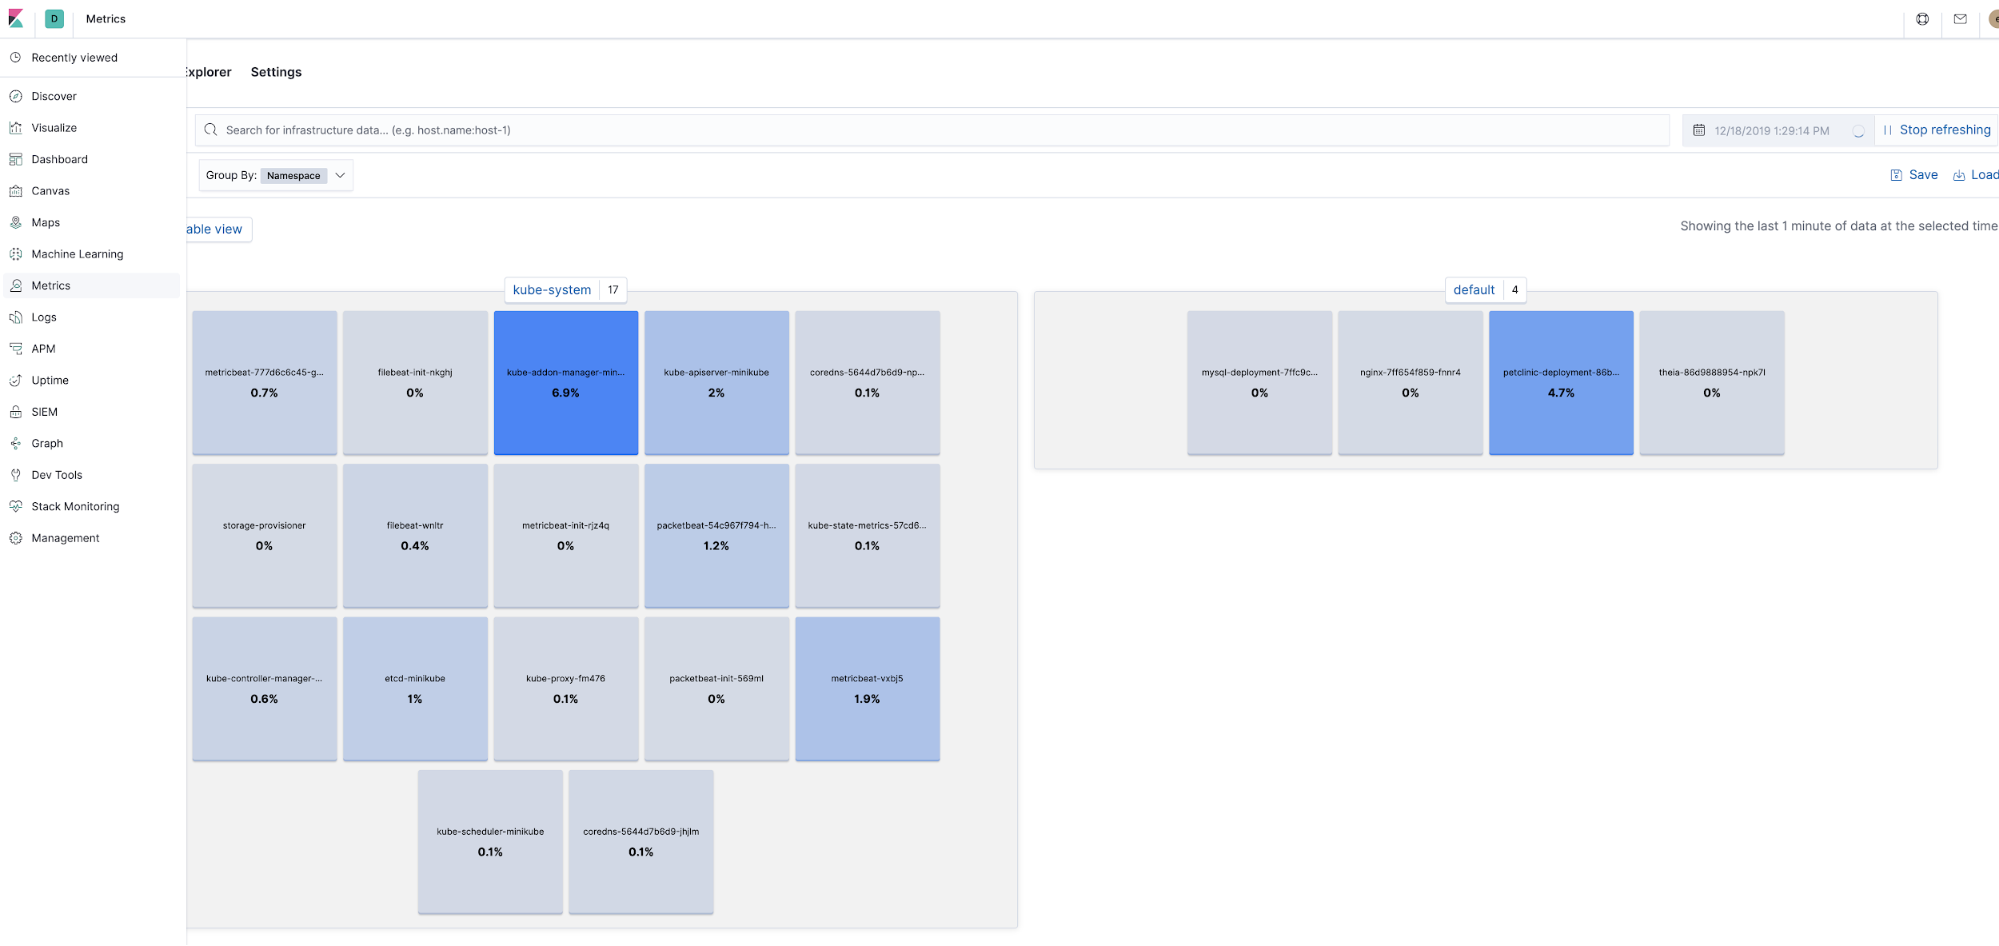
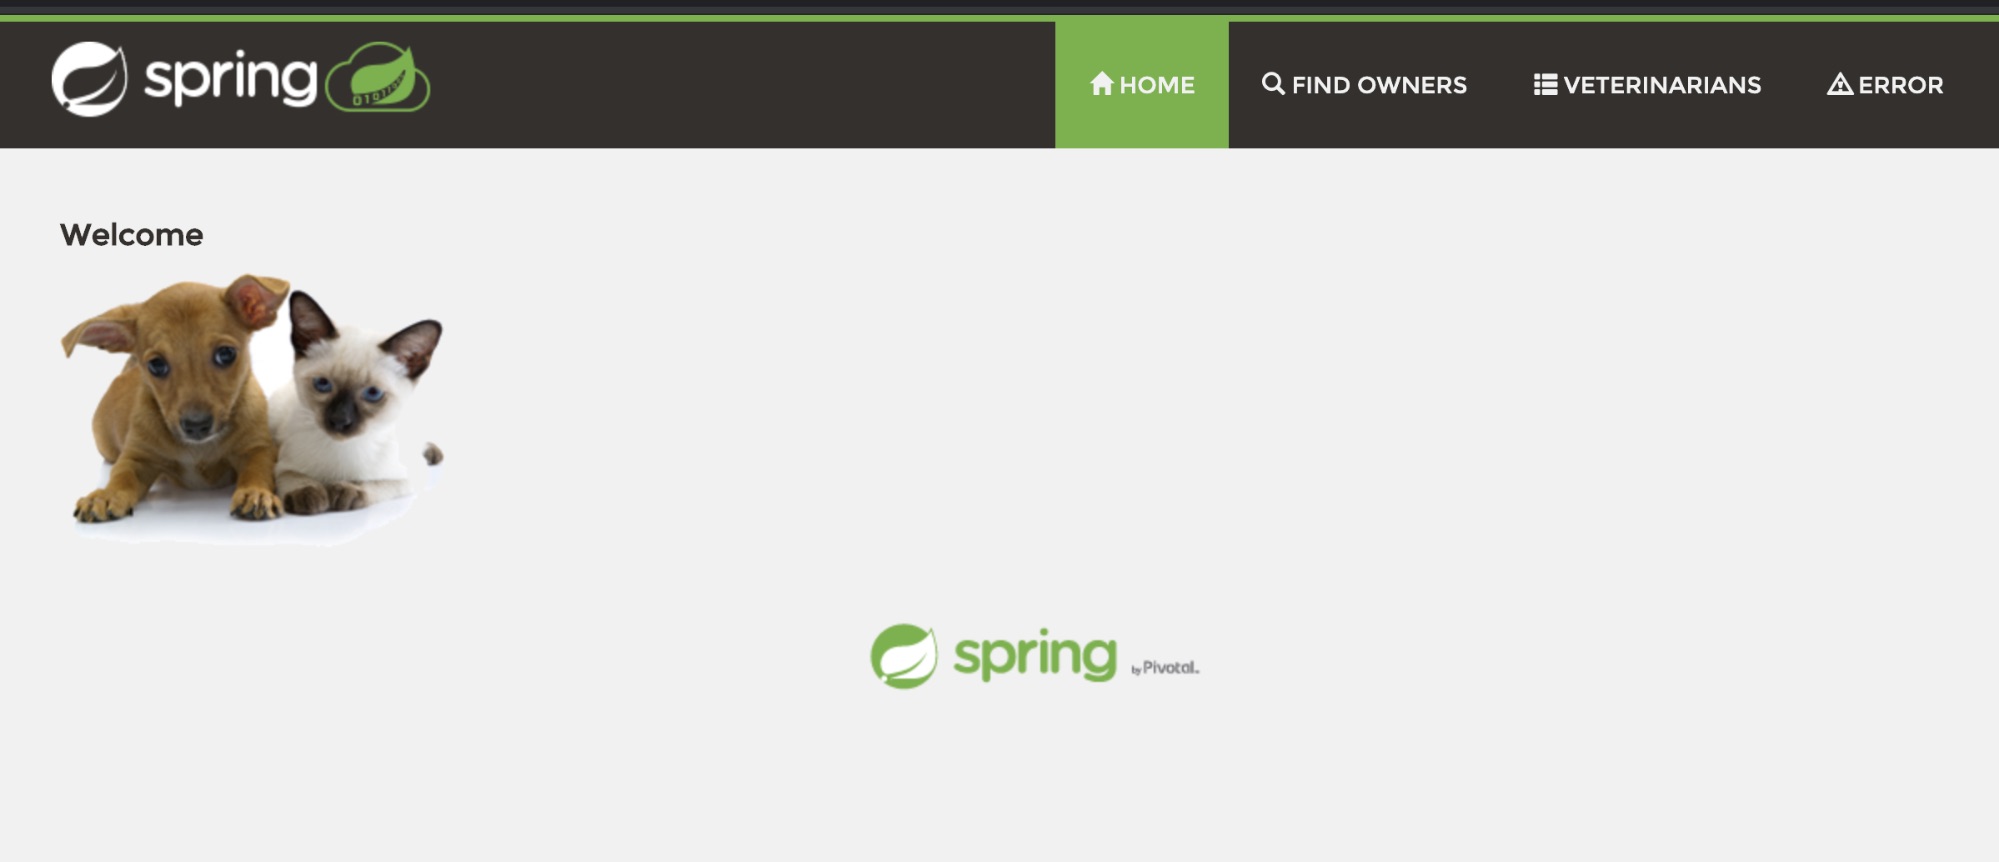
Validate petclinic UI is available on http://<public-ip>:30080. You can get the public IP address of the petclinic web application using kubectl get services command.
You are all set. Now you can get back to your regularly scheduled tutorial: Kubernetes observability tutorial: Log collection and analysis.