How to build a Managed Detection and Response Service with Elastic XDR and Corelight


 Share on Twitter
Share on Twitter

 Share on LinkedIn
Share on LinkedIn

 Share on Facebook
Share on Facebook

 Share by Email
Share by Email

 Print this page
Print
Managed Detection and Response Services (MDRS) extend well beyond the capacities of the traditional Managed Security Service Provider (MSSP) model. They strive for deeper infrastructure monitoring, response to detected threats, and a full SOC-grade portfolio of proactive capabilities such as threat hunting, forensics, and advanced analytics and reporting.
Elastic, which has historically been used as a powerful threat hunting platform, now provides a unified security solution that encapsulates security information and event management (SIEM) and endpoint security capabilities in the industry’s first free and open Limitless XDR platform.
The solution unifies prevention, detection, investigation, and response in one platform that can be the foundation of a massive scale MDRS.
Below, I’ll answer some of the frequently asked design and implementation questions about using Elastic and Corelight to build and deliver a mature MDRS to customers in various industrial sectors.
[Related article: Why almost half of organizations want to replace their SIEM]
Why Elastic and Corelight?
The short answer is: because the implementation and delivery of an MDRS is complex. This complexity is mostly related to:
- Achieving a high level of visibility across the monitored environments
- Acquiring the efficient technology needed to streamline incident response across the environments’ borders (the MDRS’s and the customer’s) upon the detection of malicious activities
- Gathering first-class skill sets for incident response in remote environments with stringent access
With Elastic and Corelight, you have a deeper visibility across all the three levels (Network, Host, and Application) of any IT/OT infrastructure, using the same platform, and on the same UI. It also makes it easier and more efficient to correlate and investigate events and take the appropriate actions toward any malicious activities directly in the environments of the MDRS’s customers with the Elastic XDR.
Elastic Cloud or self-managed?
To use self-managed deployments, platform developers need to provision the hardware, deploy, maintain, and license the Elastic Stack — all in the CapEx model.
To simplify these tasks and the long-term maintenance of a scalable platform for onboarding new customers, it is more relevant to use an orchestration platform such as Elastic Cloud Enterprise (ECE), which evolves from the Elastic-hosted cloud SaaS offering into a standalone product that can be deployed on-premises, or the Elastic Cloud on Kubernetes (ECK). Deploying Elasticsearch clusters without an orchestration solution like ECE or ECK is less efficient and requires robust automation.
On the other hand, the Elastic Cloud is fully managed by Elastic and available through several cloud providers across various geographical locations. This option makes it possible to:
- Launch your service faster
- Place your clusters very close to your customers to speed up the ingestion, reduce the cost, and maintain compliance
- Establish a more secure connection between the customer’s environment and the MDRS’s using Private Links with the different cloud providers (AWS, Azure, GCP)
You can also keep it more DevOpsy with the Terraform Provider for Elastic Cloud and start managing your deployments via your CI/CD pipelines.
[Related article: Using Terraform with Elastic Cloud]
Dedicated or shared clusters?
Data belonging to different customers of the MDRS can be located on the same Elasticsearch cluster. Kibana spaces make it possible to segregate access between security analysts and allow customers to access and explore their data.
Kibana spaces can be thought of as separate instances of Kibana, where each space contains all the dashboards, detections and alerts, and machine learning jobs for one customer. Those spaces are accessible via role-based access control to achieve the required level of segregation. Granular levels of access control are provided by the document and field-level security features, which can help enforce robust access for compliance with strict security and privacy standards.
By using Elastic Cloud, ECE, or ECK, it is simpler to create a dedicated cluster customized for each customer, which can be scaled manually or automatically using the auto-scaling feature.
Dedicated deployments also help with avoiding locating large customers with smaller ones to prevent potential performance impacts. They simplify security management via traffic filtering or private links and enable a simpler chargeback mechanism.
You can always use the Elasticsearch Service pricing calculator to help you make different estimations for various scenarios.
[Related article: How does Elastic Cloud pricing work?]
How to ingest Corelight data in multi-tenancy?
Zeek (formerly Bro) can help significantly strengthen network security monitoring and unleash the threat hunting capabilities of the MDRS, for both IT and OT customers. Corelight makes Zeek easier, faster, and even more powerful. It also makes the framework available through different types of sensors and combined with intelligent Pcap, encrypted traffic collection, C2 detections and insights, and more.
With these features combined, Corelight transforms the network traffic into summarized rocket fuel metadata that powers Elastic Security and increases the effectiveness of the detections and investigations, while keeping the costs down (the overall size Corelight log is typically 0.5%–1.5% of bandwidth).
Corelight data can be shipped directly to Elasticsearch using an out-of-the-box integration that facilitates the customer onboarding process. The sensors also provide reliable data buffering (up to 100GB per log type with retention of 7 days) in the case Elasticsearch is unavailable or under pressure. This simplifies the architecture of the MDRS and limits the need for any intermediate queuing systems.
Corelight sensors generate multiple log types, each for a specific purpose (DNS, files, connections, etc.). These logs can be ingested via a set of ingest pipelines that parse them directly in Elasticsearch and make them fully compliant with Elastic Common Schema (ECS).
Another set of Logstash pipelines for performing the same work is also available if you need to perform any further transformation or enrichment before sending the data to Elasticsearch. After the data is shipped to Elasticsearch, you can import a great set of Kibana dashboards from the same repository or build your own dashboards and visualizations with the Kibana Lens tool.
The available pipelines do not only parse the data, but they also make sure it is stored on the appropriate indices depending on the log types. To achieve multi-tenancy, there are a few more steps to take to segregate the logs across multiple indices for the different customers:
- If the data is directly shipped to Elasticsearch, you can simply use a special pattern in naming the sensors to help you distinguish which tenant the data belongs to (e.g., *-<customer-Id>).
- The name of the sensor will be ingested under the observer.name field of ECS, and a custom ingest pipeline can be then used to read this value and set the appropriate index name for the event.
- If the data is first sent to a different Kafka topic for each customer, then you can also use the name of this topic from the event metadata to place the data on the appropriate indices as well.
This approach is very simple and makes it possible to update the Corelight pipelines on your cluster or on Logstash with newer releases, without impacting your custom pipelines and ingestion workflow.
Upon its ingestion, the data can be also enriched with more contextual details and threat intelligence for better triaging and investigation. Some of the built-in rules of Elastic work with Corelight data, and you can also refer to the available Sigma rules for Zeek.
What about the architecture of the MDRS itself?
A good practice in building an MSSP or MDRS is to separate the customers’ data environments from the triaging and investigation environments in order to maintain isolation and scalability. With cross-cluster search (CCS), it is possible to centrally maintain all the detection rules on a separate cluster (let's call it the main cluster) and run those rules against the different customers’ clusters.
On Kibana of the main cluster, multiple spaces will be used for writing, running, and tuning the appropriate detection rules; responding to threats and hunting them down; generating reports; and extracting evidence.
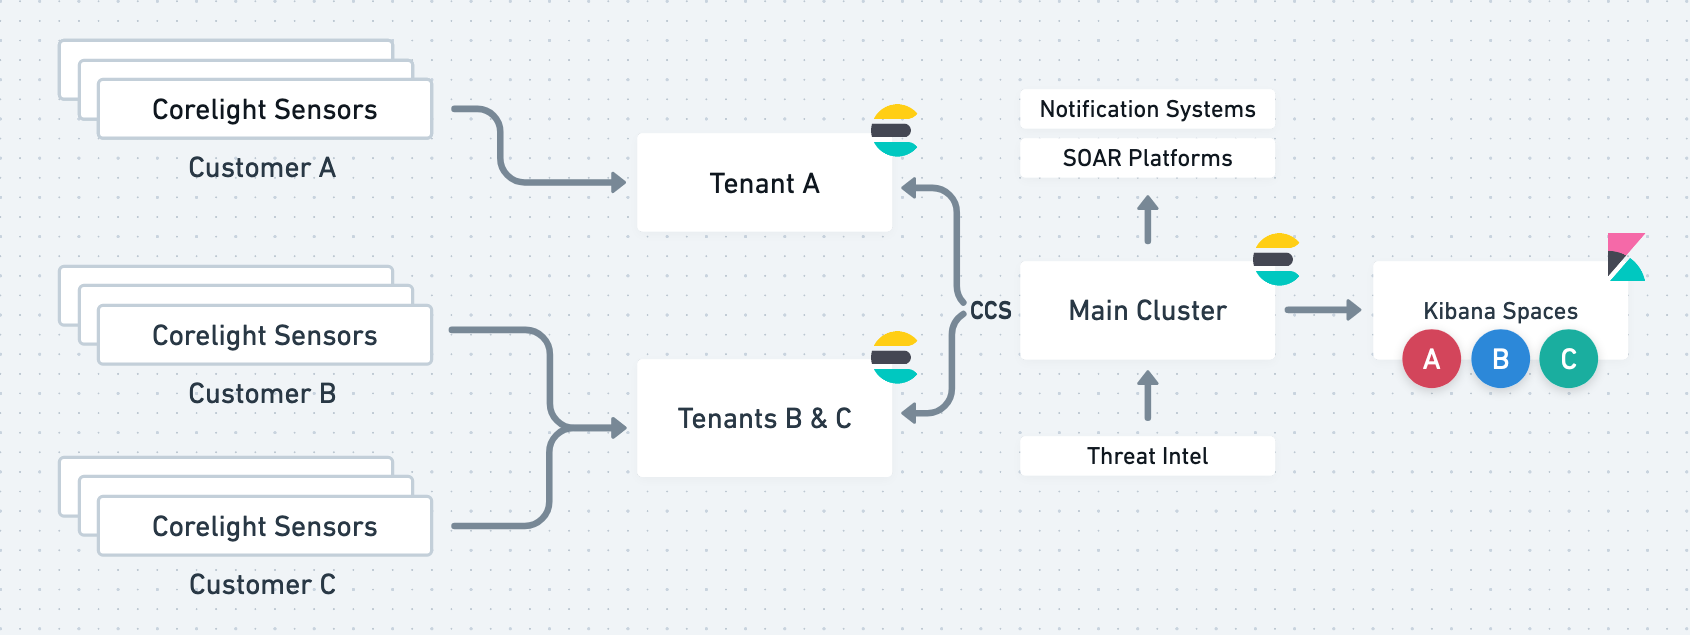
This architecture centralizes and simplifies the maintenance of the overall service and alleviates the hurdles of performing different actions on multiple locations. The main cluster will also be the central location for integration with SOAR platforms and third-party ticketing and notification systems.
In version 7.14, Elasticsearch added CCS support to Event Query Language (EQL). With this feature, you can run advanced behavioral detections across the different customers’ clusters, just like with Machine Learning and Kibana Query Language (KQL), which already support this feature.
[Related article: Search and replicate data between your Elastic Cloud and on-prem deployments]
Is there anything else I should consider?
When using Elastic Cloud, more architecture considerations should be taken into account, particularly if you aim to run your service on multiple regions and providers. Elastic cloud provides the capacity to search and replicate data across regions and providers; however, access to cross-regional CCS features is limited to enterprise subscriptions only.
Monitoring across regions is not supported, so you can use one or multiple dedicated clusters to monitor each region. If you have many clusters in a region and some of them are much larger than others, then create separate monitoring clusters to prevent large customers from potentially affecting the monitoring performance for smaller ones.
Try it out
Start your free 14-day trial of Elastic Cloud to experience the latest version of Elastic and order your demo from Corelight. Also make sure to watch the Elastic and Corelight integration webinar and take advantage of the Elastic threat detection training to set yourself up for success.
Note: Elastic has introduced new Licensing changes to Elasticsearch and Kibana, which impose restrictions on providing those products to other customers as a managed service. Please find more details about those changes in the FAQ on 2021 License Change.
Share
- Share on Twitter
Share on Twitter
- Share on LinkedIn
Share on LinkedIn
- Share on Facebook
Share on Facebook
- Share by Email
Share by Email
- Print this page
Print