Elastic Search Platform: More data, more insight, lower cost

 Share on Twitter
Share on Twitter

 Share on LinkedIn
Share on LinkedIn

 Share on Facebook
Share on Facebook

 Share by Email
Share by Email

 Print this page
Print
At this year’s ElasticON Global user conference, we shared how innovations in the Elastic Stack and Elastic Cloud make it possible for everyone to bring rich search capabilities to all of their data in a single platform, for any use case.
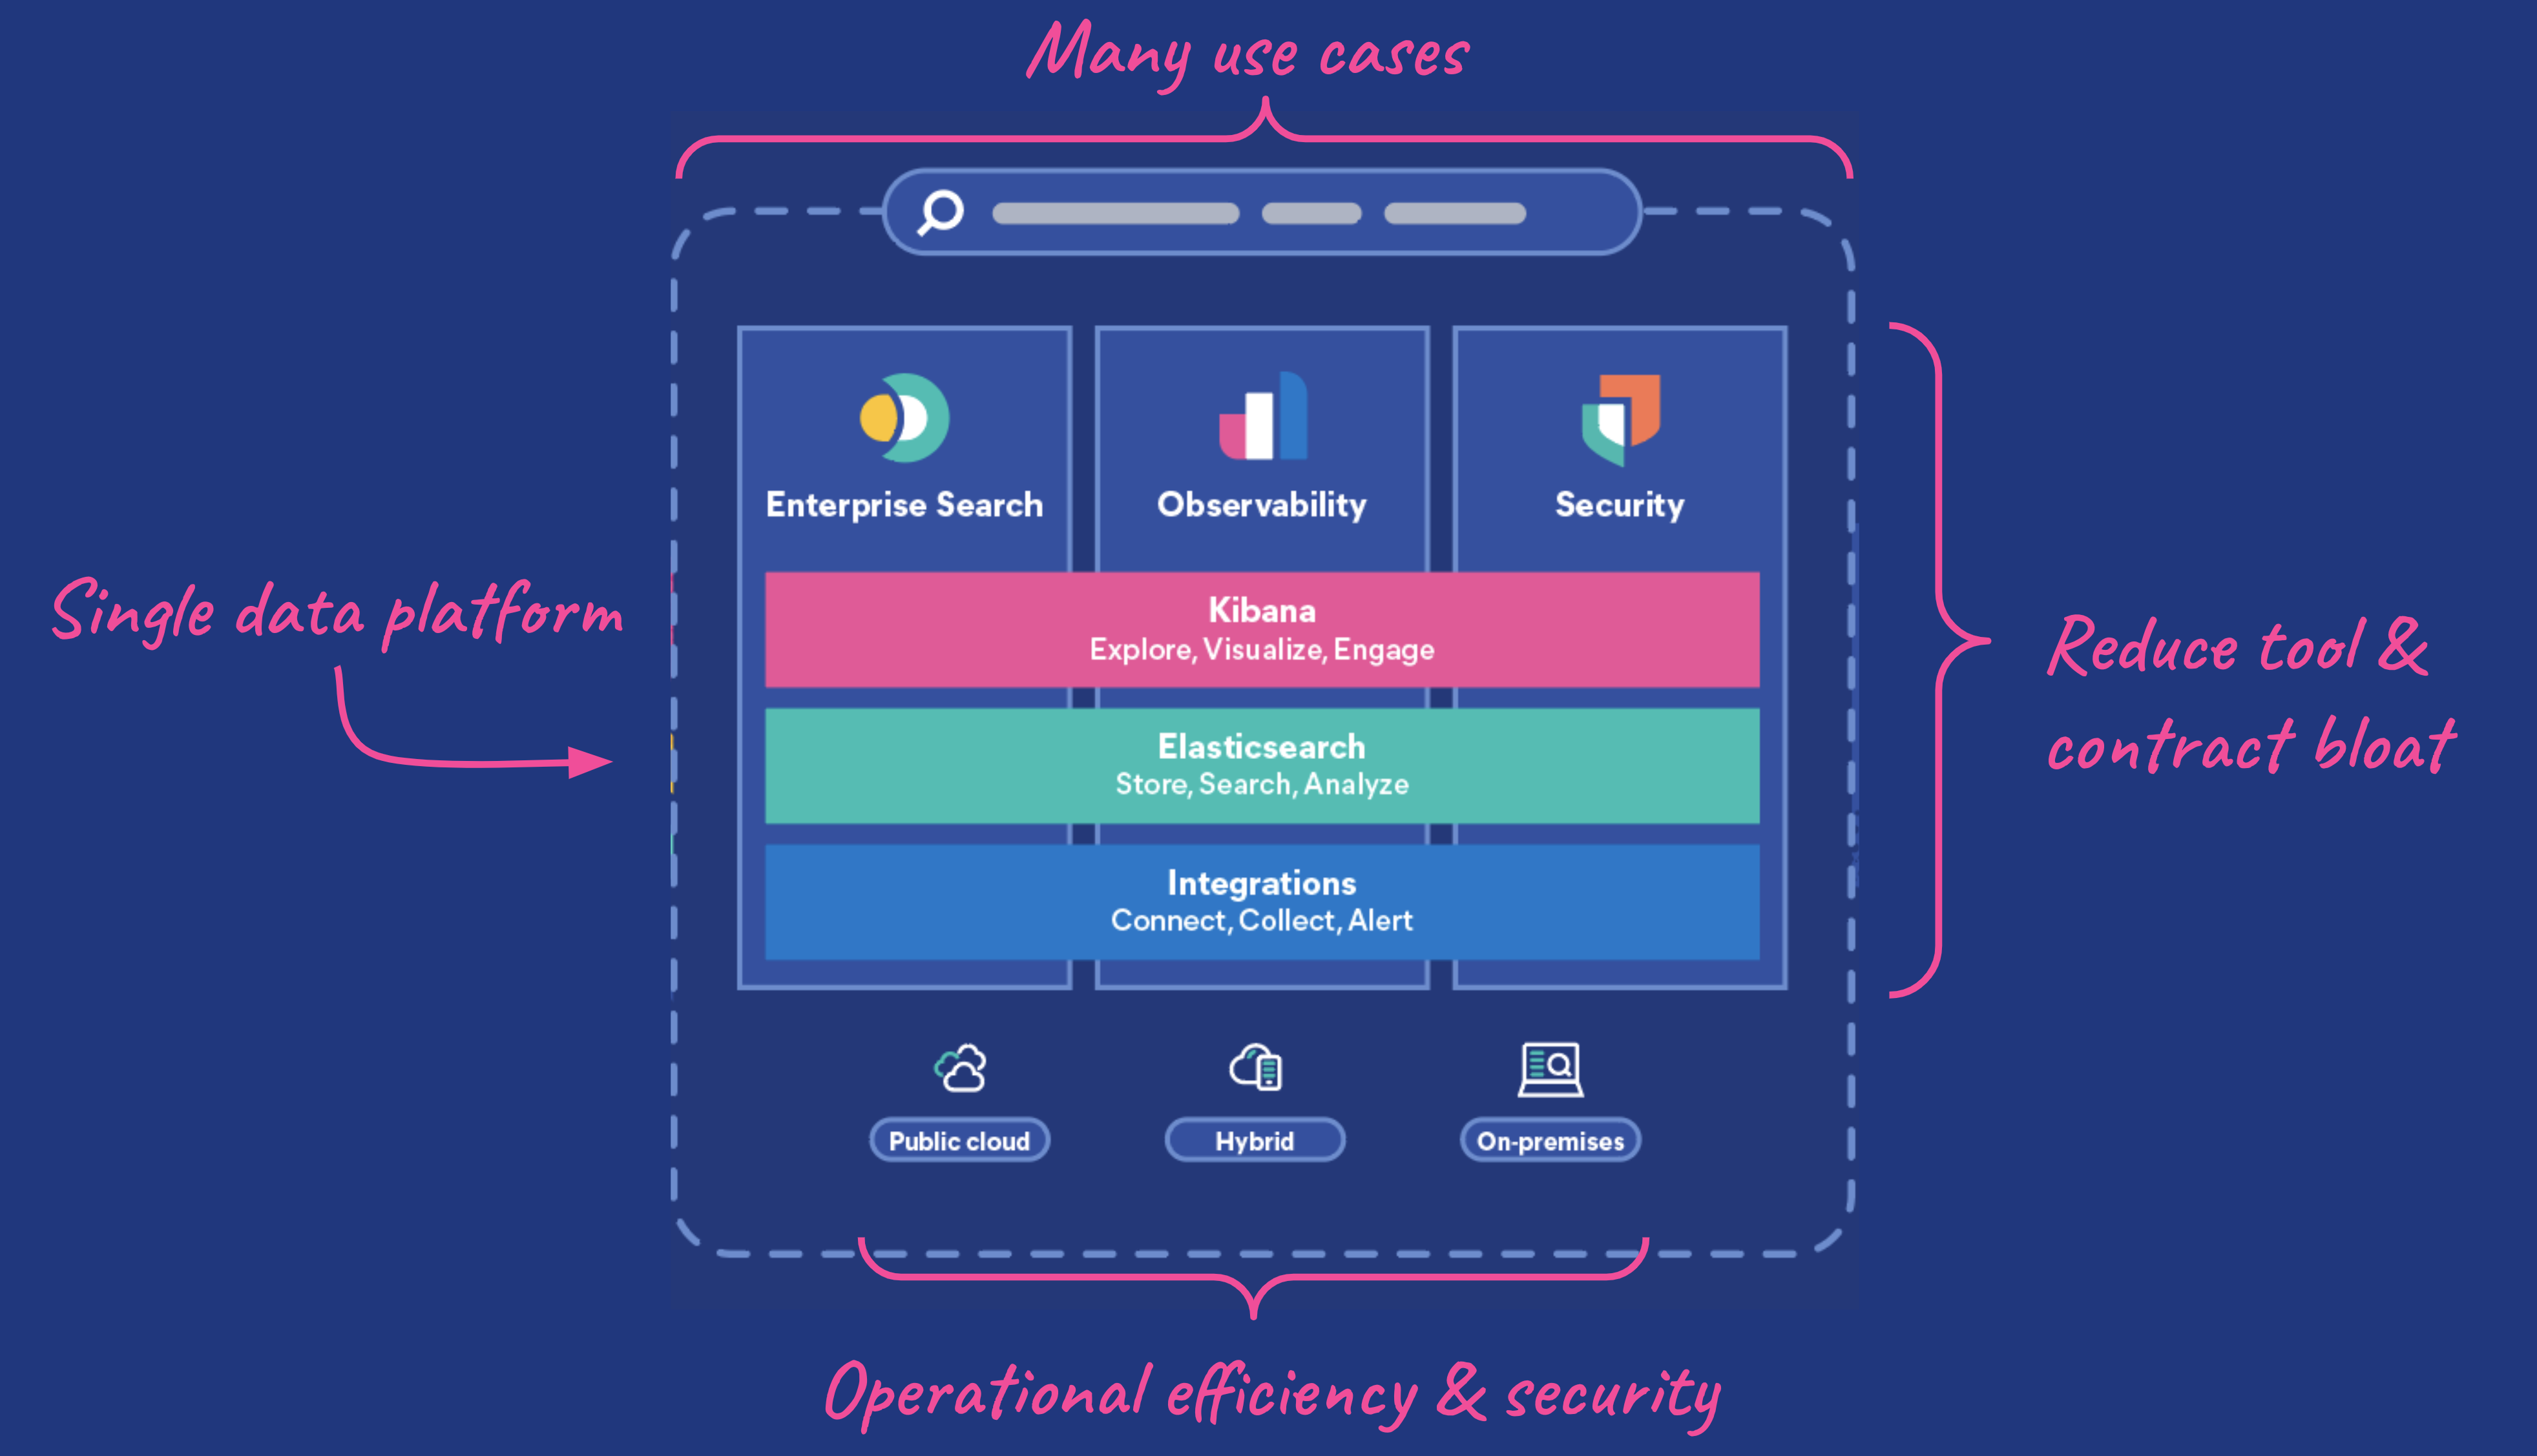
The Elastic Search Platform runs on a single technology stack, the Elastic Stack: Elasticsearch, a single data store to search, store, and analyze your data, and Kibana, which lets you visualize your Elasticsearch data and manage your deployment. The Elastic Stack is at the center of everything we do, allowing you to unify diverse use cases around a common denominator: data.
Data drives many use cases or solutions. In the Elastic Stack, all data is added into Elasticsearch using a common schema and is available for querying and search using Elasticsearch's powerful query and aggregation capabilities. That means there are no boundaries between use cases — all data resides in the same data store. Different teams should be able to use the same data for security, observability, and enterprise search to quickly deliver value.
The same engineering team who created the Elastic Stack also built Elastic Cloud, allowing us to vertically integrate our cloud platform with Elasticsearch and Kibana in a way that no one else can, with compelling functionality such as autoscaling, data tiers and searchable snapshots, and cross-cluster replication and search. And you can run in one or more of the 45+ regions globally, with support for hybrid and multi-cloud across AWS, Google Cloud, and Azure. Elastic Cloud is the best way to use and experience Elastic.
Simplified data onboarding
One area we’re focused on is making it easier to get data into Elastic — from native agentless data integrations within leading cloud providers to Elastic Agent, a single, centrally managed agent that supports integration with hundreds of data sources. We’ve built upon what we’ve learned from the success of Beats, and made it even easier to install, manage, upgrade, and connect new data sources. At the same time, Elastic Agent also provides protection against security threats, letting you protect, detect, and respond across hosts. Elastic Agent also empowers data analysts, shipping with out-of-the-box features like dashboards, visualizations, and pipelines to extract structured fields out of logs, making it easier to set up and gain insights within seconds.
For custom data or logs, we’ve focused on enabling data analysts to do more analysis and data enrichment themselves. Instead of requiring admins to do all the up-front work to extract every field in the logs, we’ve introduced runtime fields, our approach to schema on read, giving analysts the power to define fields on the fly that are evaluated at query time, providing flexibility when you need it. Elasticsearch runtime fields can then be converted to indexed fields for blazing fast search speeds. Only Elastic delivers the speed of schema on write and the flexibility of schema on read on a single platform. This experience will continue to get easier and faster in 8.0 and beyond.
Rich analytics at your fingertips
The Elastic Stack creates endless possibilities for exploring and analyzing your data and extracting insights, happening at the speed of thought as you jump from one idea to the next. One of the superpowers of our platform is that it’s fast and flexible enough to power that journey.
In Kibana, we’re continuing to make it even easier to explore your data in a truly natural, intuitive way with Kibana Lens. Quickly and interactively build dashboards and visualizations, perform on-the-fly-calculations, time shift to compare data across time periods at a glance, or create a new field on the fly with runtime fields, then jump into Maps to visualize geospatial information or apply machine learning to automatically surface anomalies.
But what good is insight if you can’t take quick action on it? We’ve integrated alerting across Kibana and deeply into our Elastic Security and Observability solutions. Designed to aid in escalation and collaboration, Kibana alerts help identify the signal from the noise, providing richer context. With tie-ins to third-party platforms like email, PagerDuty, ServiceNow, and Microsoft Teams, creating rules and acting on alerts in the Elastic Stack has never been easier.
We’re also planning to deliver on a long-standing request for the ability to correlate two different indices, similar to a join clause in SQL. Although SQL-style joins have not been supported in Elasticsearch, we have introduced features like join fields, enabling you to express simple relationships and query against them with a specialized syntax, and the Terms Lookup Filter, which provides a valuable but narrow way to expand your query. Now, with key innovations like runtime fields and the asynchronous query execution framework, we’re excited to take on joins. Stay tuned for more on this as we develop Elastic 8.x.
Faster, smaller, more efficient
You should never have to make tough decisions on how to keep growing data volumes searchable while staying on budget. One of our major focus areas has been making your hardware and your budget go further so you can get the insights you need, and not worry about storage and data transfer costs.
We’ve made significant investments in optimizing workloads by improving storage efficiency and giving you more options. With searchable snapshots, you can directly search data in low-cost object stores without significantly impacting search performance. Searchable snapshots power the new cold and frozen tiers, allowing you to store 2 to 20 times more data at the same cost as the warm tier. With this data, you can access the necessary logs, metrics, or security event data when performing security investigations, and feel confident that you’re meeting compliance standards for data retention.
We’ve also made strides in cluster resiliency and efficiency, focusing on Elastic Cloud. By compressing specific inter-node traffic and recovering shards from snapshots, we’ve significantly reduced data transfer and storage costs while making data recovery faster and more efficient. And with autoscaling in Elastic Cloud, soon to be enabled by default, we ensure that your deployment is properly resourced and performing. Scale up and down, and pay only for what you use.
And there’s more on the horizon. We’ve identified common challenges that users run into as they scale, especially for metrics storage. In Elastic 8.x, we’ll be introducing updates that drive orders of magnitude more efficient storage for metrics. This will also allow us to build support for new metrics-centric query languages like PromQL that will allow you to efficiently query and view metric data in a whole new way. Our vision for metrics will redefine and optimize how users store, search, and gain insights on critical time series data to observe and protect systems.
Now go out and solve
That’s just scratching the surface of what’s to come for the Elastic Stack. We’re constantly looking for ways to expand what our products are capable of and improve the experience for users, no matter what their use case.
To learn more about the vision for the Elastic Stack and Elastic Cloud, watch the keynote and other sessions from ElasticON Global on demand, or learn more about the Elastic Stack and Elastic Cloud on our website.
The release and timing of any features or functionality described in this post remain at Elastic's sole discretion. Any features or functionality not currently available may not be delivered on time or at all.
Share
- Share on Twitter
Share on Twitter
- Share on LinkedIn
Share on LinkedIn
- Share on Facebook
Share on Facebook
- Share by Email
Share by Email
- Print this page
Print