Elastic Stack 7.7.0 released
Editor’s Note — August 19, 2020: The Elastic SIEM solution mentioned in this post is now referred to as Elastic Security. The broader Elastic Security solution delivers SIEM, endpoint security, threat hunting, cloud monitoring, and more. If you're looking for more specific information on Elastic Security for SIEM use cases, visit our SIEM solution page.
We are pleased to announce the general availability of version 7.7 of the Elastic Stack. Like most Elastic Stack releases, 7.7 packs quite a punch. But more than the new features, we’re most proud of the team that delivered it. A feature-packed release like this is special during normal times. But it’s extra special today given the uncertain times we are in right now. It’s a testament to our resiliency as a team, organization, and business, and highlights our relentless focus on continuously delivering value to our users and customers.
There’s a lot to gush about in 7.7. Workplace Search is now generally available, bringing a modern and unified search experience to all your work content. The Elastic Stack also launches a fully reimagined alerting framework that brings new alerting experiences across Kibana. Elastic APM adds service maps, deepening system observability by providing a clear visual of how services are interconnected. Elastic SIEM introduces an embedded case management workflow, including an integration with ServiceNow. And that’s just a subset of the release highlights.
Elastic Stack 7.7 is available right now on our Elasticsearch Service on Elastic Cloud — the only hosted Elasticsearch offering to include these new features. Or you can download the Elastic Stack for a self-managed experience.
And now, without further ado, here are a few of the release highlights.
Alerting for the Elastic Stack, reimagined
We believe that alerting is fundamental to so many use cases for the Elastic Stack. Whether you're tracking the uptime of your app, watching response time SLAs, or looking for attackers, alerting is a key tool for helping to detect issues and take action. With Kibana 7.7, we are excited to introduce our new alerting system, a big step in delivering first-class alerting experiences throughout Kibana. We outlined the approach last year, but the concept is simple — each solution, each app in Kibana, should be able to bring alerting workflows to where the user is, tailored to their context and use case. And each app should be able to use any of the predefined actions or notification mechanisms. So we built our alerting system from the ground up with this as our goal.
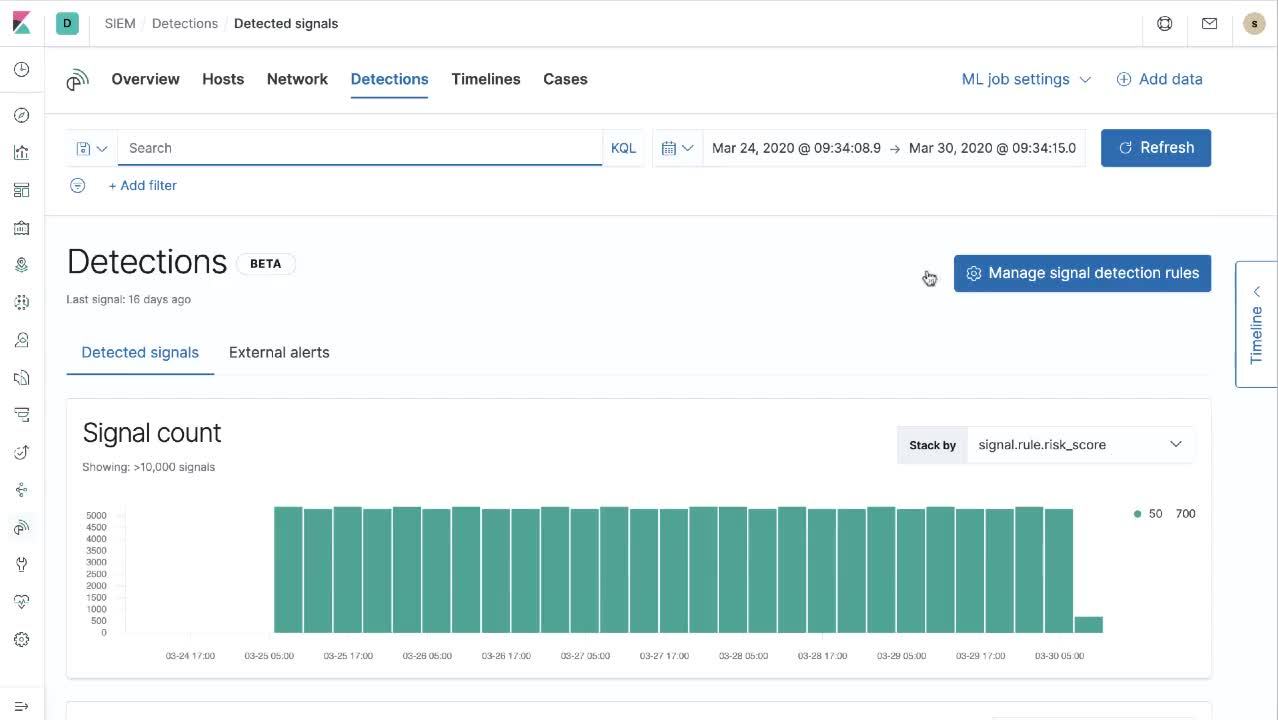
In 7.7, we're seeing the fruits of this labor across Kibana. A full alert management UI and a set of powerful new alert interfaces live inside the Management app in Kibana. But most users will experience alerting through one of our solutions. The SIEM detection engine in Elastic SIEM now supports sending notifications through alerting when a rule hits. Elastic Observability introduces tightly integrated alerting experiences directly into the Metrics, APM, and Uptime apps. In Metrics, you can easily create an alert from the Metrics Explorer view to trigger a heads up when something changes in your infrastructure. In APM, you can set up rules to catch things like shifts in transaction times or a jump in error rates on any service. With Uptime, easily create an alert when the status changes in one of your monitored services.
The new alerting framework also focuses on enabling alerts to do more than simply get a human’s attention. We are providing a rich set of third-party integrations — such as email, Slack, and PagerDuty — so that you can act on these alerts through your existing incident and case management workflows. For an in-depth view of the new alerting capabilities available in beta, be sure to check out our alerting blog post.
Make it slow: Asynchronous search opens the door to new cost/latency tradeoffs
Elasticsearch is optimized for blazing fast searches. However, not all use cases require fast search all the time, for all types or quantities of data. Over the years, Elasticsearch has added several features (e.g., hot-warm support and frozen indices) to give users the flexibility to balance the speed of search execution, the amount of data that can be searched in a single go, and the cost of the hardware to support their use case. Building on that trajectory, Elasticsearch 7.7 adds asynchronous search to deliver a great user experience when you choose to “make it slow” and search over massive amounts of data or reduce costs with less expensive storage.
Asynchronous search lets you run potentially long-running queries in the background, allowing you to track their progress and retrieve partial results as they become available. Kibana 7.7 will use asynchronous search in Dashboard and Discover. For example, if a dashboard query time gets close to the Kibana timeout limit, users will see a notification allowing them to ignore the timeout and run the dashboard to completion. Future versions will integrate the asynchronous search feature more tightly into the Kibana experience, where users will be able to run Kibana queries in the background while doing other things in Kibana.
Read more about asynchronous search and all the other new features in the Elasticsearch 7.7 release blog.
Elastic Enterprise Search
Workplace Search becomes generally available, bringing modern search to the enterprise
We are very excited to announce the general availability of Elastic Workplace Search, a product that allows organizations of every size and stripe to deliver a unified search experience to their workforce by making all of their work content discoverable behind a single search bar.
Today, companies are operating in more distributed and virtual environments than ever before. Organizational knowledge is scattered across a slew of apps and collaboration tools: Microsoft 365, Google G Suite, Salesforce, Zendesk, Google Drive, OneDrive, Dropbox, GitHub, Jira, ServiceNow, SharePoint Online, Confluence, and others. Elastic Workplace Search has a simple goal: help organizations create a centralized way to effectively use this sprawling knowledge.
With its rich universe of third-party integrations and an emphasis on simplicity, Workplace Search can be deployed in a fraction of the time required for legacy tools. Built on a powerful Elasticsearch foundation, Workplace Search is designed to help you deliver secure, personal, and relevant search to your teams, at scale.
Learn more about this newest addition to the Elastic portfolio in the Workplace Search announcement blog. Get a scoop on all the other new Enterprise Search features in the Enterprise Search 7.7 release blog.

Elastic Observability
Service maps in Elastic APM show you the big picture
Elastic APM 7.7 adds service maps to provide you with a graphical view of the dependencies between your instrumented applications and the external services that they call. Elastic APM uses the transaction data to determine what services are talking to each other and automatically creates the service map based on that data. In today’s distributed and often dynamic architectures, a live graphical picture of how the pieces fit together is critical to understanding your systems.
It's not just about bubbles and lines. The service map shows high-level, key performance indicators for each instrumented service, along with summary information about any external services that you call, letting you toggle between the 50,000-foot view and the granular view with ease.
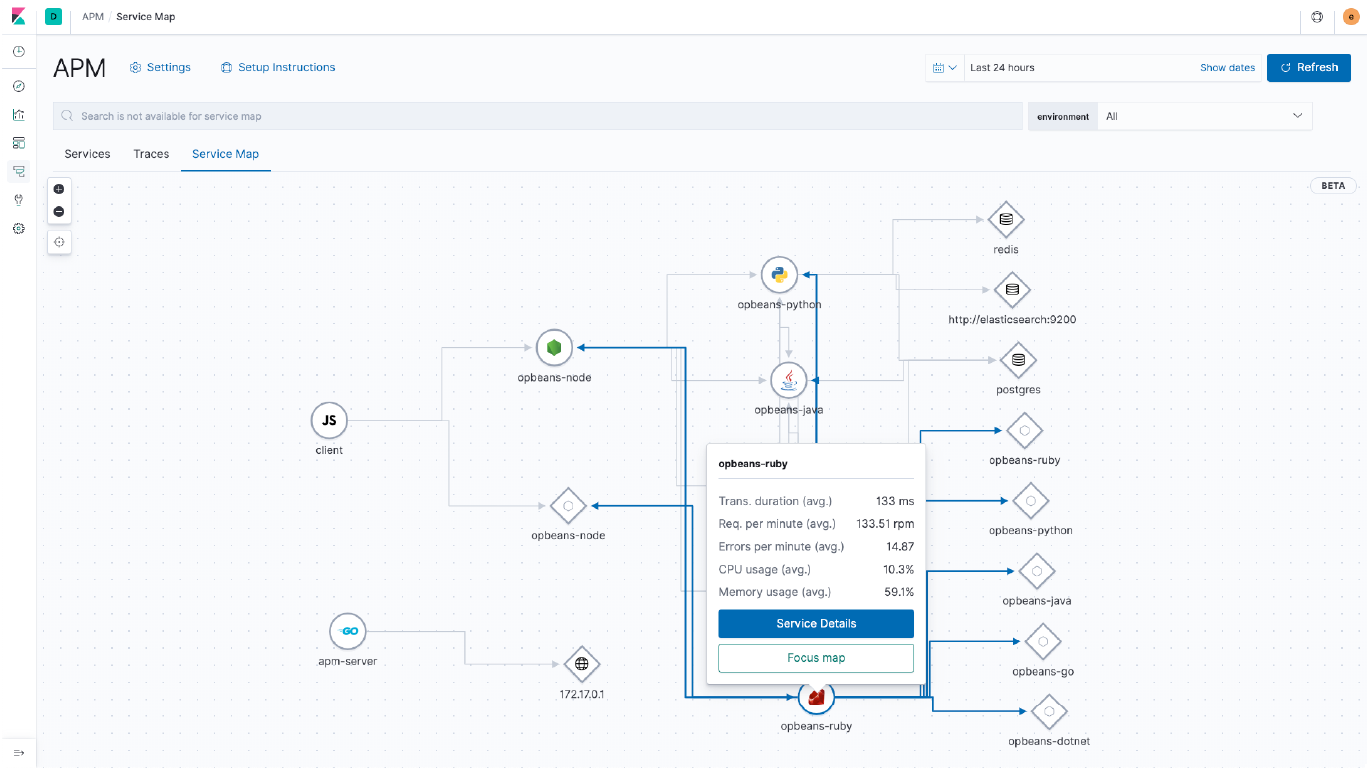
Service maps are a handy extension of distributed tracing. While distributed tracing provides a waterfall view of individual calls across your services for a specific transaction, service maps provide a more holistic bird’s-eye view of how services interact with each other.
Integrations! Integrations! Integrations!
The Elastic Observability team has been on a relentless mission to simplify instrumentation by providing more and more out-of-the-box integrations across all dimensions of the technology landscape. The mission continues in 7.7 with the addition of several new integrations: Prometheus, AWS (Lambda, Virtual Private Cloud, Amazon Aurora, DynamoDB), Google Cloud (Pub/Sub and Load Balancing), Azure (database account and container metrics), Pivotal Cloud Foundry, MQTT, Redis Enterprise, Istio, and IBM MQ. Phew! That’s quite a list.
Instrumentation is a big part of building observable systems. Proper instrumentation ensures that when an incident occurs, you have all the data you need to quickly identify the system component that caused the failure and resolve the issue. Instrumentation also lets you create an early warning system to detect issues before they happen. No matter what technologies power your organization, we want to make collecting the logs, events, and metrics from all layers ridiculously simple.
Dive deeper in all the new features in the Elastic Observability 7.7 blog post.
Elastic Security
Embedded case management in Elastic SIEM streamlines incident response
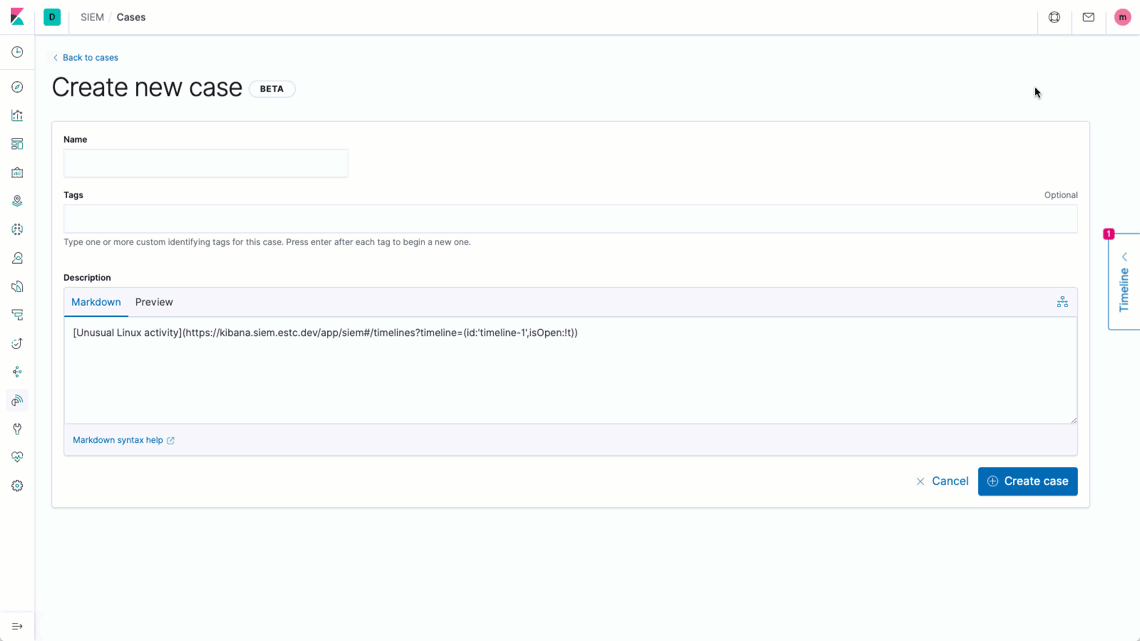
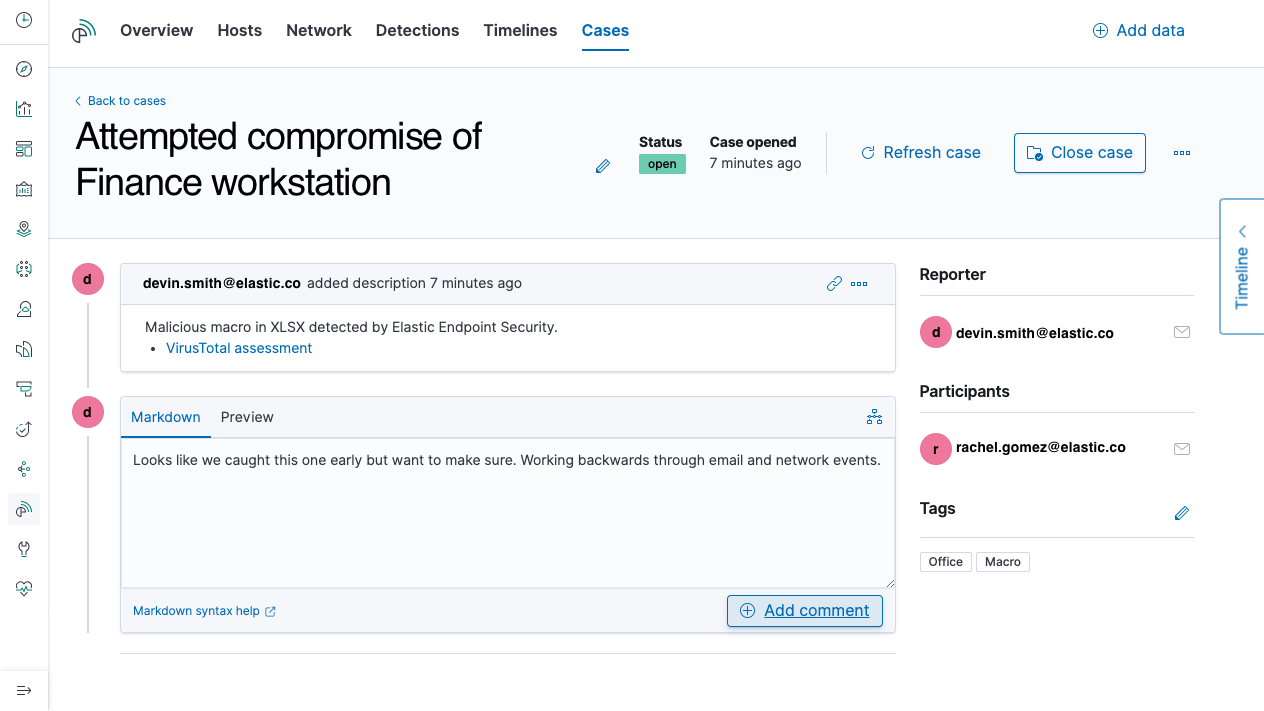
Elastic Security 7.7 introduces embedded case management, giving your security operations teams more control over their detection and response workflows. Analysts can now open, update, tag, comment on, close, and integrate cases with external systems using a built-in case workflow. SOC teams can include rich investigation guides on SIEM detection rules to deliver contextual resources — such as remediation recommendations and reference information — to the security analysts responsible for qualifying and investigating potential threats.
The embedded case management workflow provides the information for SOC teams to track detection times and generate dashboards showing mean-time-to-respond (MTTR) and other security posture KPIs.
Elastic SIEM adds native integration with ServiceNow ITSM
The new case management feature in Elastic SIEM directly integrates with ServiceNow ITSM, allowing analysts to forward information from Elastic SIEM to the ServiceNow platform for cross-org ticket tracking and remediation. The native connector allows for case updates, ensuring that analysts are always operating with the most up-to-date information.
Broaden your visibility with more open integrations
Collecting actionable data from across your environment is a vital step for securing your organization. Elastic Security 7.7 adds data integrations with Okta, Microsoft 365, Check Point, and other important technologies, making it simpler to achieve visibility into your entire ecosystem.
Get all the details in the Elastic Security 7.7 announcement post.
There’s always more...
So much more. Check out the individual product blog posts for the details on everything we added in 7.7:
The Elastic Stack
Solutions