Alerting in the Elastic Stack
Editor's Note: With the release of Elastic Stack 7.11, the new alerting framework is now generally available. In addition to existing connectors to 3rd party platforms like Slack PagerDuty, and Servicenow, 7.11 adds Microsoft Teams to the list of built-in alerting integrations. Read more about this update in our alerting release blog.
Alerting is fundamental to Elastic's use cases. Since Watcher (our original suite of alerting features for Elasticsearch) was introduced back in 2015, we’ve received a lot of feedback that’s helped refine our understanding of what an alerting system needs to be and what the user experience should entail. The purpose of this post is to summarize some of the key things we’ve learned, how it’s influenced our work in 2019, and what the future holds for alerting for the Elastic Stack.
What have we learned?
Four years of alerting at Elastic has created a wealth of knowledge about alerting systems. I’ve tried to synthesize what we’ve learned into three forward-looking observations: we see alerts in every use case; we need to make sense of them across use cases; and alert detection and response are growing more sophisticated. These learnings shape our thinking about the future of alerting.
Alerting everywhere
Alerting cuts across all our products and use cases. If you have live data, there’s a case for alerting. This is why we built Watcher and why it’s been successful. Yet when we look across use cases it’s clear there’s no one-size-fits-all alerting.
From products like Elastic Logs, SIEM, APM, Uptime, Infrastructure, and Maps, to features like monitoring and machine learning to a multitude of Kibana dashboards, alerts and notifications play a critical role, yet each has unique needs for detecting conditions, expressing them, and showing them in context. Effective alerting and monitoring requires deep integration with a product. As the stack and its uses have evolved, it’s become clear that Elasticsearch alerting needs a complement that allows for tightly integrated, rich expression of alerts within each use case.
Making sense of alerts
The corollary of “alerting everywhere” is that as these different uses cases generate alerts, alerts becomes their own source of data and create opportunities for understanding systems and their state. Or, as the Site Reliability Engineering (SRE) community might say, there are opportunities to improve the observability of an overall system.
Each use case interprets data its own way, and alerts show different facets of a situation. The right response to an incident often hinges on data from multiple sources, and correlating different types of alerts and events to understand a situation. In some domains, like SIEM, higher level alerts are triggered from patterns in lower level alerts.
As the Elastic Stack increasingly becomes home to more and more use cases, an alerting system done right will not just generate alerts but also help you make sense of them across use cases. For instance, Uptime alerts may show a service outage, APM alerts explain which transaction caused it, while monitoring alerts pinpoint why it happened. An alerting system should provide context, enable correlation, and improve awareness — for both people and machines.
Detection and action
The corollary of “making sense of alerts” is that with a more observable system, you can detect more complex conditions and take more sophisticated actions. Increasingly this goes beyond what we traditionally think of as alerting.
Alerting is usually focused on detecting a condition and then getting a human’s attention — and often it ends there. Looking at the bigger picture though, an alerting system can be thought of as part of a control or feedback loop: observe, detect a condition, take some action, observe again.
Today an ‘action’ usually involves notification — putting a human in the loop to control the system and try to correct it. But as system insight improves, the ‘action’ can take on more control, usually under human supervision. This could be a semi-autonomous system governed by a two way conversation (chatbots for example), or a fully autonomous system, as we see in the trend towards auto-scaling, self-healing, and self-optimizing applications.
An alerting system needs to support sophisticated detection and actions, acknowledging that ‘detection’ can be more than a query to Elasticsearch, and ‘action’ is becoming more than sending an email or calling a webhook.
Applying what we’ve learned
We decided back in the fall of 2018 that we needed alerting to support the three observations above.
We also decided that having alerts as first-class entities in Kibana would be the best way to do this:
- Alerting everywhere: rich alerting integrations across our products, at the plugin, API, and UI levels
- Making sense of alerts: providing an intuitive interface across alerting types
- Detection and action: sophisticated detection and action mechanisms via Kibana plugins
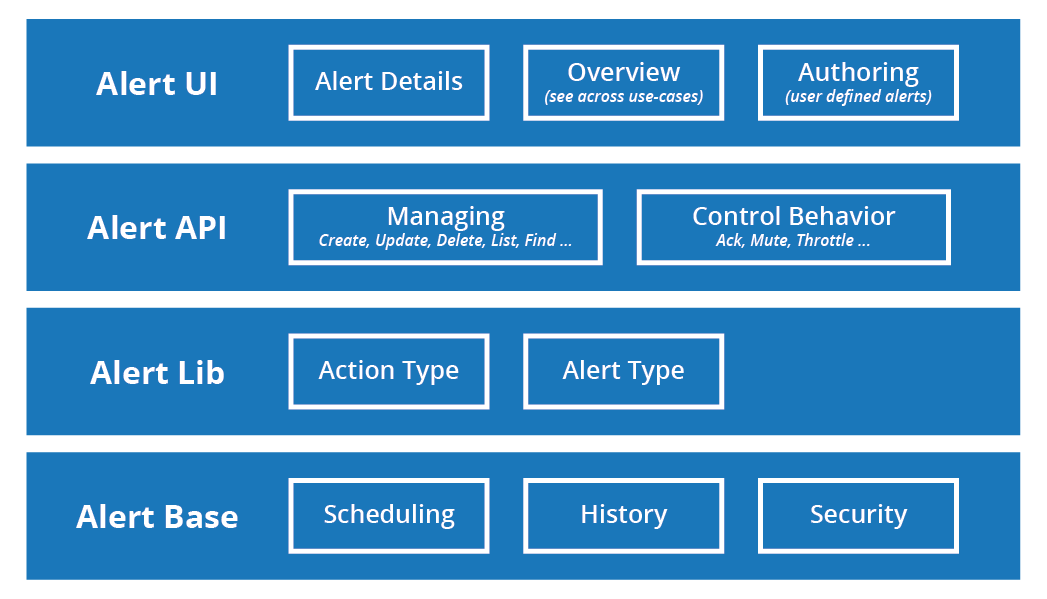
We also know from Watcher that alerting must scale to production alert loads and be highly available and reliable. APIs, UIs, and plugin/library contracts to support the three observations must be built on a solid and scalable base. All together we see four layers to Elastic’s alerting system:
In 2019 we’ve been laying the foundation of the new alerting system in Kibana.
In January, we added Task Manager as part of the 6.7 release. This gave Kibana background scheduling with persistent tasks that can be distributed across several Kibana instances for scalability and availability. Alert base layer components like Task Manager can power more than just alerting. For example, Task Manager could provide a better scheduled report experience in Kibana.
Then in June, we added two new sets of APIs to Kibana: the alerts API and the actions API.
The actions API lets Kibana register and fire actions, and provides a simple contract for defining your own, making it easy to customize. The initial release also had a few example actions for logging, Slack, and email notifications.
The alerting API allows Kibana to register forms of detection as ‘alert types’, and then run these checks on a schedule using the Task Management system. Like actions, there’s a simple alerting contract: if you can express it in a JavaScript function that runs on the Kibana server, it can power an alert.
Elastic Stack 7.4 is focused on filling out the lower levels of the alerting system: we’re hardening the APIs; adding support for security and spaces; and adding a few more built-in actions like indexing, webhooks and pager duty.
What’s next?
Development of Kibana’s alerting system has been in full swing for the last couple of months, and that’s going to continue through the 7.x release cycle. Our plan is to roll out the system in three phases.
The first phase has been going on for much of 2019: laying the foundation. It focuses on scalable task management and scheduling, contracts for alerting and action, and APIs.
We’re now moving into the second phase, where different use cases can integrate the alerting system at the API and library levels. This also includes designing and building a UI in Kibana as part of making sense of alerts and validating it with specific use cases (like monitoring, uptime, or SIEM for example).
The third phase will extend the "alerts everywhere" and "detection and action" themes by allowing user defined alerts throughout Kibana, whether through templated alerts or even expression based alerts using something like Canvas expressions.
The end goal is a system that satisfies our vision of alerting in the Elastic Stack:
- Alerting everywhere: Alerts are a first class, space-aware entity within Kibana. This makes it possible to segment the creation and viewing of alerts across groups, and allows rich integration of alerting in products like SIEM, Monitoring, and Uptime (to name a few). Alerting complements and works alongside Watcher, it does not replace it.
- Making sense of alerts: Rich alerting integrations will be accompanied by Kibana UI that provides comprehensive views across alert types, as well as tools for correlating and making sense of alert history.
- Detection and action: The APIs and plugins are designed so that a detection or action mechanism can be anything provided it can be expressed in JavaScript running on the Kibana server. This leaves plenty of room for the sophisticated detections and actions that will appear in Kibana through products like SIEM or our observability solutions.