Elastic Stack 8.10: Simpler cross-cluster search and authentication, and more

 Share on Twitter
Share on Twitter

 Share on LinkedIn
Share on LinkedIn

 Share on Facebook
Share on Facebook

 Share by Email
Share by Email

 Print this page
Print
Elastic Stack 8.10 delivers enhancements to cross-cluster and vector search, data ingestion, Kibana®, and cloud registration.
- Gain more flexibility when configuring remote searches and more information to triage issues facilitates cross-cluster searches.
- Accelerate vector search by allocating multiple threads per shard. Embedding models with up to 2048 dimensions are now GA.
- In Kibana, you can detect drifts in your data using the Data Comparison view, analyze not only spikes but also dips in log rates, filter heat maps and partition charts by multiple values, and add change point detection charts to dashboards.
Additionally, with Elastic® 8.10, integrate securely with almost any third party since we added client certificate support to our Webhook connector, and stream application data to a Kafka broker using Elastic Agent. Finally, get started on the cloud marketplace of your choice when you register in the cloud, with convenient links to AWS, Google Cloud, and Azure!
These new features allow customers to:
- Execute vector search much faster in some cases
- More easily configure and maintain cross-cluster searches
- Analyze both spikes and dips in log rates
- Securely ingest data using the Webhook connector
Elastic Stack 8.10 is available now on Elastic Cloud — the only hosted Elasticsearch® offering to include all of the new features in this latest release.
What else is new in Elastic 8.10? Check out the 8.10 announcement blog to learn more >>
Cross-cluster async search provides more info about remote search status
When you want to take the questions to the data and leave the data where it is, use cross-cluster search (CCS). We continue to improve the experience in 8.10, providing more information about what occurred on each remote cluster, which will be helpful in case there were any issues during the search. Previously, the search response indicated how many remote clusters were searched, and how many of those were skipped.
Search response clusters section before:
…
 "_clusters": {
    "total": 3,
    "successful": 2,
    "skipped": 1
  },
…
Previously, it was not clear which clusters were skipped or why. Now, CCS responses include much more status information from each remote. The _clusters section has a new details section with an entry for each cluster (remote and local). It includes status info, shard accounting counters, and error information that are updated incrementally as the search happens.
Search response clusters section in 8.10:
…
   "_clusters": {
      "total": 3,
      "successful": 2,
      "skipped": 1,
      "details": {
        "(local)": {
          "status": "successful",
          "indices": "*,blogs",
          "took": 12050,
          "timed_out": false,
          "_shards": {
            "total": 3,
            "successful": 3,
            "skipped": 0,
            "failed": 0
          }
        },
        "remote2": {
          "status": "skipped",
          "indices": "blogs,web_traffic",
          "timed_out": false,
          "failures": [
            {
              "shard": -1,
              "index": null,
              "reason": {
                "type": "index_not_found_exception",
                "reason": "no such index [web_traffic]",
                "index_uuid": "_na_",
                "resource.type": "index_or_alias",
                "resource.id": "web_traffic",
                "index": "web_traffic"
              }
            }
          ]
        },
        "remote1": {
          "status": "successful",
          "indices": "blogs",
          "took": 11755,
          "timed_out": false,
          "_shards": {
            "total": 3,
            "successful": 3,
            "skipped": 0,
            "failed": 0
          }
        }
      }
    },
…
In the above example, you’ll see that the remote cluster called “remote2” was skipped because it does not have the web_traffic index. As before, remote clusters can be skipped when they have the skip_unavailable setting set to true in the Remote Clusters screen in Stack Management.
The status of the search on each cluster can be running, successful, partial, skipped, or failed. Where applicable, you’ll be able to see how long each cluster took and how many shards finished searching and/or failed.
To see this extra information in Kibana, use the Inspect feature to View: Requests and then click the Response tab:
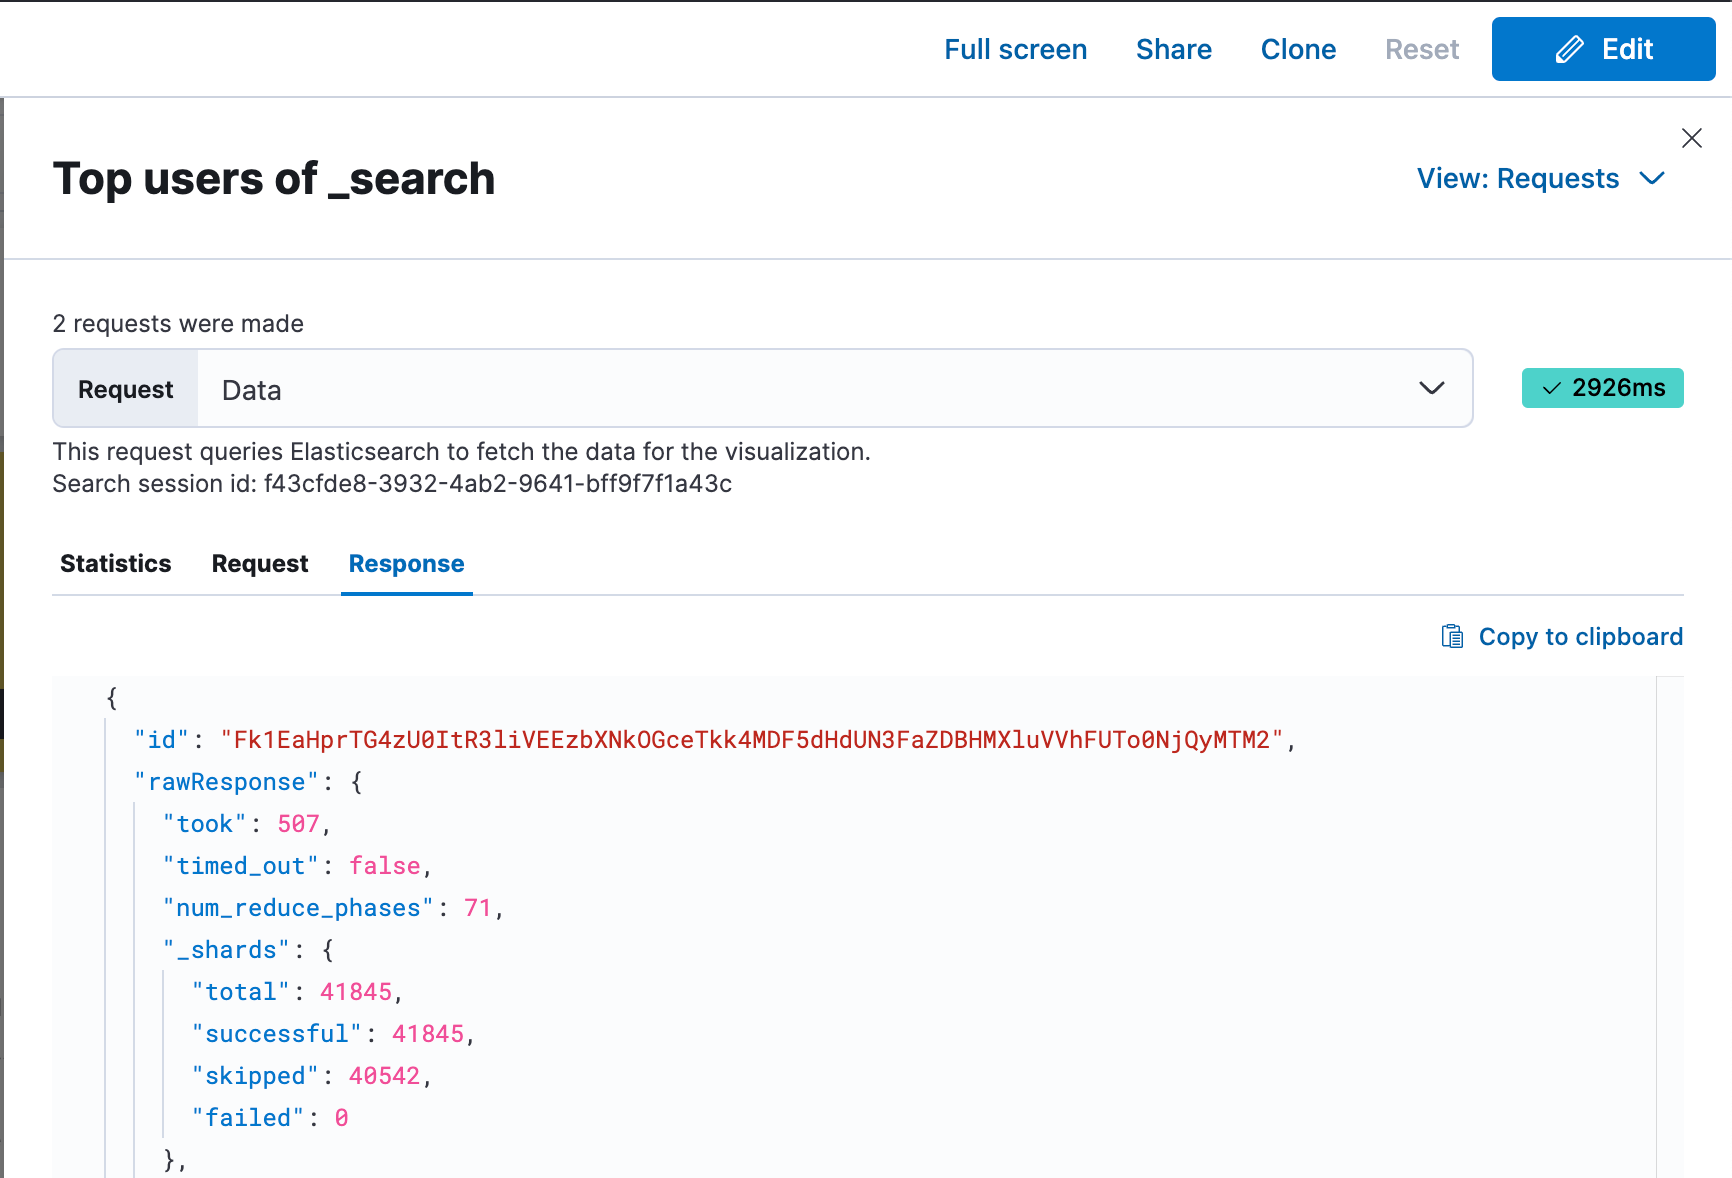
We are looking to expose this additional information more prominently within the Kibana UI in future releases.
Exclude clusters from a cross-cluster search
So, what if one of the remote clusters is having a bad day, taking a long time to respond or providing shard errors in your cross-cluster search? Just like you could already exclude indices with minus notation, now you can exclude remote clusters the same way.
For example:
POST logs*,*:logs*,-remote4:*,-remote1*:*/_async_searchThis would result in searching all remote clusters except for remote4 and remote1, remote11, remote12, remote13, etc . . . Note that you must use a wildcard in the index name position when excluding remote clusters.
You can still exclude a subset of indices on remote clusters. To exclude the logs-002 index on remote5:
POST logs*,*:logs*,-remote4:*,-remote1*:*,remote5:-logs-002/_async_searchNew security model to connect remote clusters
Cross-cluster search (CCS) and cross-cluster replication (CCR) rely on the underlying connection to a remote cluster. This connection is secured to guarantee that malicious users cannot get arbitrary access to data.
In Elasticsearch 8.10 we’re introducing the beta release of a new security model, with authentication and authorization based on API keys. Cluster administrators now have even more security and flexibility in defining access control policies to their data: they can restrict access to different sets of indices for each individual cluster, and they can ensure better security in the unpleasant scenario where a remote cluster has been compromised.
2048 dimensions kNN search GA
Elasticsearch has supported HNSW based kNN vector search for vectors with up to 2048 dimensions (float 32 or byte sized) but only made it GA to search vectors of up to 1024 dimensions, keeping vectors of 1025 to 2048 in tech preview. In 8.10, we are making kNN vector search GA for vectors of up to 2048 dimensions.
The reason behind the delayed GA is that we wanted to implement a long term solution in Lucene that will support a custom number of dimensions. We strongly believe in having Lucene be the best infrastructure for search in general and for vector search in particular, and we would rather contribute to that than develop it outside of Lucene. We didn’t tackle any scalability issues with increasing the dimensionality, but it took some time and effort to get a consensus on that. We were fine releasing this capability in tech preview before that, since we knew we wanted to support it one way or the other, but we wanted a way that we are confident will work long term in Lucene before we made it GA. We will look into increasing dimensionality even further if the need rises.
Vector search concurrency improvement
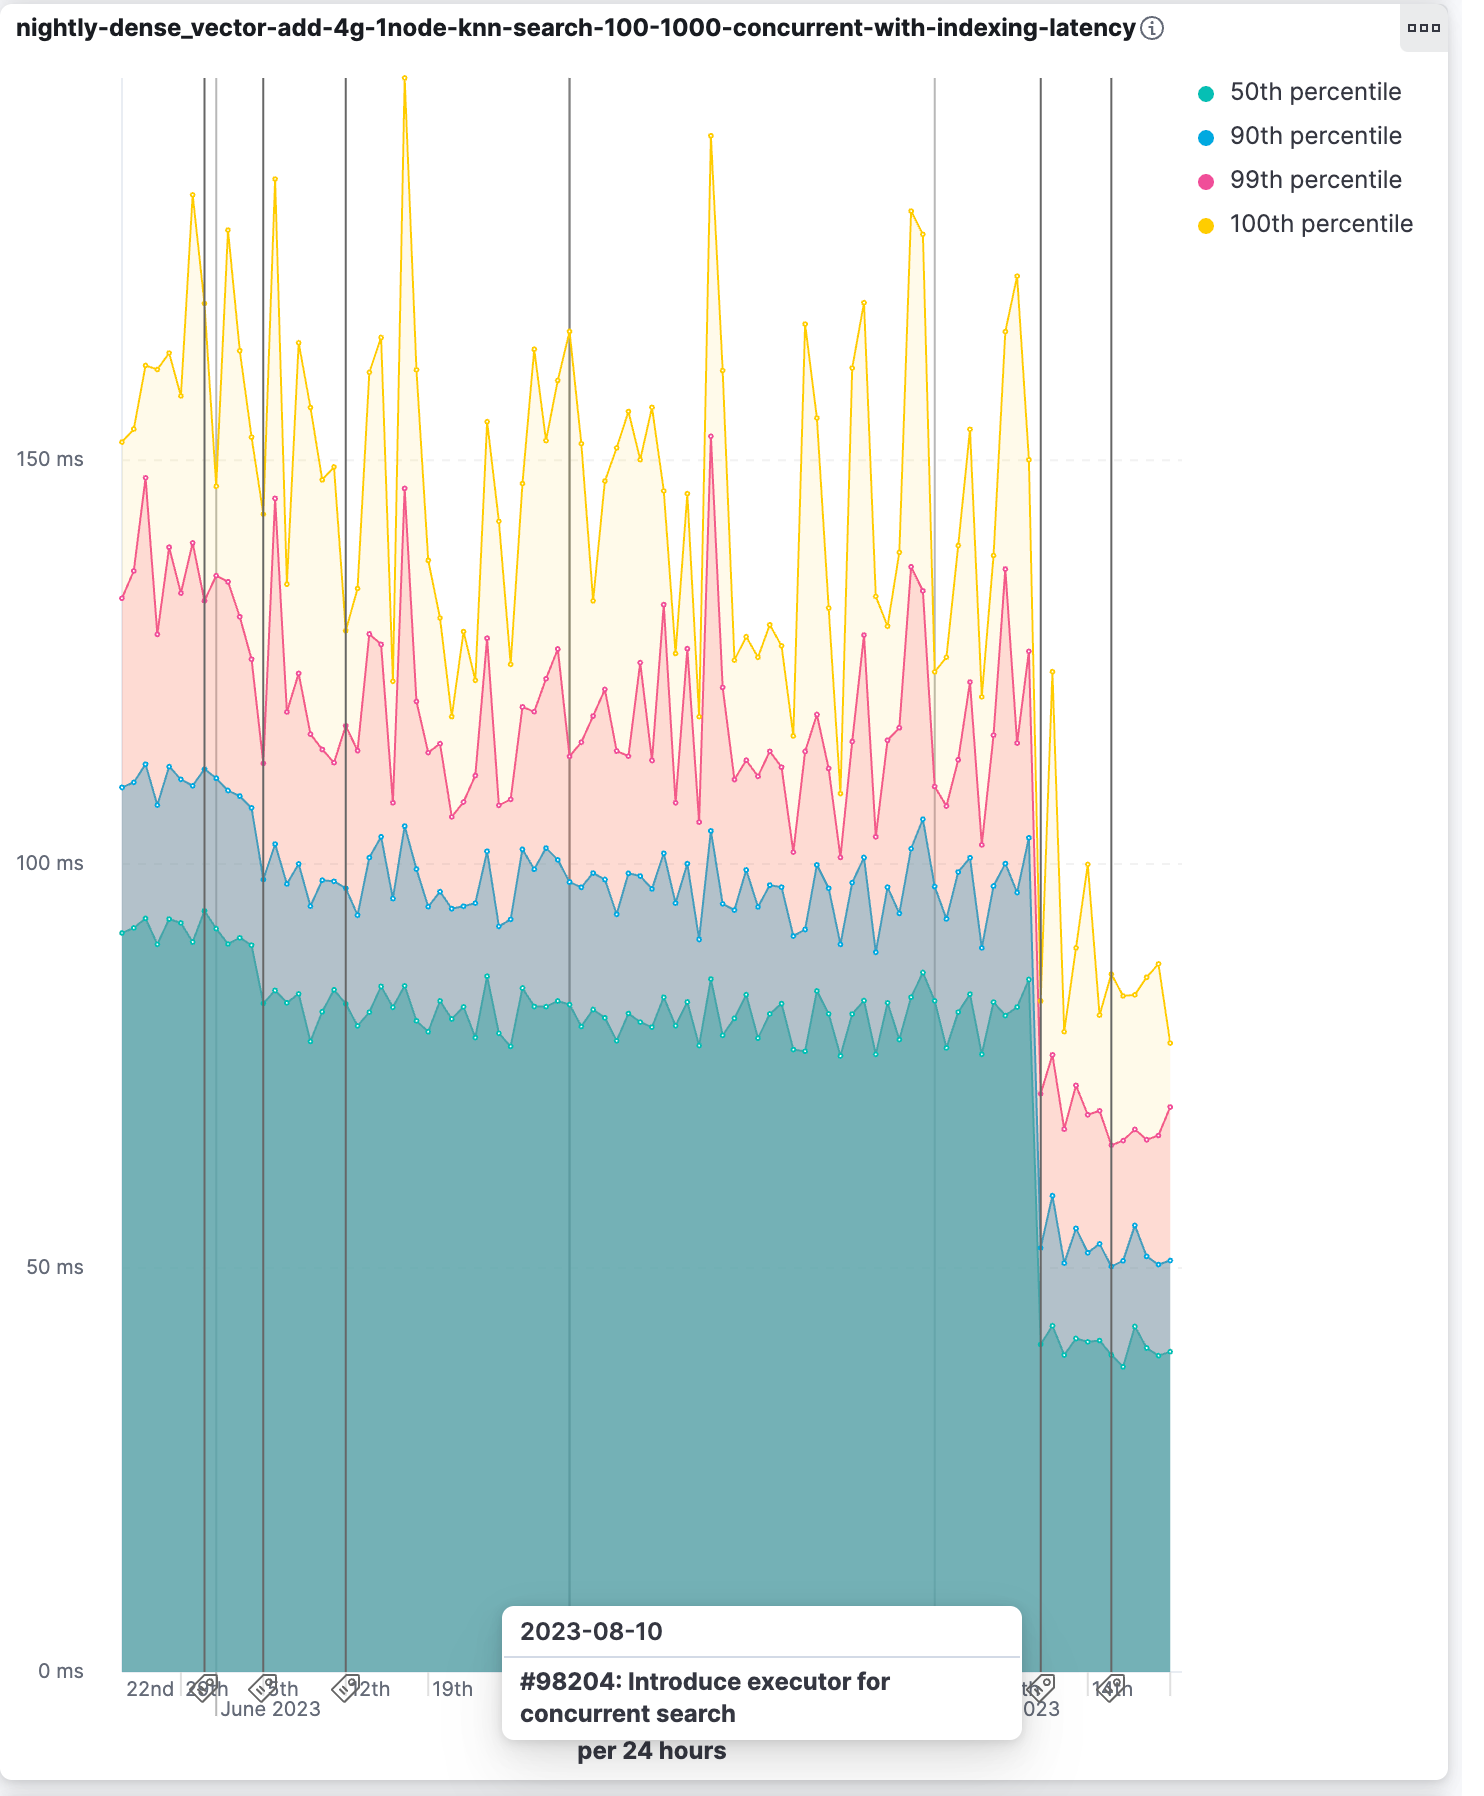
We have been asked in the past to improve the parallelization of queries (e.g., #80693). Our approach was focused on parallelization when running multiple queries concurrently (i.e., optimizing for high query throughput). That meant we focused less on parallelization of a single query. We recently realized that in certain usage patterns, it is advantageous to parallelize each query. In 8.10, we start that by parallelizing kNN vector search.
Up until now, a query would get at most one thread per shard. From 8.10, Elasticsearch will allocate up to a thread per segment in kNN vector searches, if there are sufficient available threads in the threadpool. This is particularly significant in HNSW based kNN vector search, when there are many segments and available hardware. We have seen query latency drop from 96ms to 50ms per query in our nightly benchmark.
Explain log rate dips
In 8.10, we continue enhancing Elastic’s AIOps capabilities, aiming to offer increasingly smarter tools for actionable observability. Previously, you could detect and analyze log rate spikes using our log rate analysis functionality. In 8.10, we are adding the ability to do the same for dips. As a result, you can now investigate and explain changes in both directions.
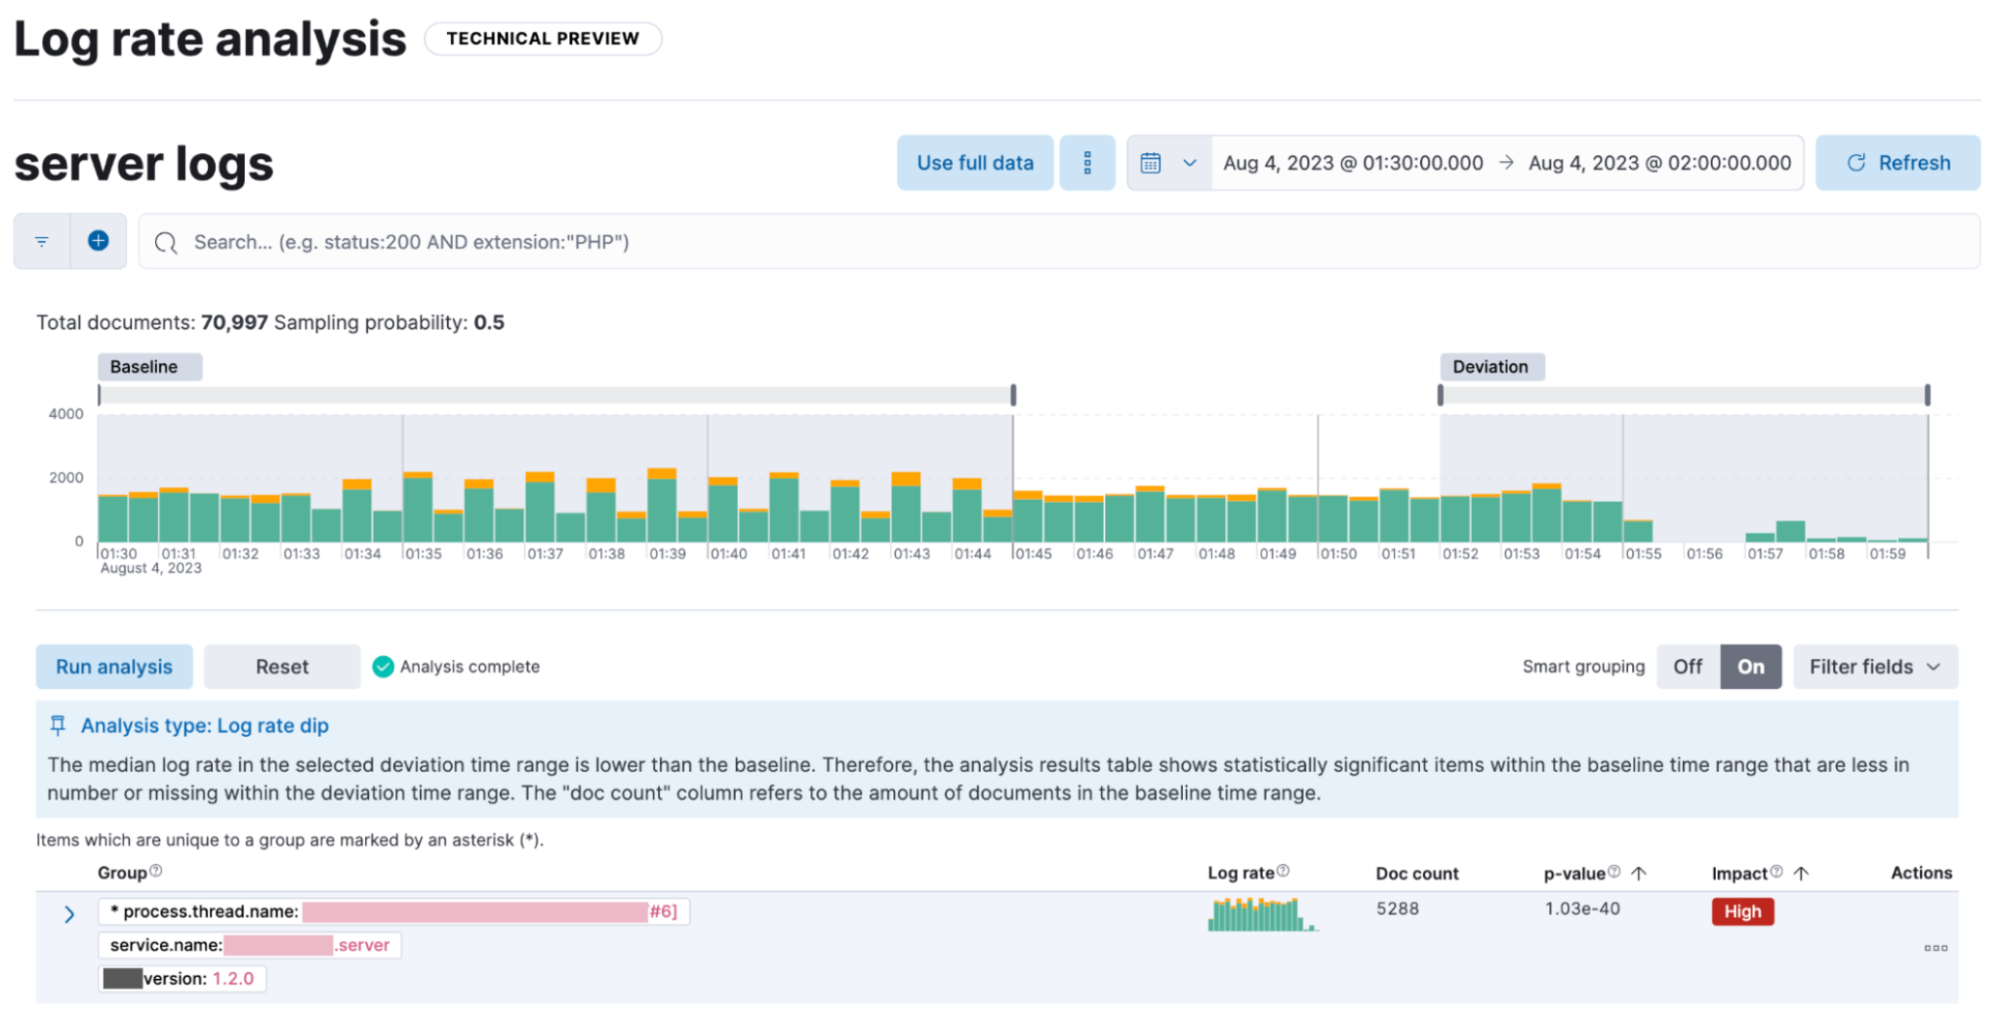
Log rate analysis helps you explain log rate dips and spikes by identifying field-value pairs that display a statistically significant deviation (i.e., decrease for dips and increase for spikes) in the selected time range, compared to their baseline occurrence. Users can adjust the selected baseline and deviation time range, and they can optionally use the field grouping option, which displays together the deviating fields that tend to co-occur. The UI offers a measure of how extreme the change appears to be (the p-value). Log rate analysis can help move from simply detecting changes to correlating events and identifying root causes in just a few clicks. In 8.10, this capability is in technical preview.
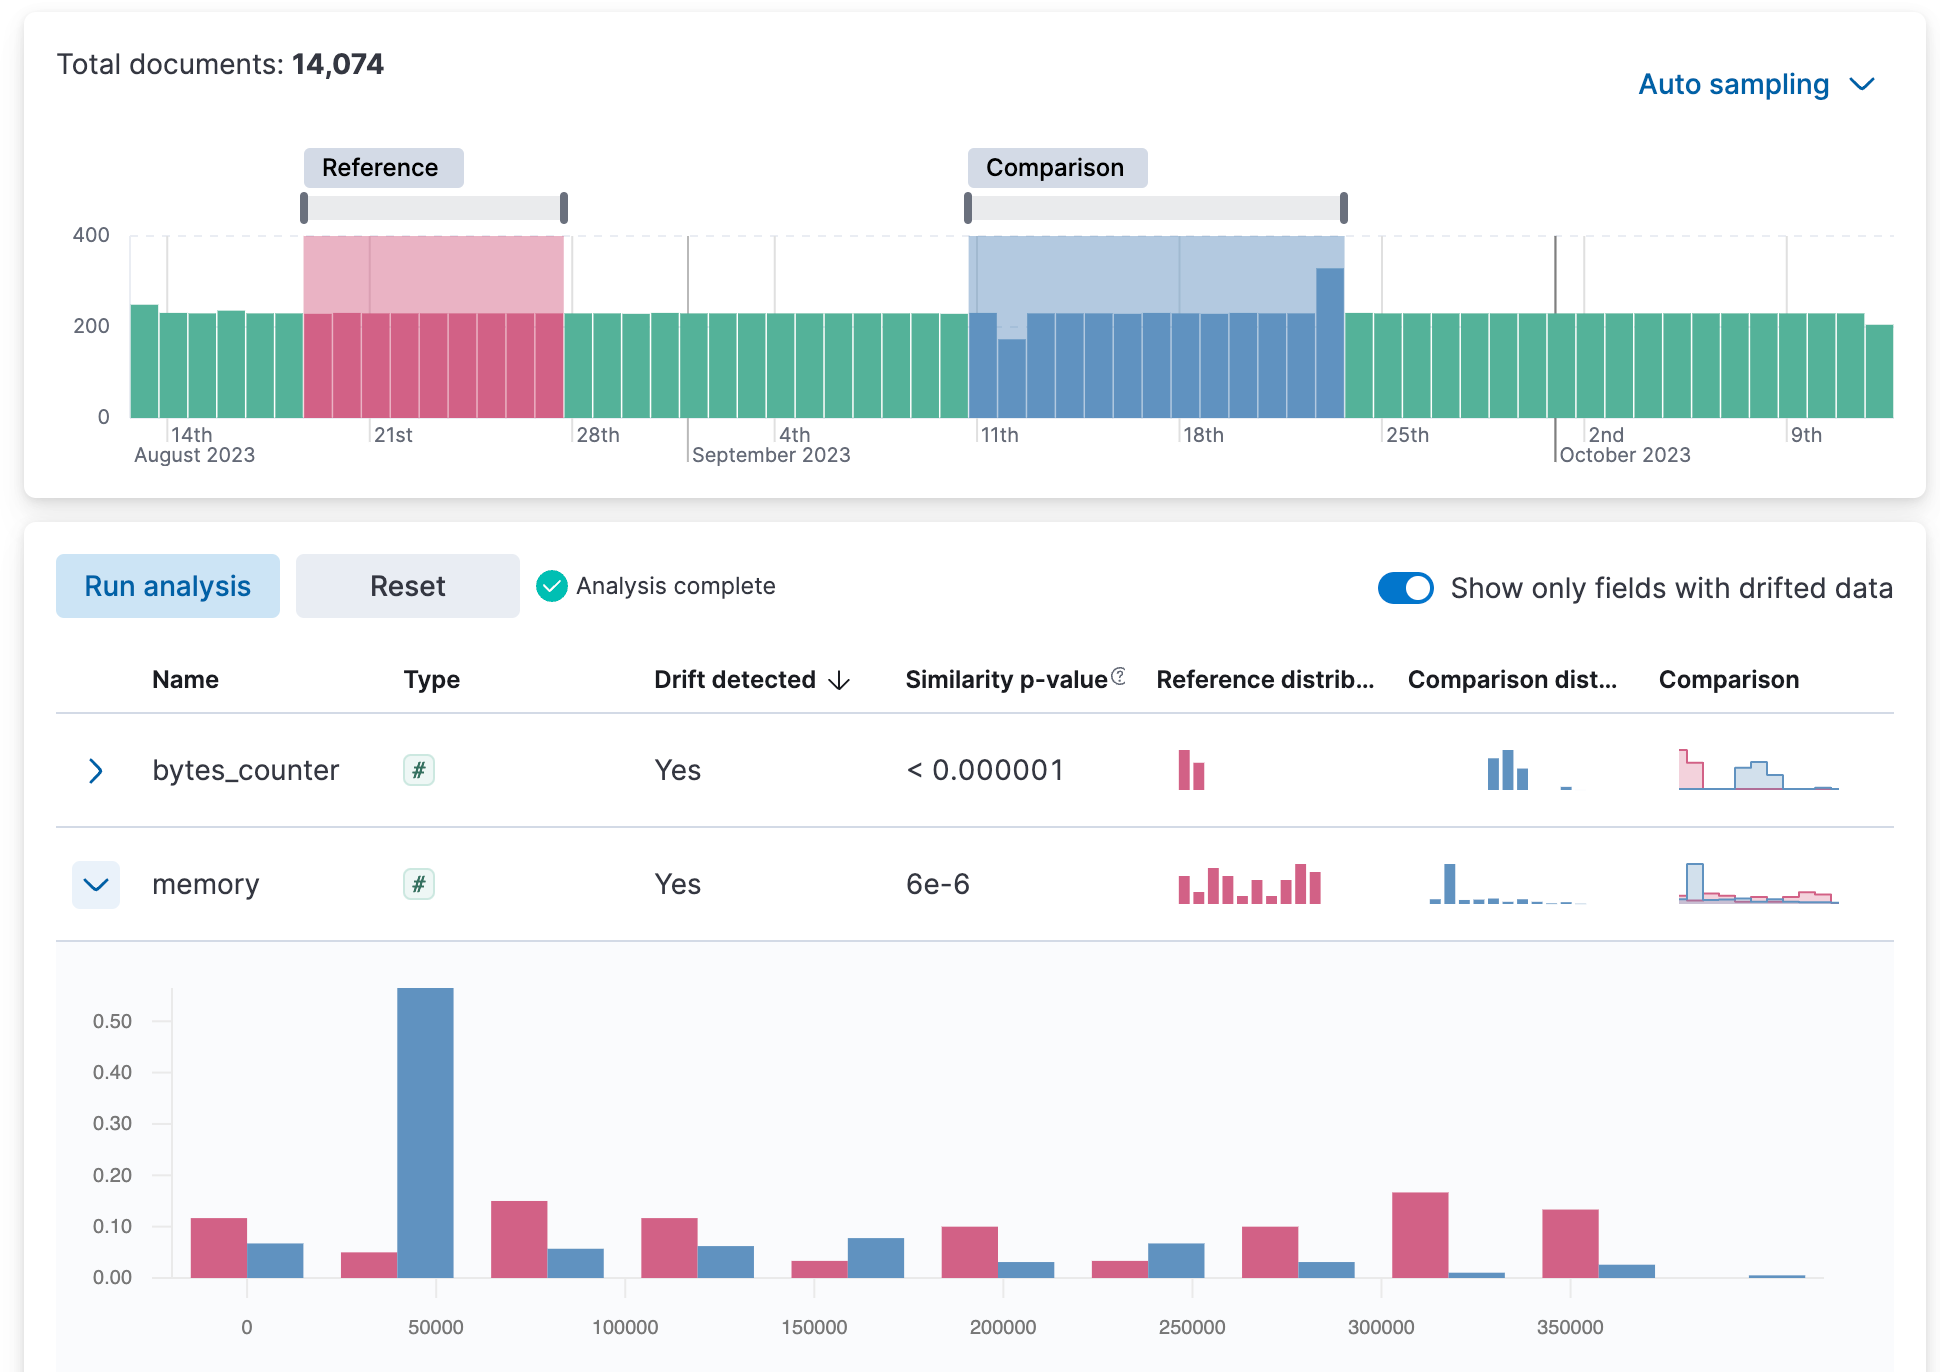
Data Comparison view
Data drift is one of the most important considerations in practical, real-world machine learning. Given enough time, the statistical properties of your data sets are expected to sustain a certain level of change. This is because both the data sources and your infrastructure that collects the data are dynamic. An important implication is that if in the past you have trained models on data that have drifted since, these models are now making predictions optimized for a world that has changed. In other words, a certain level of data drift is inevitable and it may eventually impact your model’s performance negatively.
In 8.10, we are introducing the Data Comparison view in the ML Data Visualizer menu to help you detect data drift. Choose a Reference and a Comparison time range on the UI and run the data comparison to see if there is a significant change of values, and for which numerical and categorical fields. The UI gives you a measure of how strong the change appears to be (the p-value) for each field and a side-by-side visual comparison of the reference and comparison distributions. By expanding each field in the results list, you can see the details of the distribution of values for the Reference and Comparison windows. In 8.10, this capability is in technical preview.
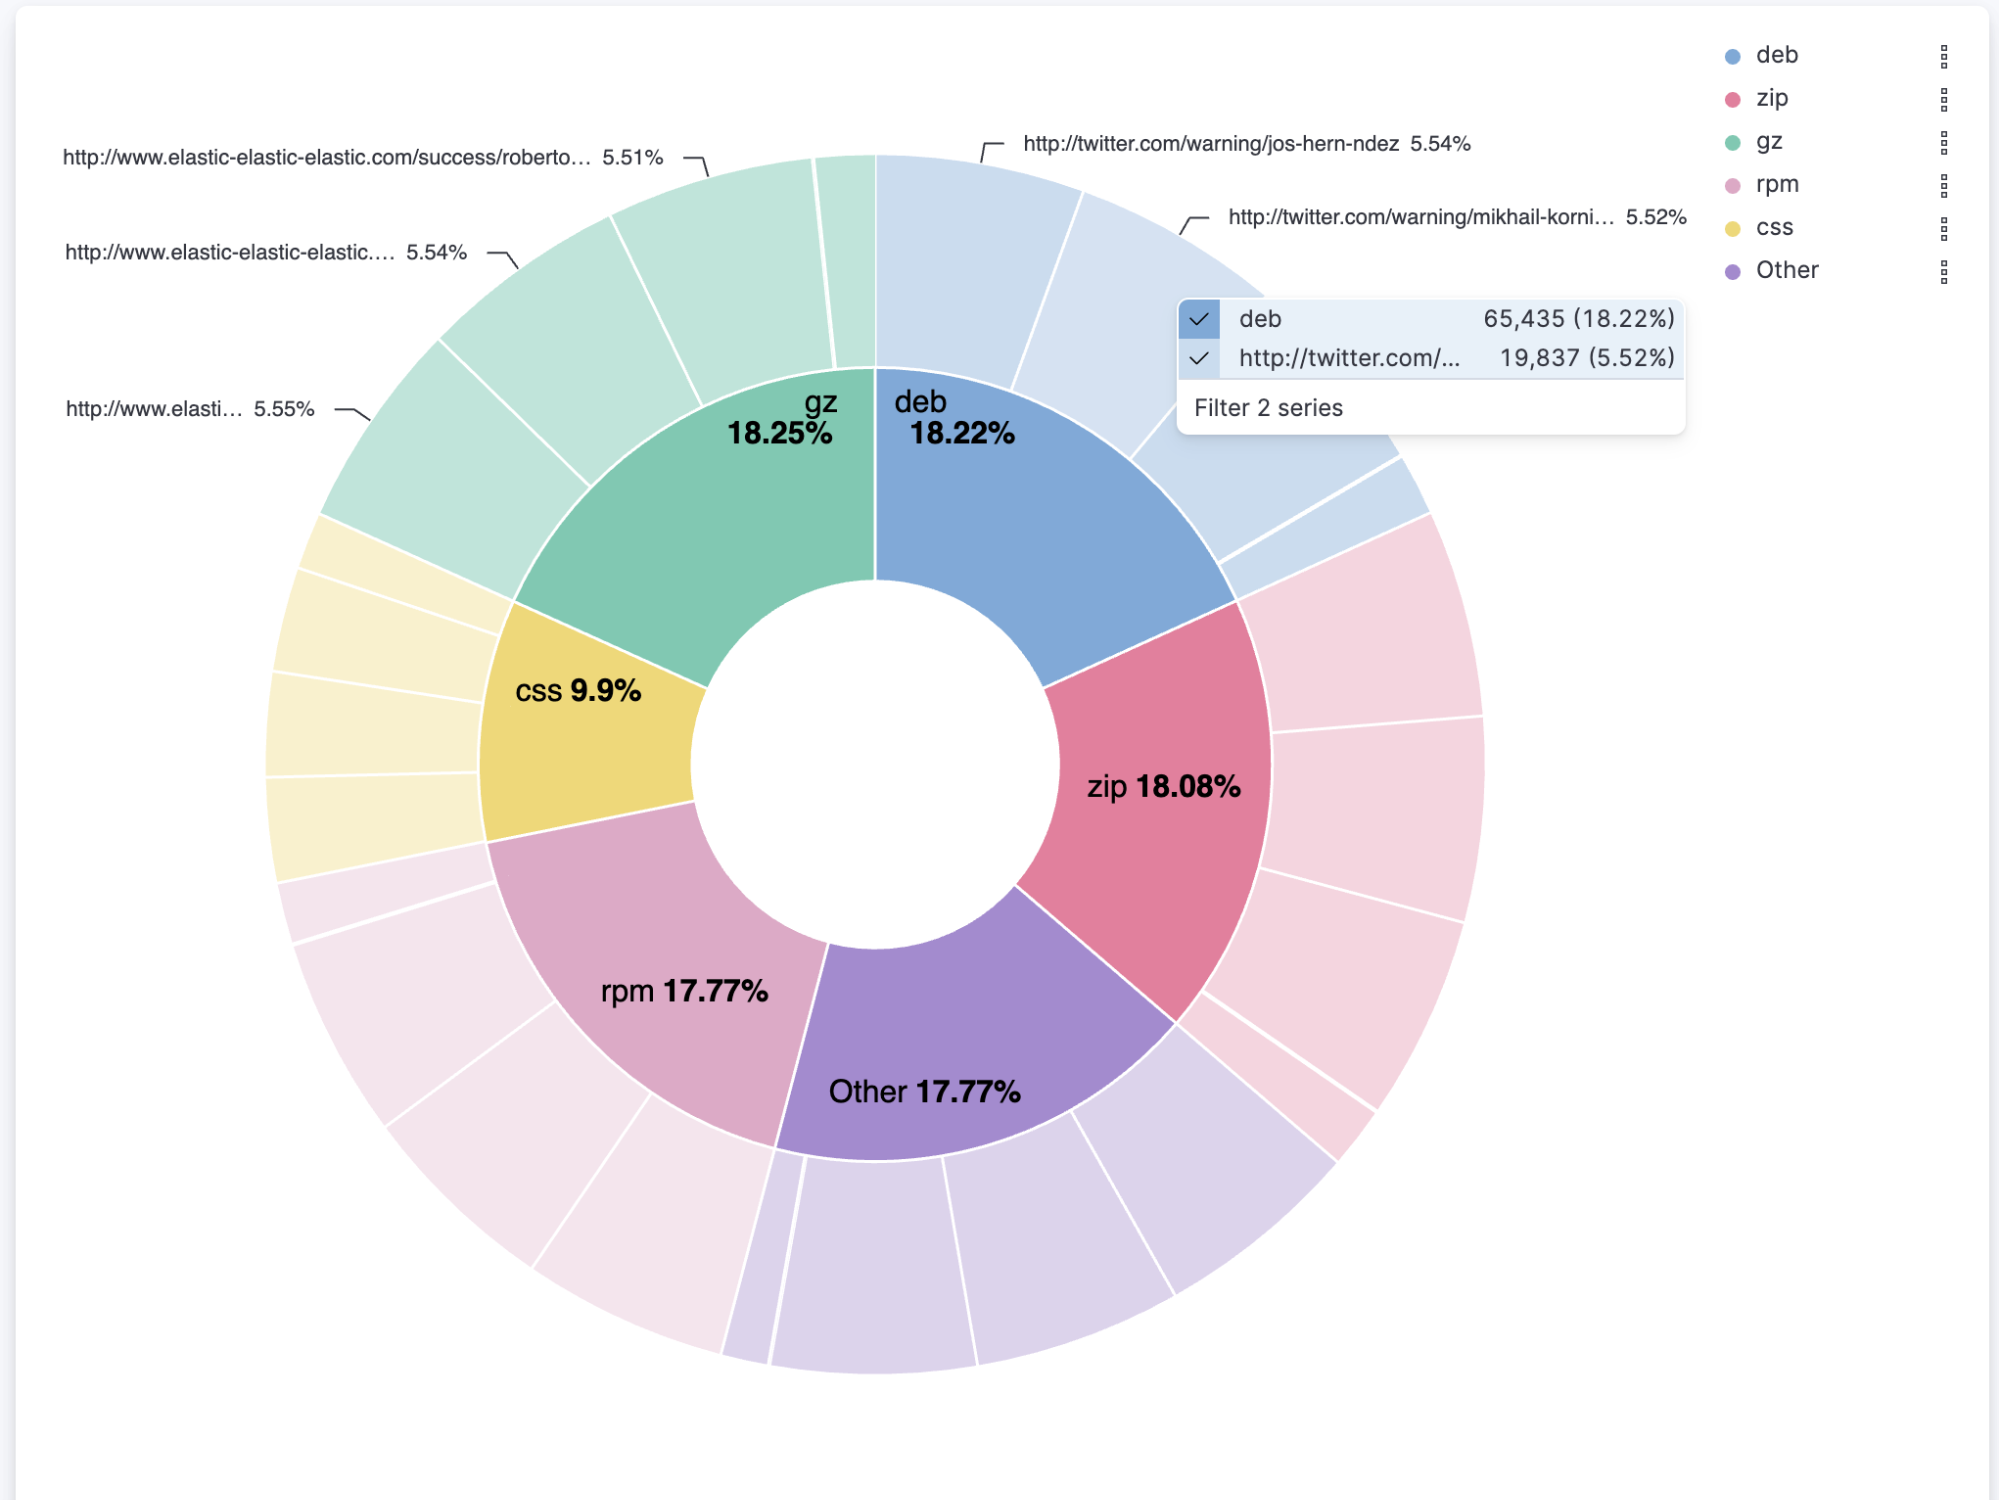
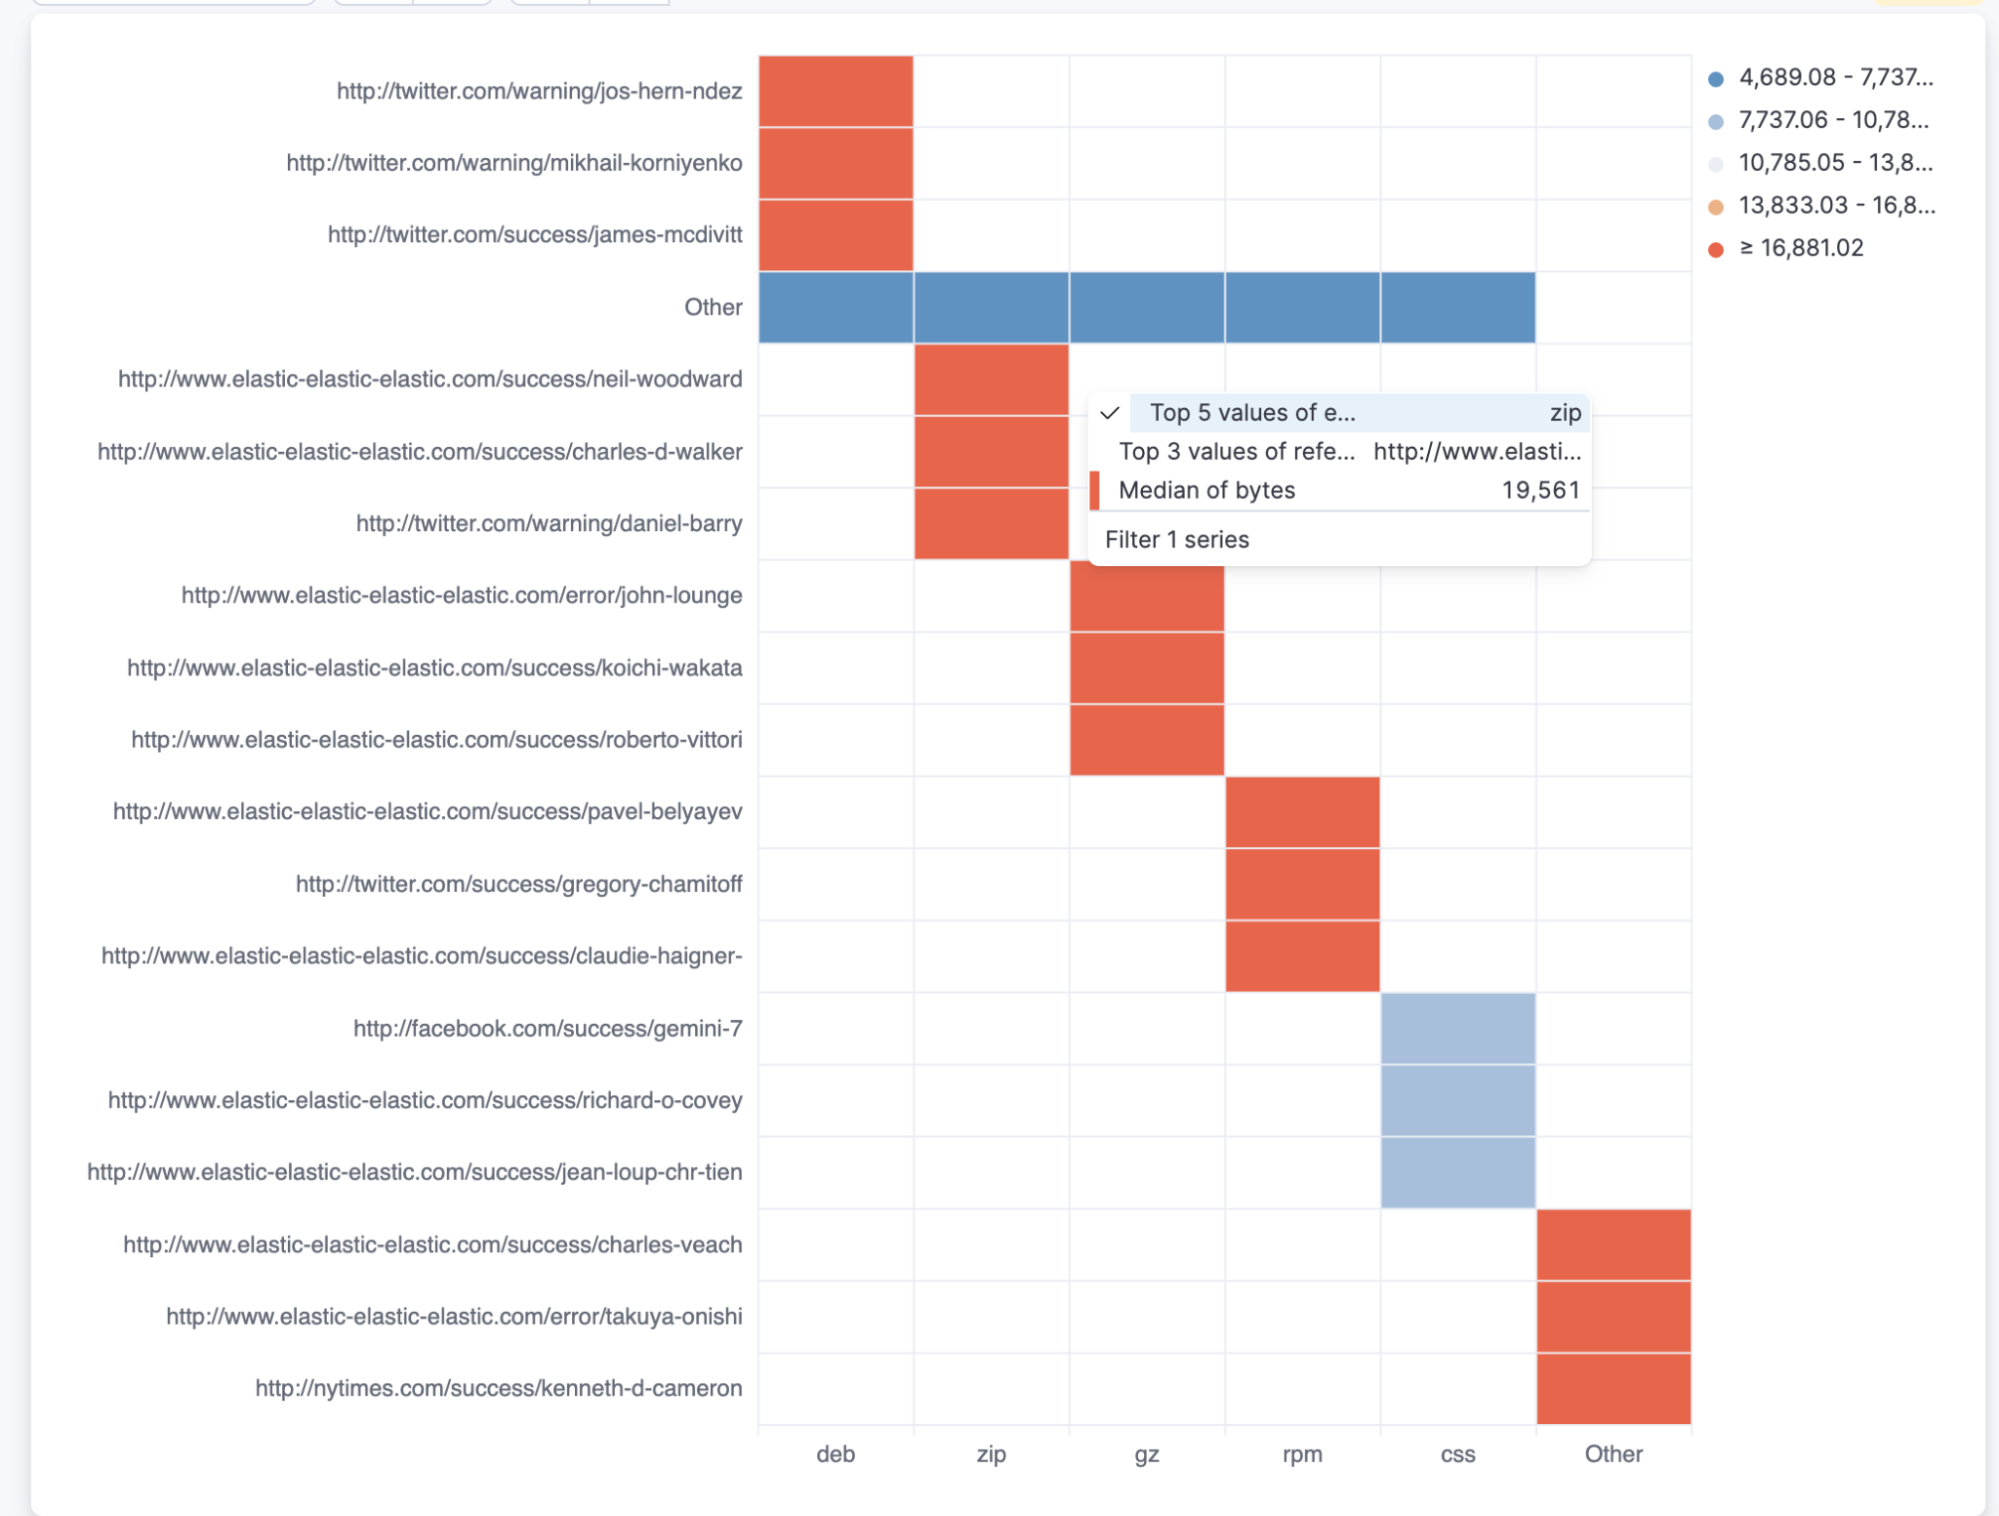
Multivalue filtering using tooltip actions
Multivalue filtering using tooltip actions is already enabled for XY charts, and we are now enabling it for heat maps and partition charts. You can now filter these by multiple values at the same time, making it easier to find the insights you're looking for in your data.
For example, you can filter a heat map by both region and country. You can also filter a partition chart by both product and date.
To use multivalue filtering, right click on the chart to show the tooltip menu. Then select the values you want to filter by, and click on "Filter X Series." We will continue to add support for multivalue filtering for other types of charts in the future.
Multivalue filtering via tooltips on a partition chart:
Multivalue filtering via tooltips on a heatmap:
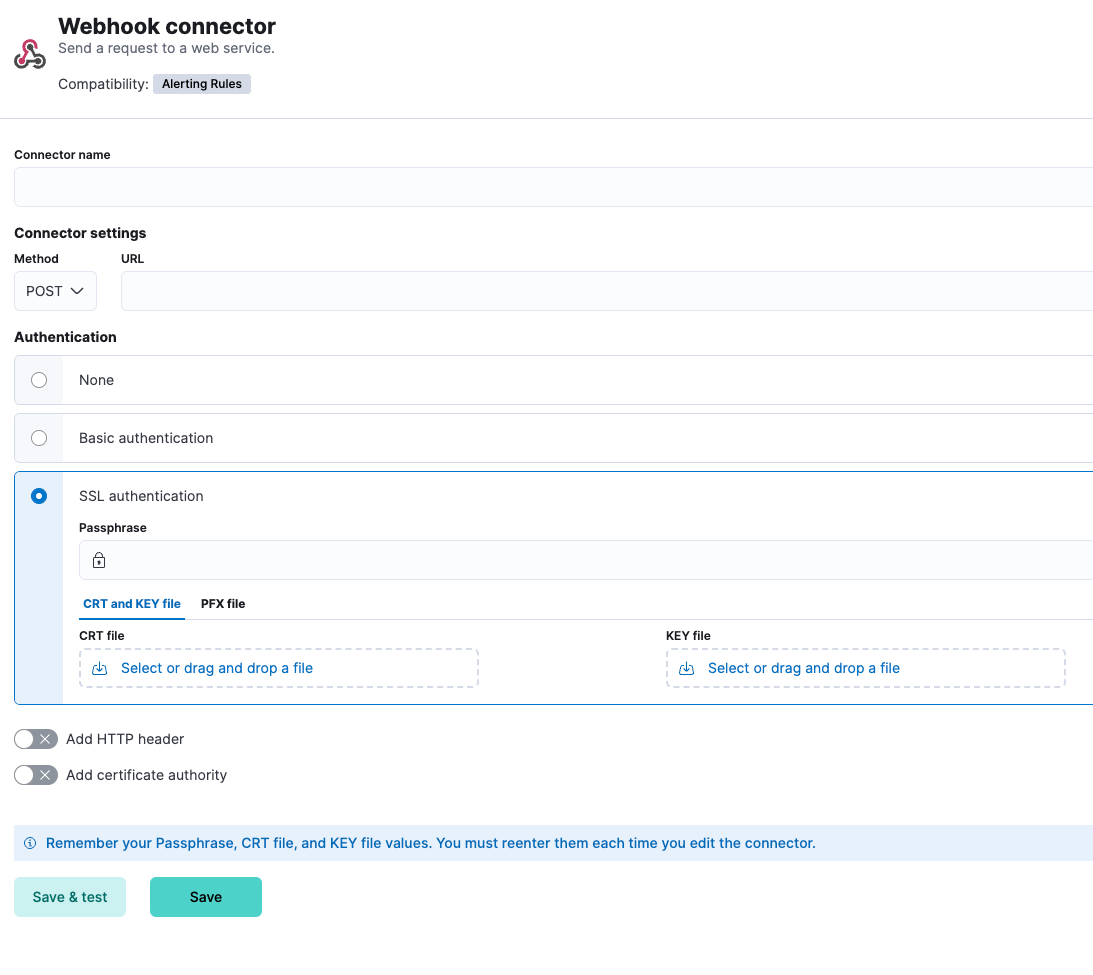
Webhook connector improvement
It’s common for organizations to integrate with third parties using secured authentication. Currently, most of the available connectors are based on basic authentication (user and passwords or tokens), which might be not sufficient and might violate organization security policies. With this release, the Webhook connector is enhanced to support client certification, so users can leverage the webhook connector for secured integration with third parties.
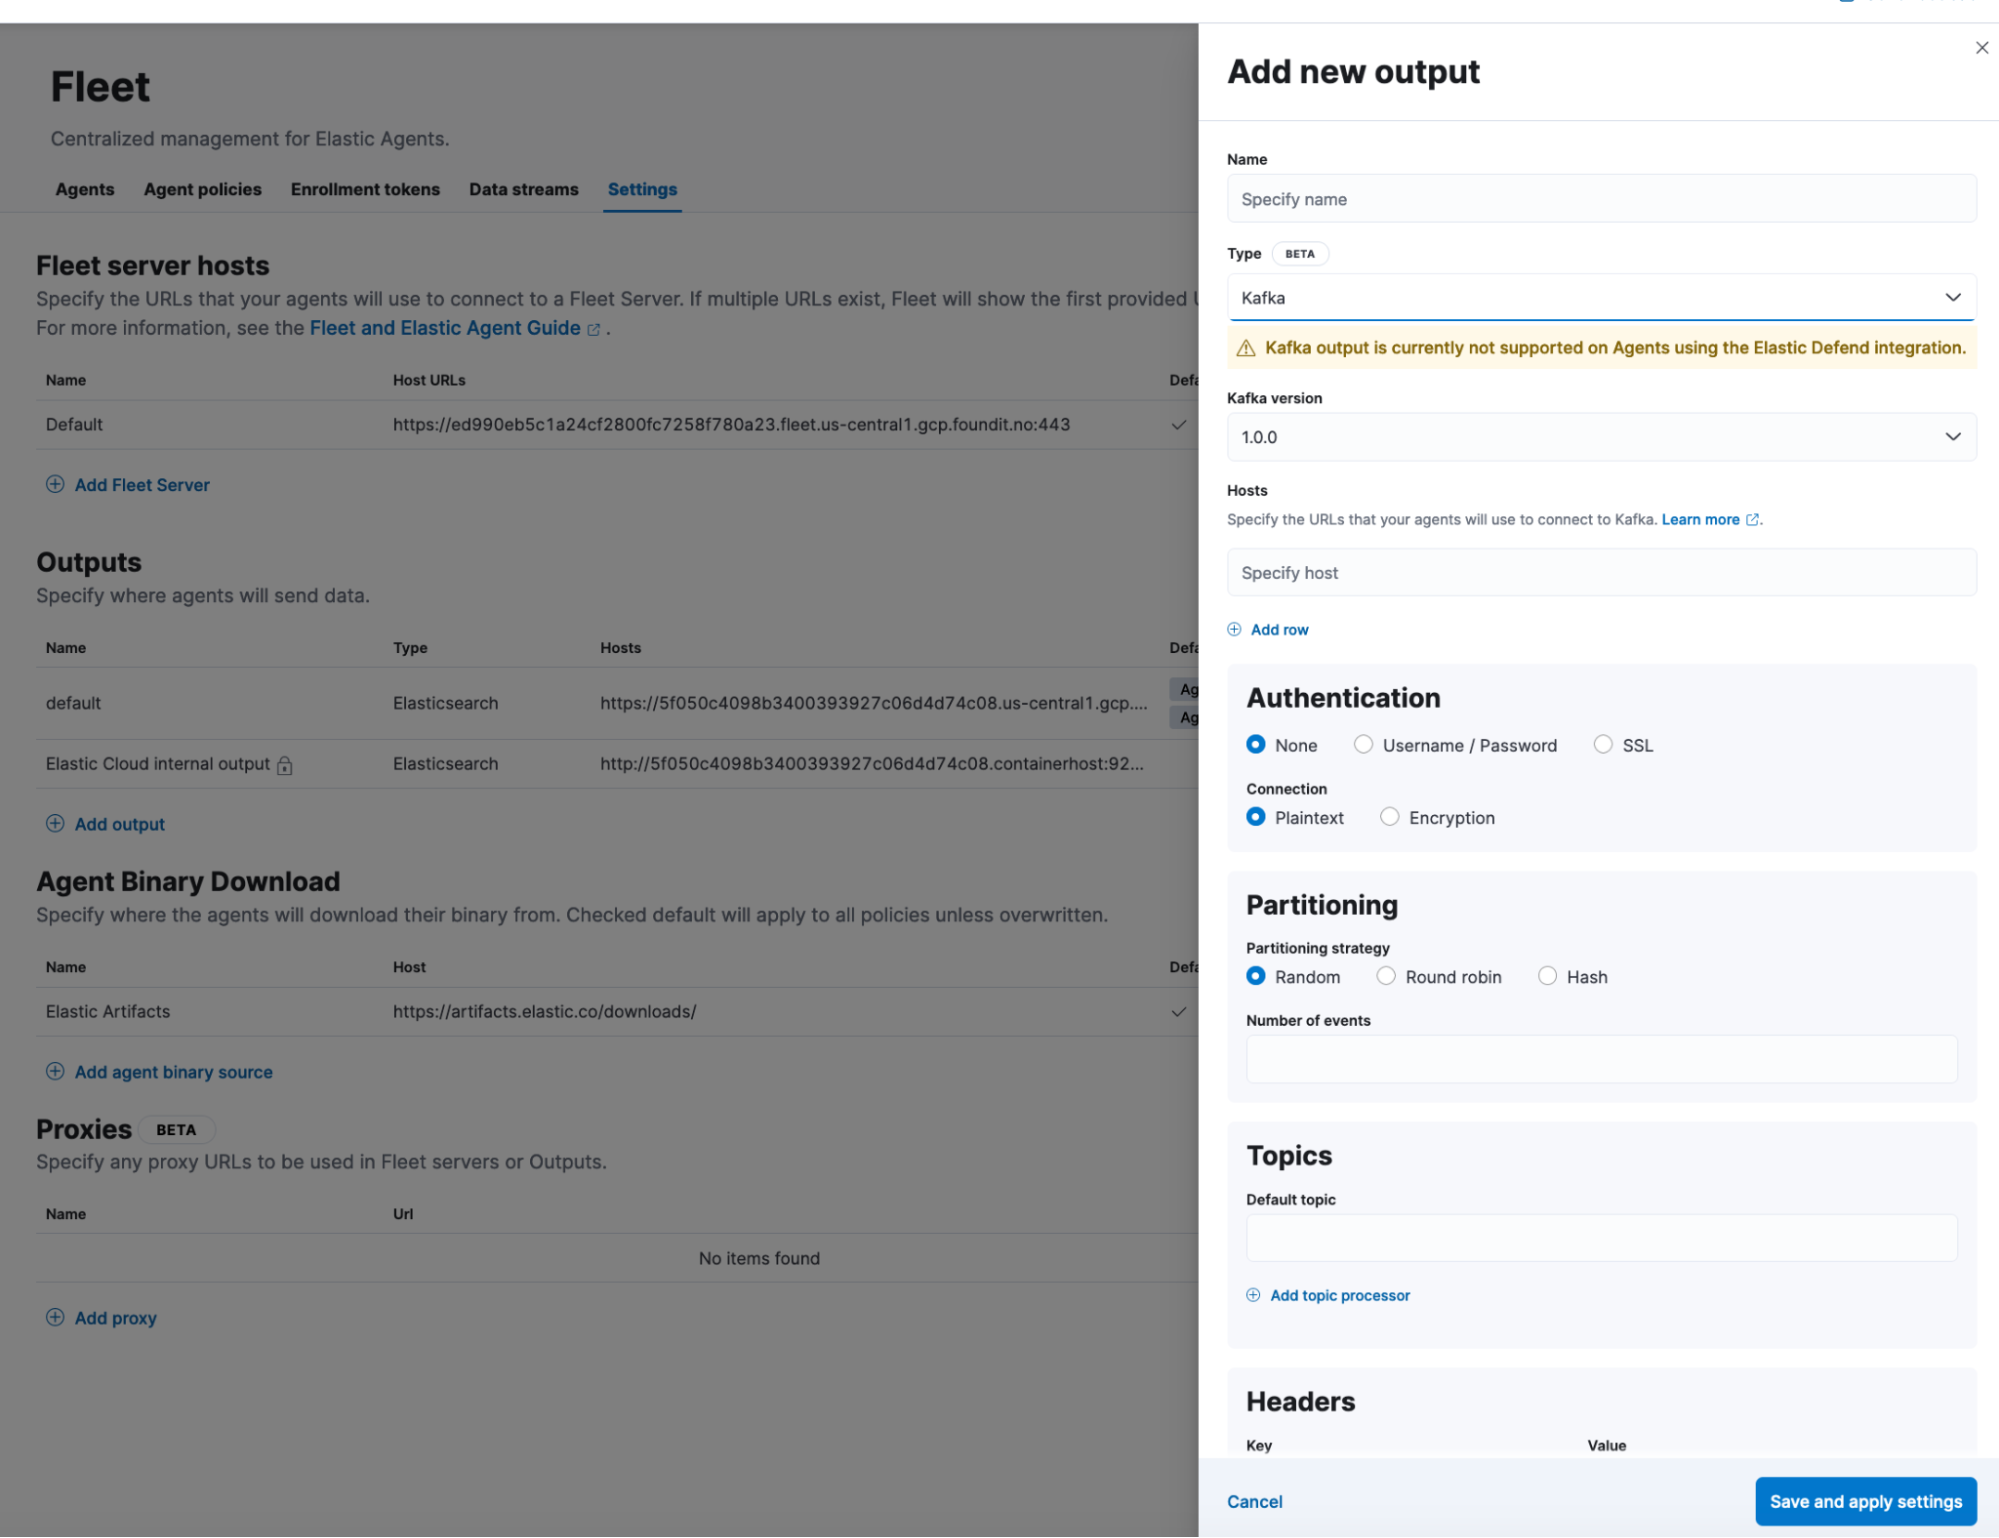
Benefit from Kafka output support for Elastic Agent
Elastic Agent users will now be able to stream their data to Kafka for further processing, available in Beta. Kafka is used to build real-time streaming data pipelines. Users will now be able to use Elastic Agents to stream their application data to a Kafka broker and take advantage of its resilience and storage capabilities.
Synonyms API
The new synonyms API enables administrating the synonyms with simple API calls to the cluster. It does away with the need to manage synonym files, to update the complete synonym file, or to distribute it to the different nodes. Needless to say there is no interruption to service when updating synonyms. Perhaps the most important thing is that it is easy to create, read, update, and delete a single synonym set. Synonyms are a vital mechanism for relevance ranking and oftentimes they are the most important option for subject matter experts to influence search and relevance ranking. At this stage, we are introducing the synonyms API under Beta status, and we tentatively aim to make it GA in the near future.
Wait . . . there’s more!
Check out which other enhancements in Search, Observability, or Security may be relevant to you from the 8.10 release announcement blog! And find additional information on aforementioned features in What’s New in 8.10 Elasticsearch and What’s New in 8.10 Kibana. Finally, the release notes will provide you with the complete list of all enhancements Elastic 8.10 delivers.
Try it out
Existing Elastic Cloud customers can access many of these features directly from the Elastic Cloud console. Not taking advantage of Elastic on cloud? Start a free trial.
The release and timing of any features or functionality described in this post remain at Elastic's sole discretion. Any features or functionality not currently available may not be delivered on time or at all.
Share
- Share on Twitter
Share on Twitter
- Share on LinkedIn
Share on LinkedIn
- Share on Facebook
Share on Facebook
- Share by Email
Share by Email
- Print this page
Print