Elastic 7.11 released: General availability of searchable snapshots and the new cold tier, and the beta of schema on read
We are pleased to announce the general availability (GA) of Elastic 7.11. This release brings a broad set of new capabilities to our Elastic Enterprise Search, Observability, and Security solutions, which are built into the Elastic Stack — Elasticsearch and Kibana. This release enables customers to optimize for cost, performance, insight, and flexibility with the general availability of searchable snapshots and the beta of schema on read.
The beta of a new web crawler in Elastic Enterprise Search makes content from publicly accessible web sites easily searchable. Elastic Observability delivers enhanced root cause analysis, troubleshooting, and application observability with service health and host detail views. New prebuilt detection rules and machine learning jobs and customizable alert notifications in Elastic Security improve detection and remediation, and a unified analyst workspace streamlines SecOps.
We are also announcing key improvements to Elastic Cloud, the best managed Elastic service and the only one that includes our solutions. Elastic Cloud offers rich support for searchable snapshots, autoscaling of data and machine learning nodes, and increased availability and better search performance with enhanced cross-cluster replication (CCR) and cross-cluster search (CCS). Elastic 7.11 is available now on Elastic Cloud — the only hosted Elasticsearch offering to include all of the new features in this latest release. You can also download the Elastic Stack and our cloud orchestration products, Elastic Cloud Enterprise and Elastic Cloud for Kubernetes, for a self-managed experience.

As previously announced, Elastic is changing the licensing options for Elasticsearch and Kibana with the 7.11 release. We are moving the Apache 2 licensed code to be dual licensed under both the Elastic License and SSPL. We have also made significant updates to the Elastic License to simplify it and make it more permissive. Our distribution and the source code for all of our free and paid features are available under the Elastic License v2, with the source code of a core set of our free features also available under SSPL v1. This change does not impact any of our customers or the vast majority of our community.
Read on for the key release highlights. To get the full feature rundown, dive into the individual solution and product blog posts.
Elastic Stack
Retain and search more data with searchable snapshots on low-cost object stores and the new cold data tier.
Searchable snapshots let you search across data in snapshots stored on low-cost object storage such as AWS S3, Microsoft Azure Storage, and Google Cloud Storage, transforming how you can balance storage costs, search performance, and depth of insight from the data in your Elasticsearch cluster. Searchable snapshots can significantly reduce storage costs; they support a new cold tier capability, which is now generally available and also available in Elastic Cloud, cutting infrastructure costs by up to 50% with minimal performance impact.
Leverage schema on read with runtime fields, giving you the choice of flexibility and cost efficiency with schema on read or blazing fast performance with schema on write, all in one stack.
Runtime fields give you the ability to define the schema for your index at query time. This new capability, in beta in 7.11, allows you to discover new data and new workflows by creating a schema on the fly, giving you unprecedented flexibility to find new insights while choosing how to trade off cost and performance.
Elasticsearch is known for being a blazing fast distributed search and analytics engine because data is stored in structured indices created when data is written to disk, or schema on write. This organized structure requires understanding and planning for how data will be represented in Elasticsearch, but the big payoff is speed, scale, and relevance. But there are times when you need a way to explore and examine data in a new way without planning the data schema in advance. Create fluid data structures at the time of search with schema on read using runtime fields. This flexibility reduces the time to first insight, but with some trade-off on overall performance. The Elastic approach gives you the agility to choose between schema on write and schema on read based on your search scenario.
Runtime fields are initially supported in Elasticsearch with this release, and we plan to extend support throughout Kibana. Schema on Read is in beta in 7.11. Read more about it in the dedicated runtime fields blog.
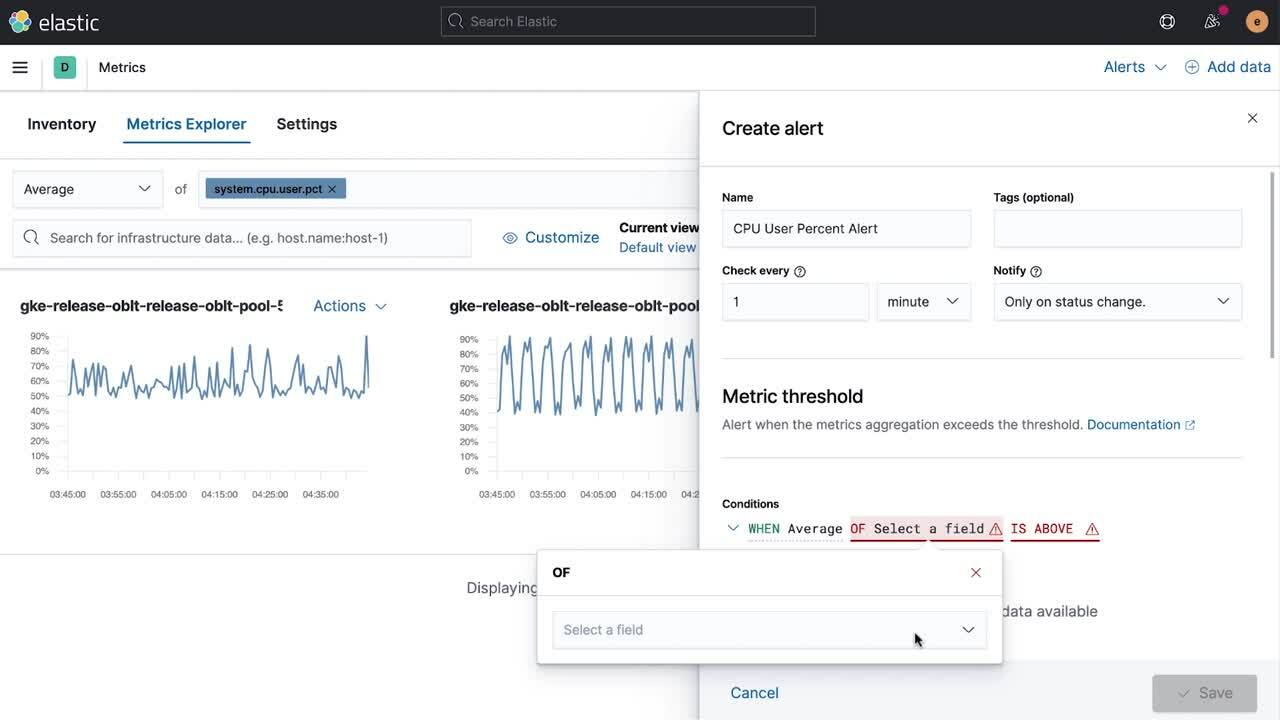
Create, manage, and monitor alerts and notifications across the Elastic Stack and external systems with a new generally available alerting framework.
Knowing when something important is happening within your digital ecosystem is mission-critical regardless of the kind of work you do. From threat detections to application performance warnings and to physical asset tracking, receiving timely alerts when a major change occurs is critical to acting on data insights. Eight months ago we launched the beta of a new alerting framework to do exactly this inside of the Elastic Stack, and, with the release of 7.11, this new alerting framework is generally available.
We have seen tremendous community enthusiasm and adoption during the beta, which has reinforced our commitment to building a framework that is deeply integrated into every solution within the Elastic Stack, easy to manage centrally, and focused not only on supporting detection, but also driving action and integrating Elastic directly into your workflows. The alerting interface is incorporated directly into the Elastic Security and Elastic Observability solutions, and we have expanded the framework to include third-party alert integrations with platforms like PagerDuty, ServiceNow, and Microsoft Teams. Alerts can be easily governed using role-based access controls.
Read about these features and more in the Kibana 7.11 blog and the Elasticsearch 7.11 blog.
Elastic Enterprise Search
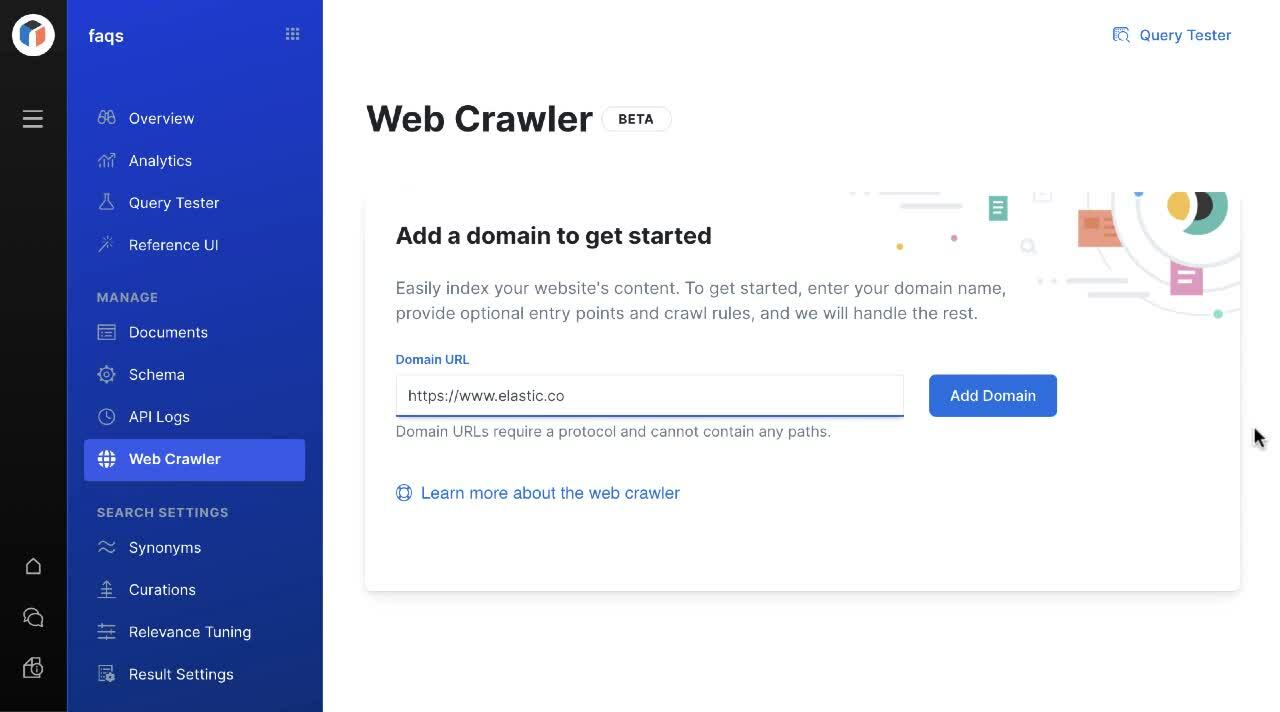
Make content from publicly accessible web sites easily searchable with the new web crawler for Elastic App Search.
Making content searchable takes many forms. Elastic App Search already lets users ingest content via uploading or pasting JSON and through API endpoints. With Elastic Enterprise Search 7.11, users can now ingest content with a powerful web crawler that retrieves information from publicly accessible web sites, making content easily searchable in your App Search engines. As with any ingestion method on App Search, the schema is inferred upon ingestion and can be updated in near real time with one click. With clicks — not code — users can customize the web crawler rules so entry points can be specified while exclusion rules instruct the web crawler on pages, content, and terms to avoid.
Search content in Box, a leading cloud content management system, with Elastic Workplace Search.
As one of the early pioneers in cloud-based storage, Box has evolved into a leading cloud content management system with millions of global users. Elastic Enterprise Search now supports Box as a content source inside Workplace Search. The prebuilt connector includes document-level permissions so the right user sees what they’re supposed to see — and nothing else. The addition of Box expands an already robust portfolio of content sources available in Workplace Search, including Google Drive and Dropbox.
Extend granular access controls with document-level permissions for Atlassian Jira Cloud and Confluence Cloud for Elastic Workplace Search.
Not all content is created — or shared — equally. Sensitive and private content needs to be shared with explicitly defined individuals or groups, with document-level access to these files becoming even more critical when they’re easily available to be searched. Elastic Workplace Search now includes document-level permissions for Atlassian’s Jira Cloud and Confluence Cloud so the same permissions set in these source applications are inherited by Elastic Workplace Search.
Get a scoop on all of the new Elastic Enterprise Search features in the Elastic Enterprise Search 7.11 release blog.
Elastic Observability
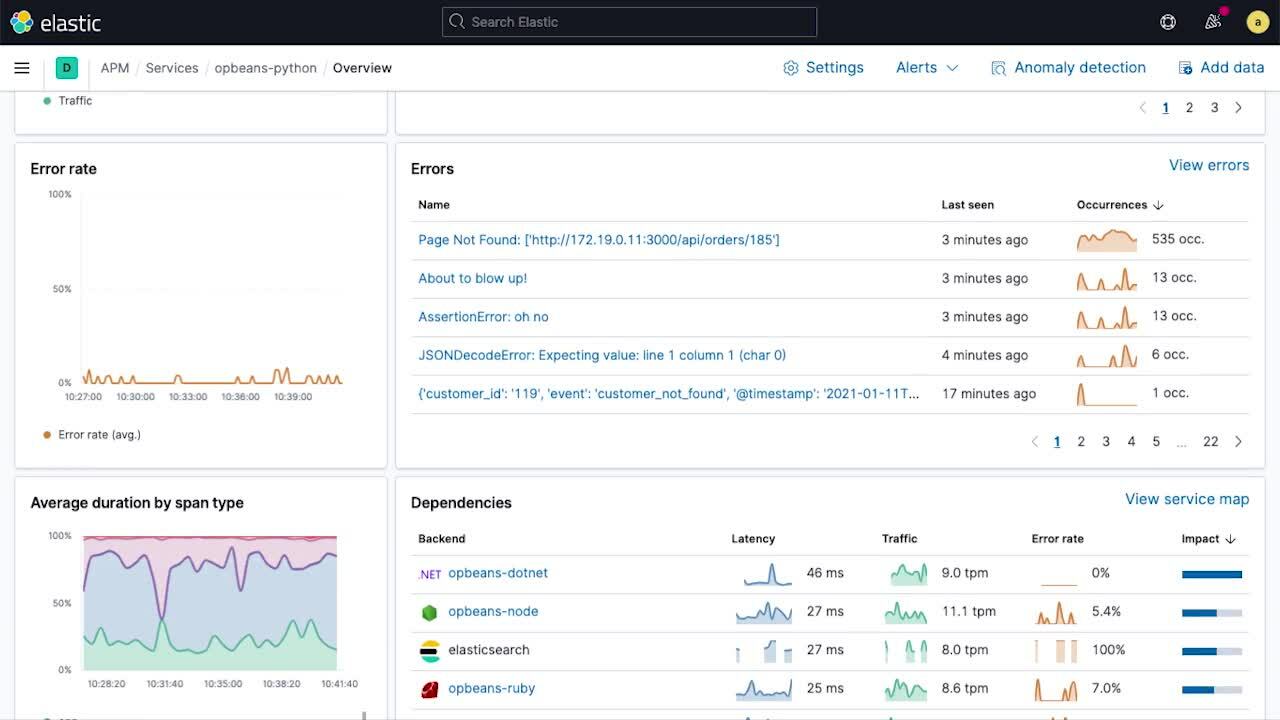
Accelerate root cause analysis and troubleshooting with the new service health view in Elastic APM.
Modern cloud-native applications are typically made up of hundreds of microservices, and the ability to quickly pinpoint the performance and health of an individual service is critical to incident investigation workflows. The new service overview page summarizes all the information about the health of a service in one place and makes it easier for developers and SREs to troubleshoot performance issues.
Time series charts of service latency, traffic, and error rate provide a high-level view of service KPIs over time. Overlaid annotations such as deployment markers and anomaly alerts provide rich context into key events that might have contributed to changes in behavior. The service overview page uses sparklines to provide a compact view into temporal trends of subcomponents, making it easy to spot unusual changes in behavior and drive investigations. The service overview page also shows service health broken down by underlying infrastructure instances (e.g., containers) that the service is deployed on, so that you can connect issues to problems with underlying infrastructure.
Future releases will bring additional context and views into the mix to further streamline and accelerate troubleshooting and root cause analysis workflows.
Troubleshoot infrastructure issues faster with a new host details view in Elastic Metrics.
The resource heatmap in the Elastic Metrics app helps you spot trouble in your infrastructure and narrow down next steps of an investigation. A new view in the metrics UI makes it easy to go from the high-level view to inspect what is happening on an individual host. Clicking on a tile in the heatmap brings up a popup window that surfaces key information, including time charts of key host metrics, logs generated by the host, processes running on the host, and host metadata.
Add more context by automatically linking logs and traces with new logging libraries in the Elastic Common Schema (ECS).
Correlating application logs and traces and navigating between them without losing context is vital to application troubleshooting workflows. Logging libraries in the Elastic Common Schema (ECS) make it easy for application developers to automatically inject the trace context captured by the APM agent into their application logs, enabling the log to trace correlation required for streamlined analysis.
ECS logging libraries are plugins for your favorite logging frameworks, such as log4j, and let developers write application logs in ECS-compliant JSON format, without changing their native workflows. ECS loggers automatically write the relevant trace context captured by the APM agent into the log, helping developers create observable applications with no extra work.
Dive deeper into all the new features in the Elastic Observability 7.11 blog.
Elastic Security
Access security data at scale with a searchable snapshots cold tier.
Elastic 7.11 brings searchable snapshots into general availability and introduces a cold tier leveraging object stores like Amazon S3. Security teams can now enjoy direct access to years of high-volume data and cost savings of up to 50%, supporting use cases like hunting, investigation, compliance, threat profiling, forensic analysis, adversary emulation, and more. Extended retention of security data ensures that even when facing extremely long dwell times, practitioners have the data they need. Data sources like cloud platforms and applications, IDS/IPS, DNS, wire data, host activity, observability data, MDM, IoT, OT — and many others typically too costly to incorporate in day-to-day operations — can be kept operationally ready at greater scale. Security teams can even apply automated detections across data that would otherwise be archived or dropped.
Detect attacks against cloud apps and hosts with prebuilt machine learning jobs and detection rules supporting MITRE sub-techniques.
Elastic Security 7.11 helps secure the modern enterprise stack with updated machine learning jobs and new detection rules. These Elastic-developed detections support MITRE ATT&CK® sub-techniques, deepening understanding of how attacks are unfolding in your organization and improving alignment with the ATT&CK® framework.
Prebuilt detections for cloud applications automatically spot techniques and behaviors associated with attacks against SaaS technologies like Google Workspace, Microsoft 365, and Okta, complementing existing Elastic protections for IaaS technologies. Prebuilt security analytics content for Windows and Linux environments centrally detect a wide range of attacker activity, with a focus on addressing persistence, privilege escalation, and lateral movement.
Elastic Security researchers recently detailed an advanced method for spotting domain generation algorithms (DGA), supporting the detection of SUNBURST and other attacks. Learn more in our machine learning for DGA detection blog post.
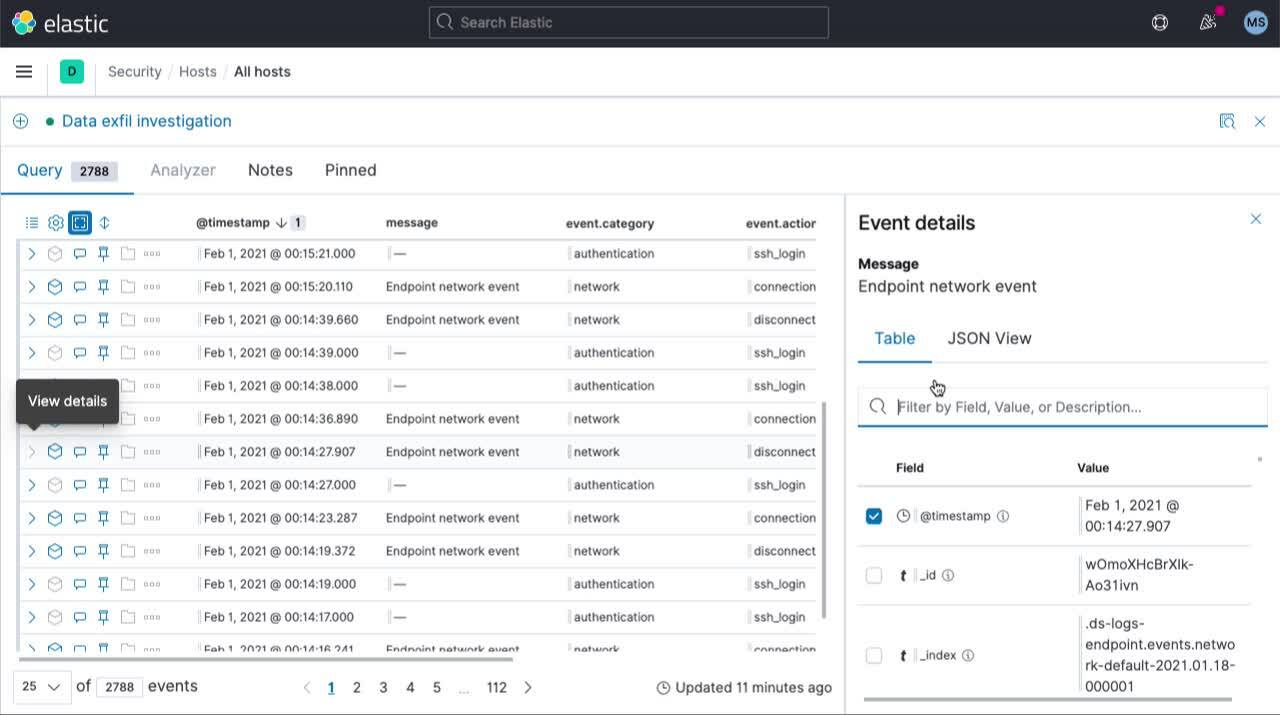
Streamline SOC workflows and accelerate response times with improved alert management, a broader set of rule actions, an updated timeline workspace, and accessible navigation for all.
Streamlined alert management enables analysts to maintain velocity when addressing threats. Customizable alert notifications deliver key context to third-party workflow tools like Slack and ServiceNow, reducing swivel-chair analysis and accelerating triage. Analysts can now attach alerts directly to cases to align responders and centralize relevant information. An expanded set of rule actions tighten integrations with Jira, ServiceNow, and IBM Resilient, driving SOC efficiency.
A refreshed Timeline workspace drives efficient threat hunting, alert triage, and investigation. See key information on dedicated tabs, view events in a full-screen view, and access event details without losing sight of surrounding events. Fluidly switch between multiple timelines and update them quickly with drag-and-drop fields.
Elastic Security 7.11 delivers accessible navigation with enhanced keyboard navigation and screen reader support to serve users who count on accessibility being built into the tools they use every day. We expect these and other power users (hello, hotkeys!) to love it, too.
Get all the details in the Elastic Security 7.11 blog.
Elastic Cloud
Double your storage density or save on infrastructure cost with the new cold tier powered by searchable snapshots and object stores like S3.
Elastic Cloud takes advantage of the new searchable snapshots capability and cold tier with an easy-to-use cold tier slider available in the Elastic Cloud Console. This control provides an easy way to implement a cost-efficient data retention strategy and retain more data for longer at the same cost.
A hot-warm-cold architecture allows you to maximize the cost effectiveness of data storage by giving you control over how and where your time series data is stored as it ages. You can select hot or warm tier for recent, highly relevant, frequently accessed data. With index lifecycle management, you can automatically move less active read-only data to the cold tier, leveraging cost-effective, durable object storage including Amazon S3, Azure Blob Storage, or Google Cloud Storage.
Deployment templates help you get up and running quickly, and warm and cold sliders are available across templates, for both existing and new deployments, to manage your data policies. Elastic Cloud is the easiest way to take advantage of searchable snapshots and the cold tier.
Scale and streamline cloud operations with autoscaling of data and machine learning nodes.
Free yourself from having to constantly monitor and manage resources and let your cluster automatically grow to meet your capacity needs. The flexibility to autoscale your data and machine learning nodes is coming soon to Elastic Cloud. Data node autoscaling ensures that you always have the capacity you need even as the amount of data ingested and indexed grows. ML-based autoscaling lets you seamlessly add machine learning capabilities without hitting memory limits for a seamless experience. We plan to continue expanding our autoscaling capabilities to support additional metrics and use cases in future releases. Expand your Elastic use cases knowing that autoscaling will let you seamlessly grow your infrastructure.
Replicate and search data across regions and cloud providers for increased availability and better search performance with enhanced cross-cluster replication (CCR) and cross-cluster search (CCS).
Enhanced cross-cluster replication and cross-cluster search between regions and cloud providers is now available. Customers have the freedom to search and replicate their data across clusters in different regions and cloud providers.
With CCS, you’re able to search across any number of clusters you choose so you can visualize all of your data in one coherent view. This breaks down data silos, connecting all data as if it was in one cluster and enabling customers to derive new insights. CCR allows you to replicate and store copies of data between clusters, letting you handle search requests in the event of a datacenter outage, create centralized data in one location from two or more clusters to easily analyze and aggregate locally, and bring data closer to end users to reduce latency.
To deliver these capabilities across regions and cloud providers required significant innovation to address security, trust, and network topology, but we have done the hard work to make it easy for our customers to leverage these features in their deployments.
To get caught up on all of the Elastic Cloud news, check out the What’s New In Elastic Cloud for 7.11 blog.
There’s always more...
So much more. Check out the individual solution and product blog posts for the details on everything we added in 7.11:
Elastic Stack
Elastic Solutions
Elastic Enterprise Search 7.11.0 released
Elastic Observability 7.11.0 released
Elastic Security 7.11.0 released