Combining supervised and unsupervised machine learning for DGA detection
Editor’s Note — December 21, 2020: This blog has been updated since its original release to include a use case that applies this workflow to the SUNBURST attack.
It is with great excitement that we announce our first-ever supervised ML and security integration! Today, we are releasing a supervised ML solution package to detect domain generation algorithm (DGA) activity in your network data.
In addition to a fully trained detection model, our release contains ingest pipeline configurations, anomaly detection jobs, and detection rules that will make your journey from setup to DGA detection smooth and easy. Navigate to our detection rules repository to check out how you can get started using supervised machine learning to detect DGA activity in your network and start your free trial with Elastic Security today.
DGAs: A breakdown
Domain generation algorithms (DGA) are a technique employed by many malware authors to ensure that infection of a client machine evades defensive measures. The goal of this technique is to hide the communication between an infected client machine and the command & control (C & C or C2) server by using hundreds or thousands of randomly generated domain names, which ultimately resolve to the IP address of a C & C server.
To more easily visualize what’s occurring in a DGA attack, imagine for a moment you’re a soldier on a battlefield. Like many soldiers, you have communication gear that uses radio frequencies for communication. Your enemy may try to disrupt your communications by jamming your radio frequencies. One way to devise a countermeasure for this is by frequency hopping — using a radio system that changes frequencies very quickly during the course of a transmission. To the enemy, the frequency changes appear to be random and unpredictable, so they are hard to jam.
DGAs are like a frequency-hopping communication channel for malware. They change domains so frequently that blocking the malware’s C2 communication channel becomes infeasible by means of DNS domain name blocking. There are simply too many randomly generated DNS names to try and identify and block them.
This technique emerged in the world of malware with force in 2009, when the “Conficker” worm began using a very large number of randomly generated domain names for communication. The worm’s authors developed this countermeasure after a consortium of security researchers interrupted the worm’s C2 channel by shutting down the DNS domains it was using for communication. DNS mitigation was also performed in the case of the 2017 WannaCry ransomware global outbreak.
Blending in
If the best place to hide a tree is in a forest, malware operators have long recognized that blending in with normal web traffic is one of the best ways to go undetected. An HTTP request with a randomly generated domain name is a hard problem in network security monitoring and detection. The vast amount of HTTP traffic in modern networks makes manual review infeasible. Some malware and bots have unusual user agent strings that can be alerted on with search rules, but malware authors can easily leverage a user agent string that looks no different from a web browser.
With the rise of mobile and IoT, user agent strings have become so numerous that manual review for suspicious activity is also becoming infeasible. Web proxies have long used categorization to look for URLs that are known to be suspicious, but DGA domains are so voluminous and short-lived that they are often not categorized. Threat intelligence feeds can identify IP addresses and HTTP requests that are associated with known malware families and campaigns, but these are so easily changed by malware operators that such lists are often outdated by the time we put them to use in searches.
The sheer volume of network traffic collected in many organizations and the random nature of DGA-generated domains makes detection of this activity a challenge for rule-based techniques — and a perfect fit for our supervised machine learning model! Using Inference, Elastic’s DGA detection ML model will examine packetbeat DNS data as it is being ingested into your Elasticsearch cluster, automatically determining which domains are potentially malicious. Follow the steps in the next section to get started.
Getting started
To get started with DGA detection within the security app, we have released a set of features to our publicly available rules repository to assist with the importing of machine learning models to the Elastic Stack. This repo not only provides our community a place to collaborate on threat detection, but also acts as a place to share the tools required to test and validate rules.
Please see our previous blog and webinar for additional information on the initiative. If you don’t already have an Elastic Cloud subscription, you can try it out through our free 14 day cloud trial to start experimenting with the supervised ML solution package to detect DGA activity
Part of this rule toolkit is a CLI (command line interface) to not only test rules, but also interact with your stack. For instance, we have released various Python libraries to interact with the Kibana API. This was critical in making an easier process for importing the model dependencies to get your rules operational. To start enriching DNS data and receiving alerts for DGA activity, follow these three steps:
Step one: Importing the model
First, you must import the DGA model, painless scripts, and ingest processors into your stack. Currently, DGA models and any unsupervised models for anomaly detection (more to come) are available in the detection-rules repo using github releases. To upload, run the following CLI command:
python -m detection_rules es <args_or_config> experimental setup-dga-model -t <release-tag>
Following the upload, you will need to update your packetbeat configuration, as the model will enrich packetbeat DNS events with a DGA score. This can easily be done by adding the additional configuration to your Elasticsearch output configuration:
output.elasticsearch:
  hosts: ["your-hostname:your-port"]
  pipeline: dns_enrich_pipeline
The supervised model will then analyze and enrich Packetbeat DNS events, which contain these ECS fields:
dns.question.name
dns.question.registered_domain
The model will then add these fields to processed DNS events:
| Field name | Description |
| ml_is_dga.malicious_prediction | A value of “1” indicates the DNS domain is predicted to be the result of malicious DGA activity. A value of “0” indicates it is predicted to be benign. |
| ml_is_dga.malicious_probability | A probability score, between 0 and 1, that the DNS domain is the result of malicious DGA activity. |
A sample screenshot of enriched DNS data is shown below:
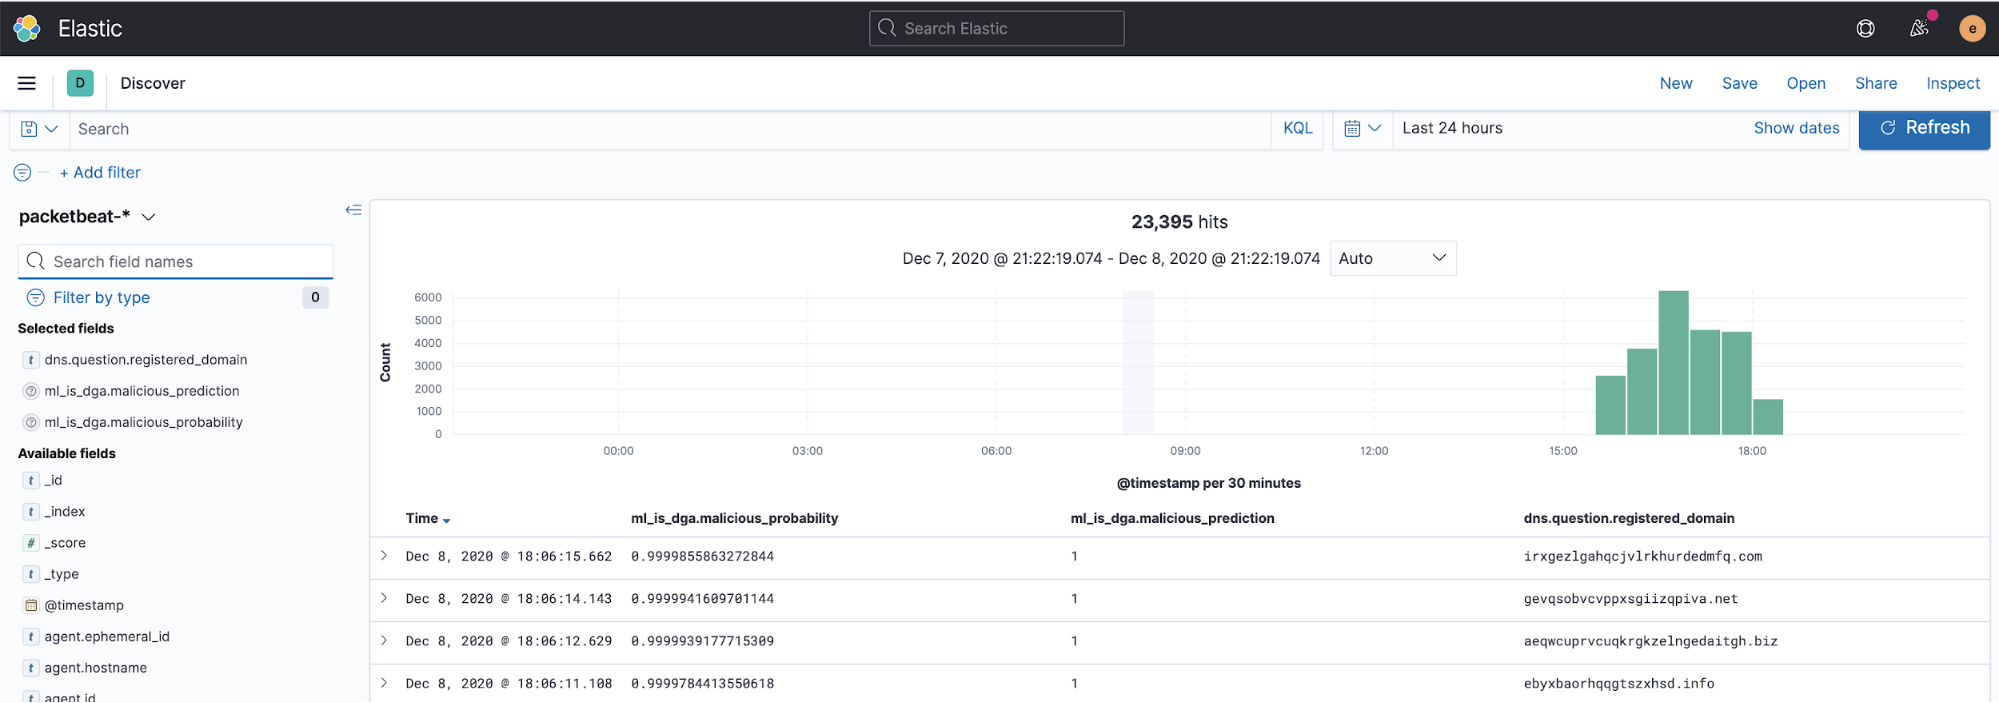
Note: For more detailed information, please consult the detection-rules readme.
About the DGA Rules
Now let’s look at some conditional search rules that detect and alert on DGA activity. Two search rules are provided in the package that can be enabled and run in the detection engine in the Elastic Security app:
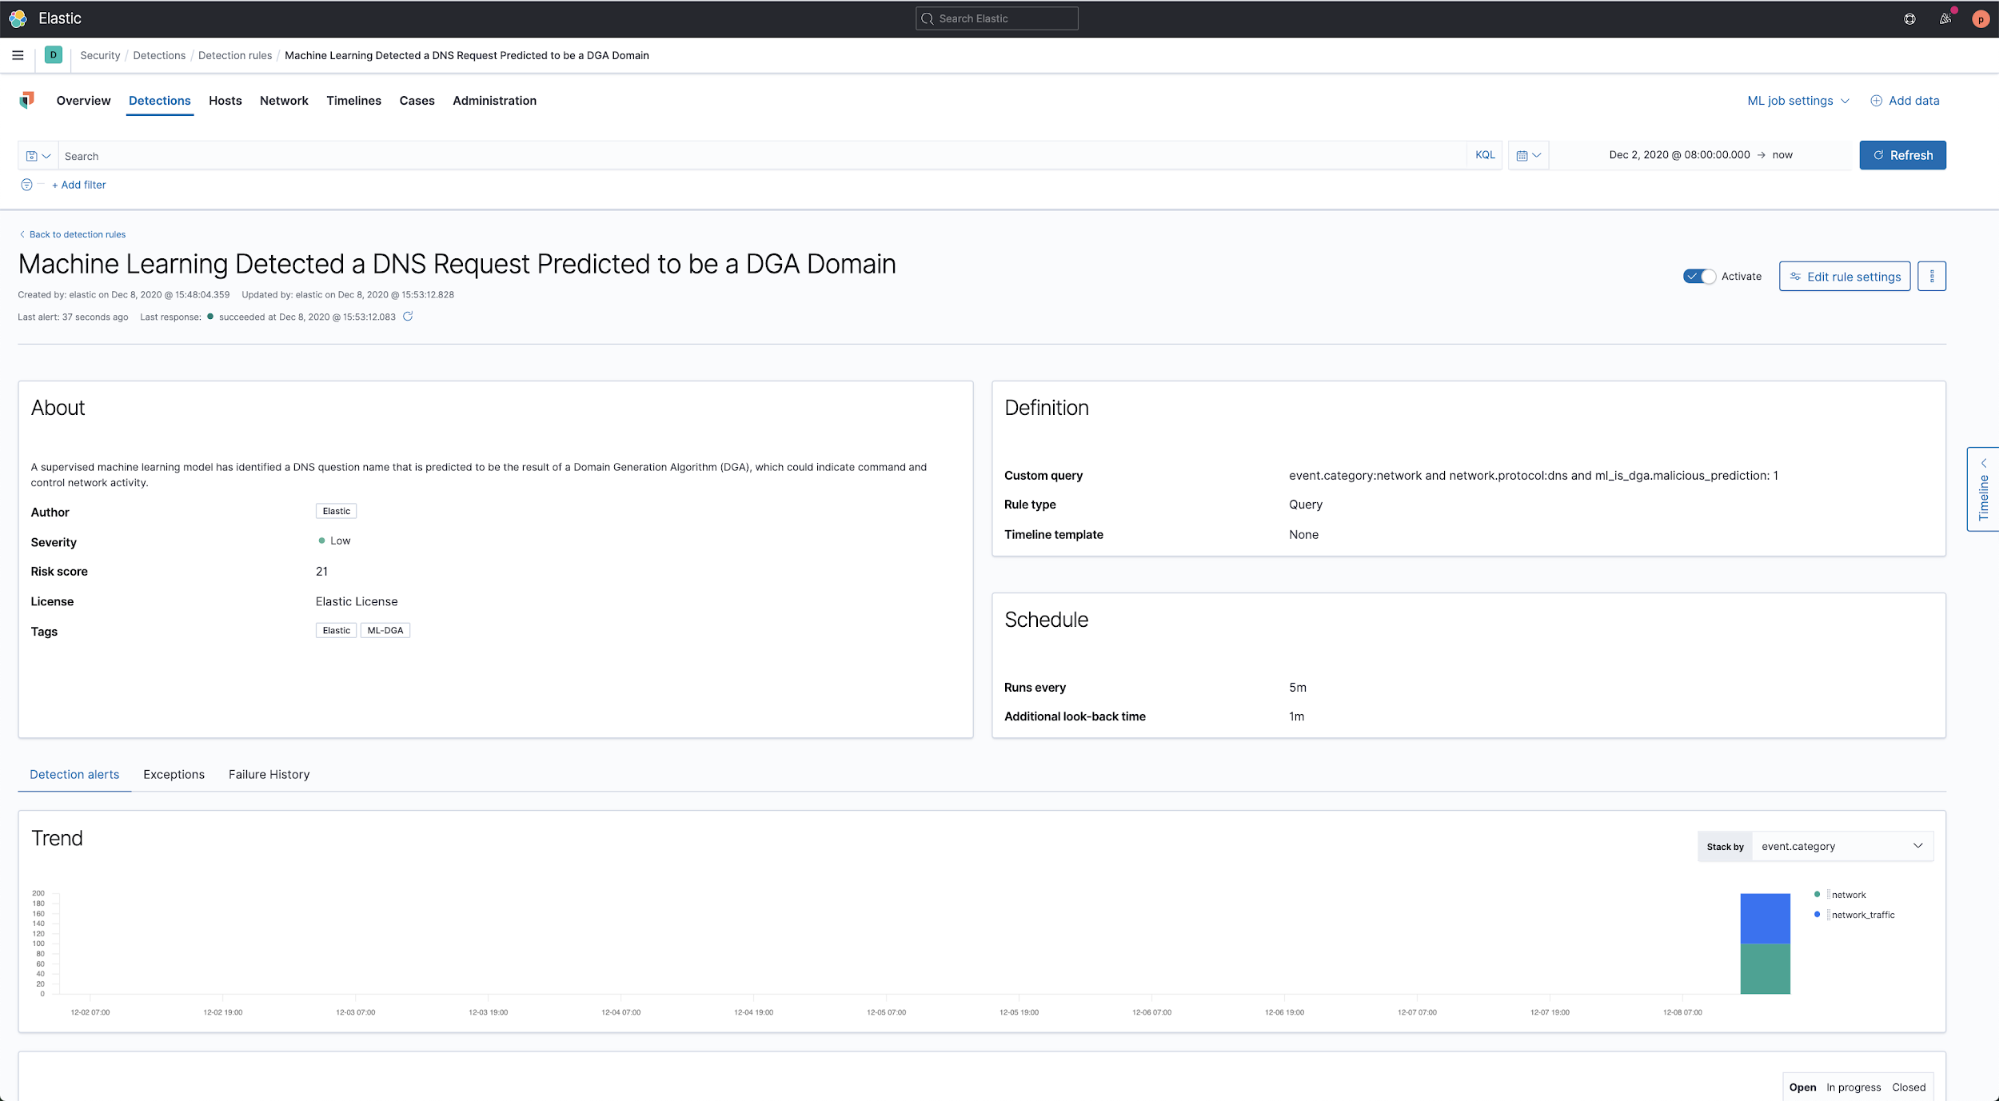
- Machine Learning Detected a DNS Request Predicted to be a DGA Domain
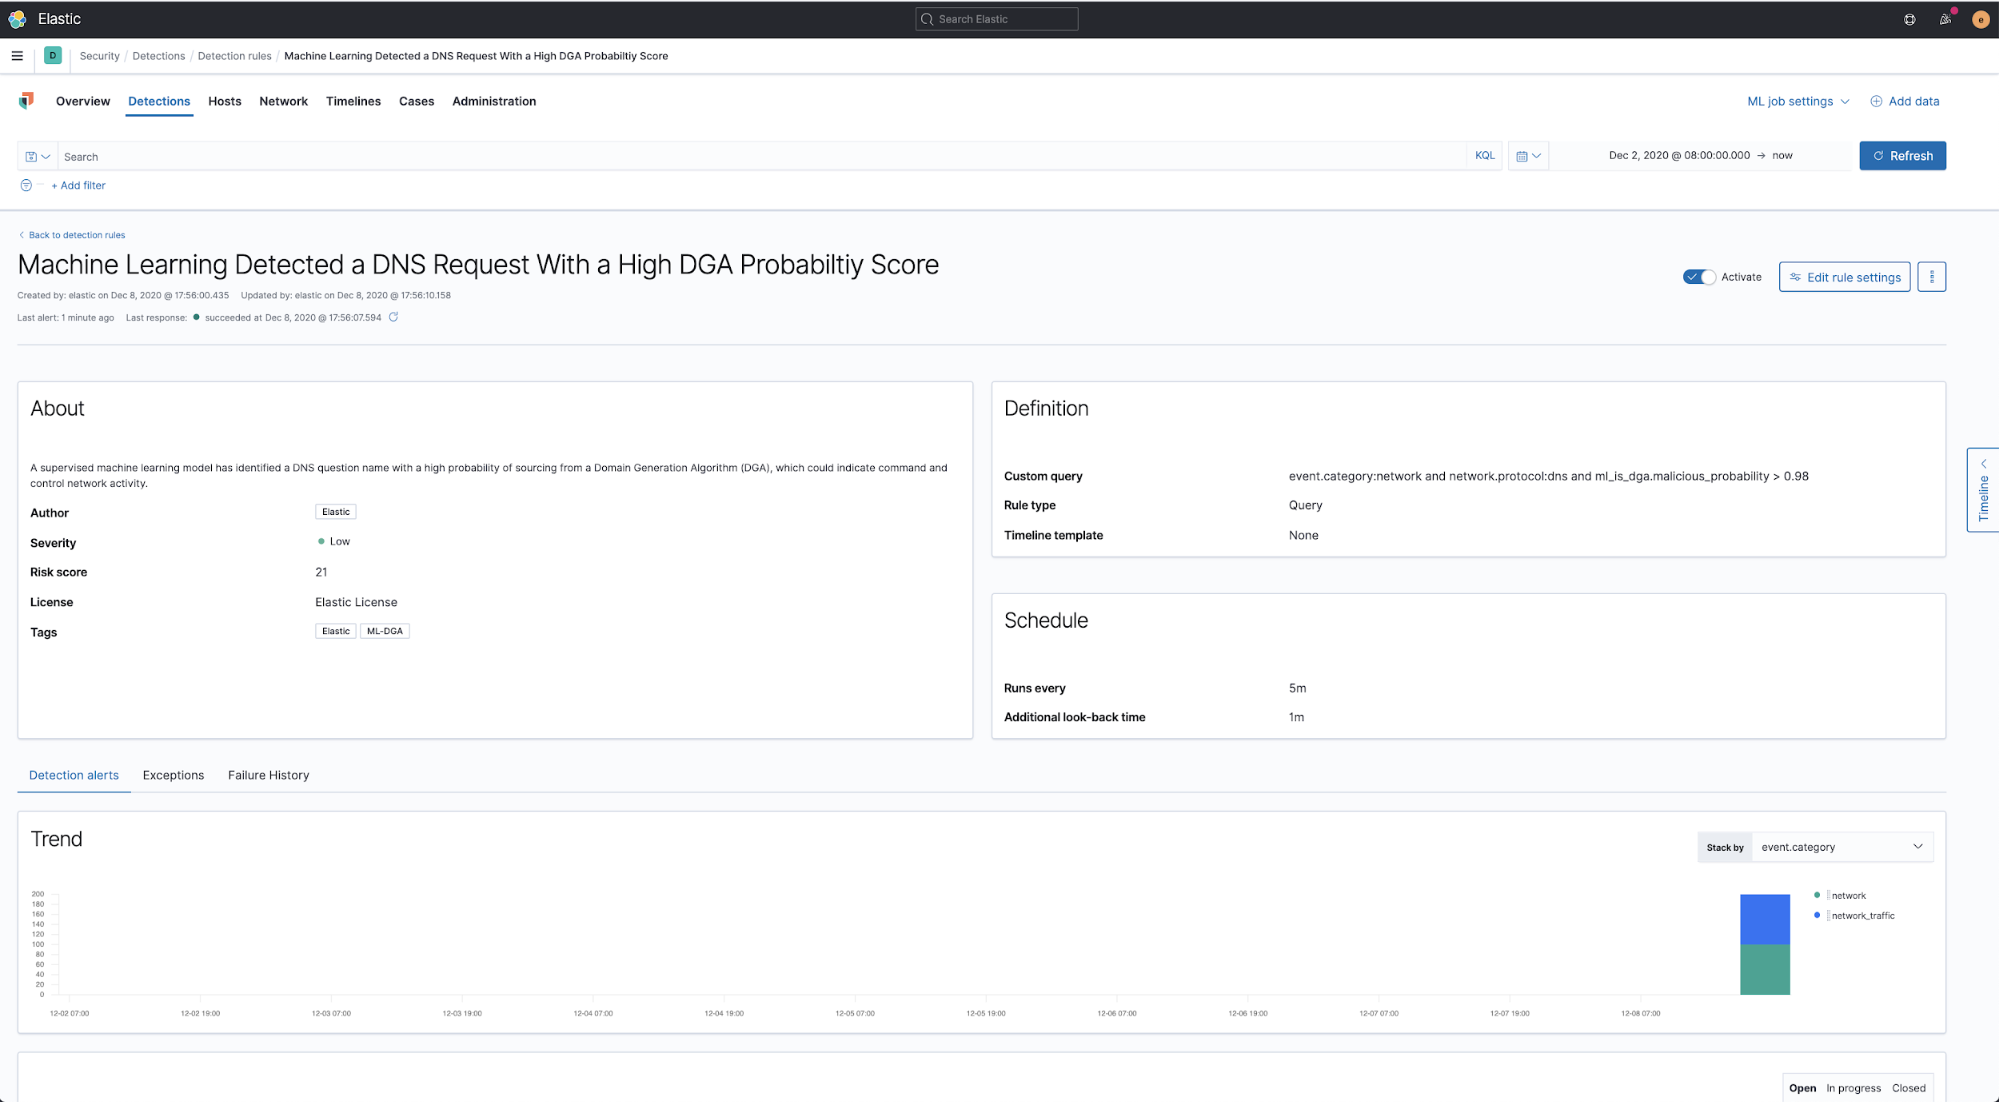
- Machine Learning Detected a DNS Request With a High DGA Probability Score
The first rule matches any DNS event that has a DGA prediction value of 1, indicating the DNS domain name was probably the product of a domain generation algorithm and is therefore suspicious. The rule, found here, simply looks for the following condition:
event.category:network and network.protocol:dns and ml_is_dga.malicious_prediction: 1
The second rule matches any DNS event that has a DGA probability higher than 0.98, indicating the DNS domain name was probably the product of a domain generation algorithm and is therefore suspicious. The rule, found here, simply looks for the following condition:
event.category:network and network.protocol:dns and ml_is_dga.malicious_probability > 0.98
Like all rules in the Elastic Detection Engine, they can be forked and customized to suit local conditions. The probability score in the second rule can be adjusted up or down if you find that a different probability score works better with your DNS events. Either rule can have its risk score increased if you wish to raise the priority of DGA detections in your alert queue. Exceptions can be added to the rules in order to ignore false positives such as content distribution network (CDN) domains that may use pseudorandom domain names.
Another future possibility we plan to explore is to use event query language (EQL) to look for clusters of anomaly or search-based alerts using multivariate correlation. For example, if we see a cluster of alerts from a host engaged in probable DGA activity, confidence increases that we have a significant malware detection that needs attention.
Such a cluster could consist of DGA alerts combined with other anomaly detection alerts such as a rare process, network process, domain, or URL. These additional anomaly detections are produced by the library of machine learning packages included in the Elastic Security app.
Step two: Importing the rules
The rules in the DGA package can be imported using the kibana rule-upload feature in the detection-rules CLI (in the format of .toml). Since the rules provided in detection-rules repo releases are in .toml format, simply run the following command to upload a rule from the repo:
python -m detection_rules kibana upload-rule -h
Kibana client:
Options:
  --space TEXT Kibana space
  -kp, --kibana-password TEXT
  -ku, --kibana-user TEXT
  --cloud-id TEXT
  -k, --kibana-url TEXT
Usage: detection_rules kibana upload-rule [OPTIONS] TOML_FILES...
  Upload a list of rule .toml files to Kibana.
Options:
  -h, --help  Show this message and exit.
  -h, --help  Show this message and exit.
Step three: Enable rule and profit
Now that we have the trained supervised ML model imported into the stack, DNS events being enriched, and rules at our disposal, all that is left to do is confirm that the rule is enabled and wait for alerts!
When viewing the rule in the Detection Engine, you can confirm that it is activated as seen below:
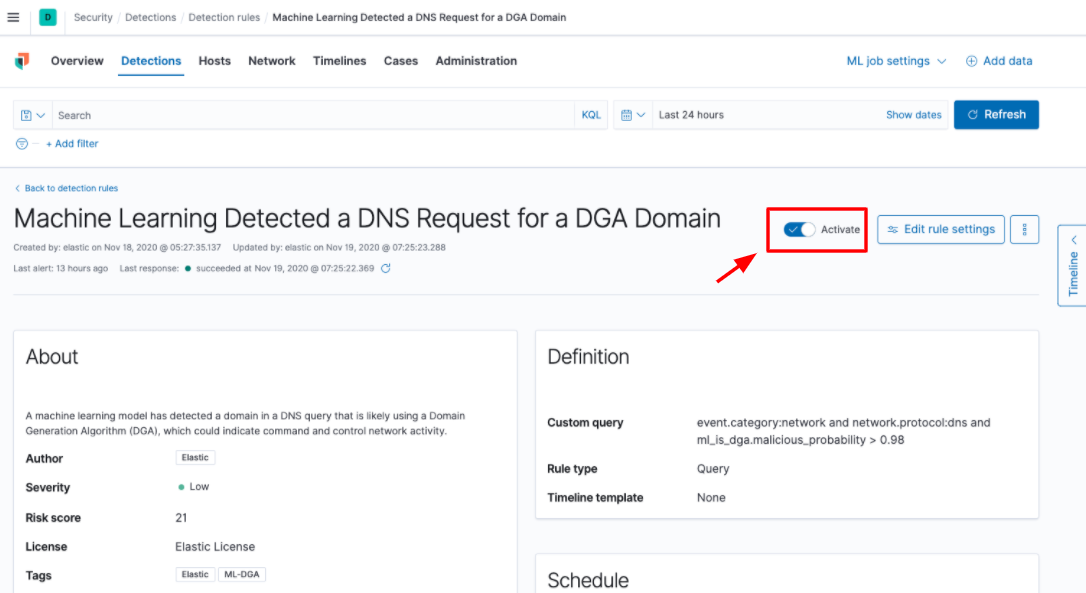
And now wait for alerts. Once an alert is generated, you can use the Timeline feature to investigate the DNS event and start your investigation.
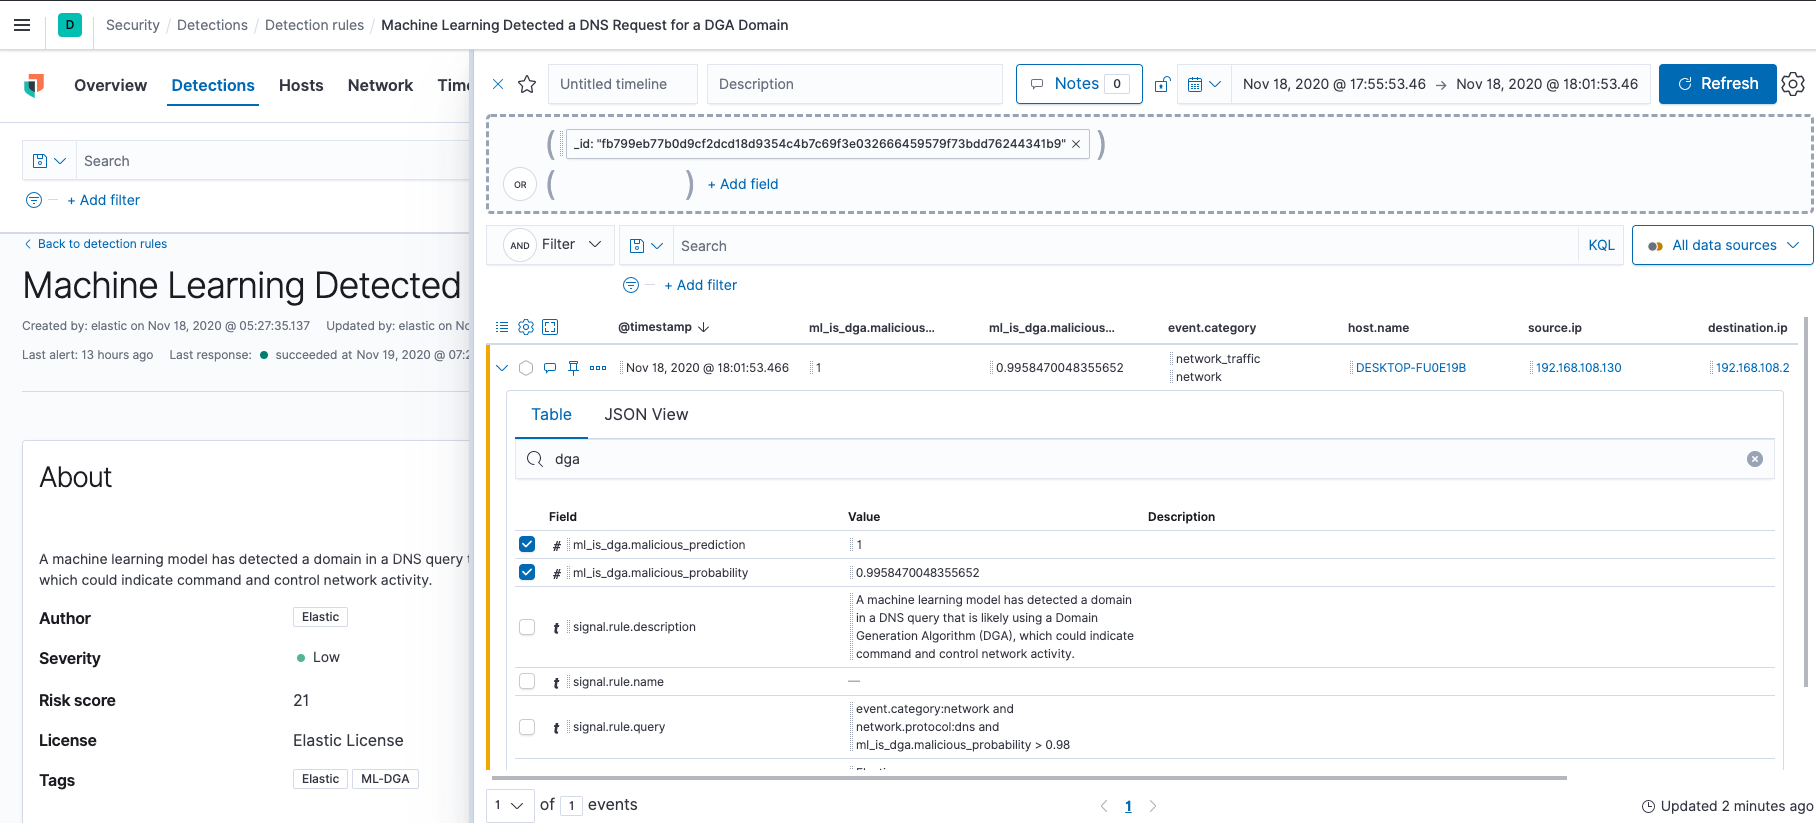
However, no machine learning model is perfect! Some benign domains will be mistakenly labeled as false positives. In the next section, we will investigate how to leverage preconfigured anomaly detection jobs and accompanying rules that ship with this release to tune out false positives.
False positives? Anomaly detection to the rescue!
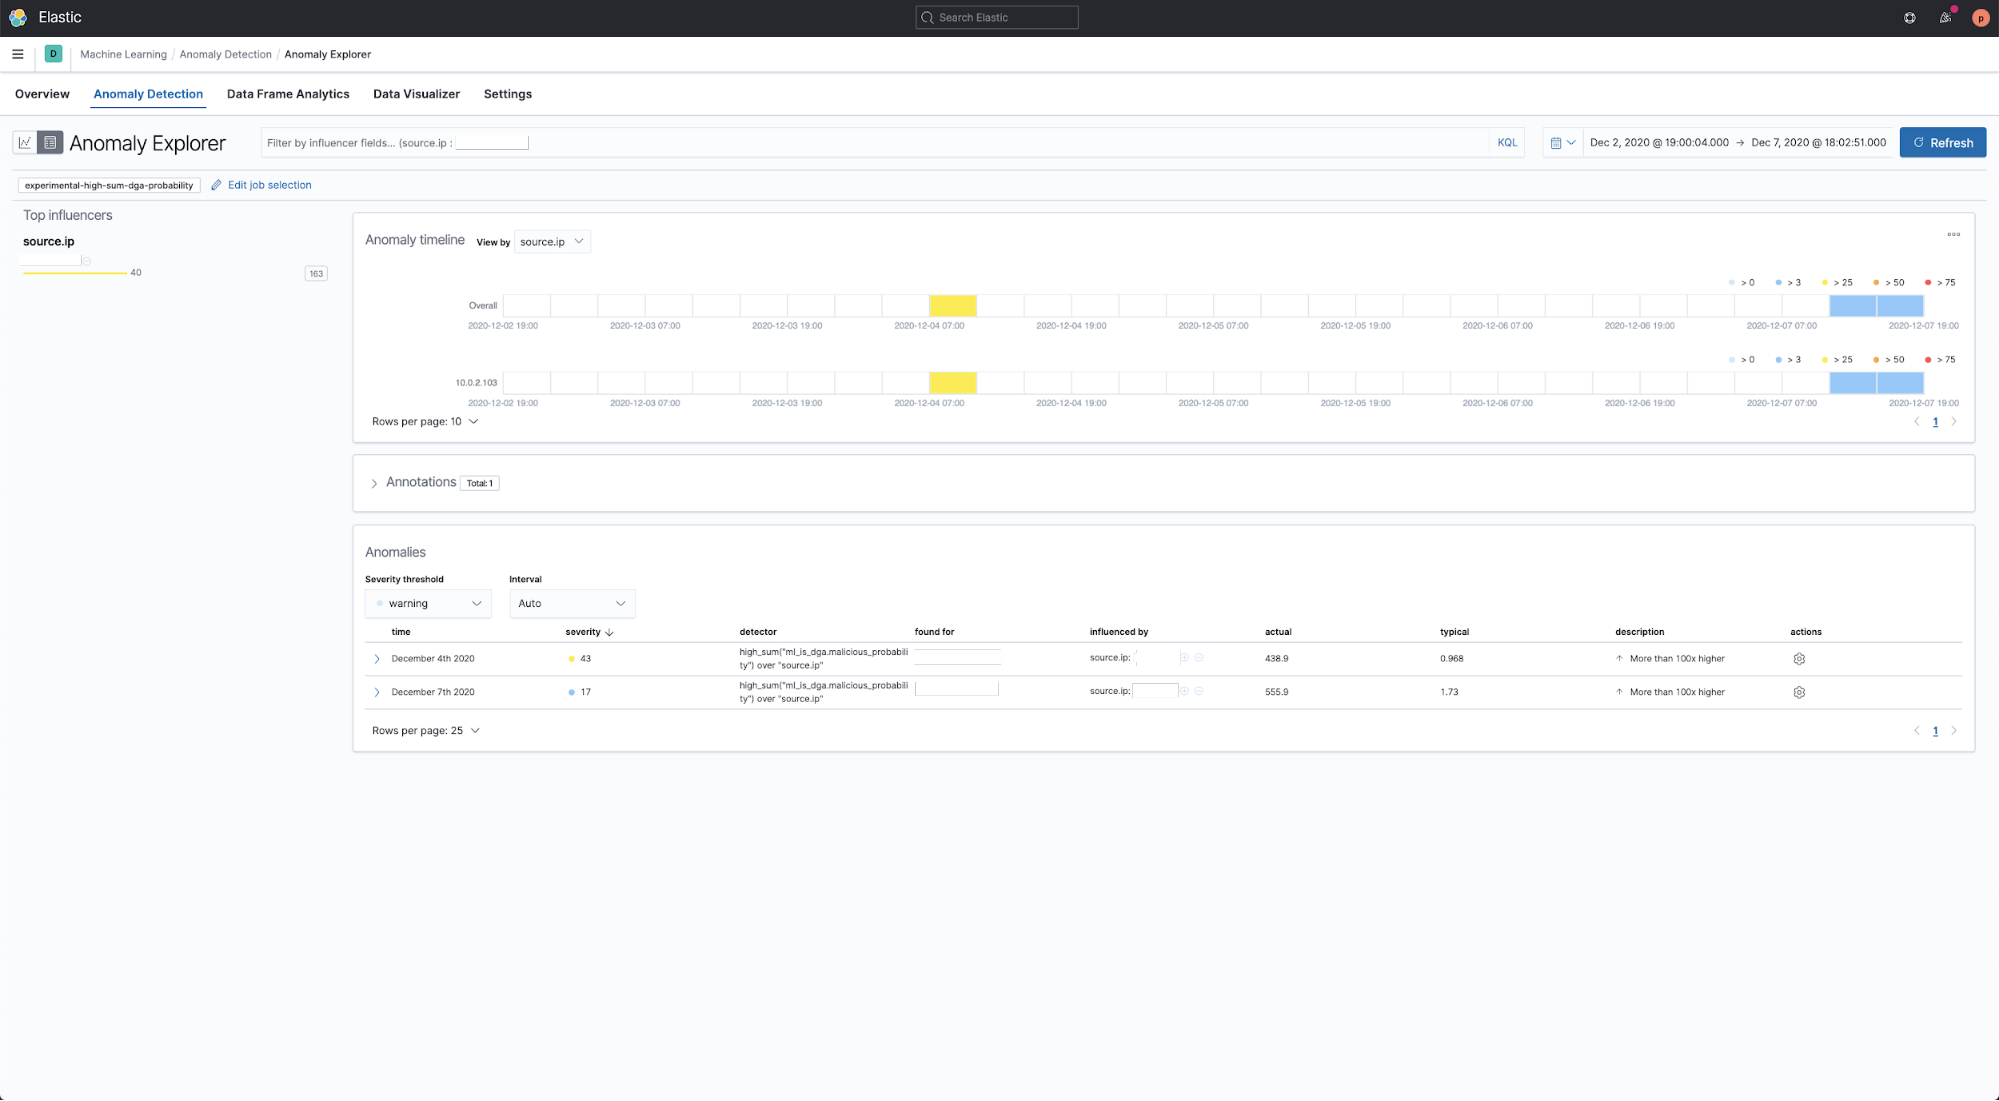
As with every detection technique, there will always be some false positives. These may come in the form of CDN traffic or custom domains that appear to be malicious but that are actually normal in the environment. To make sure that our DGA detection adapts to each user’s environment, we have created a preconfigured anomaly detection job named experimental-high-sum-dga-probability. When enabled, this ML job examines the DGA scores produced by the supervised DGA model (yes it’s ML, all the way down) and looks for anomalous patterns of unusually high scores for a particular source IP address. Such events are assigned an anomaly score.
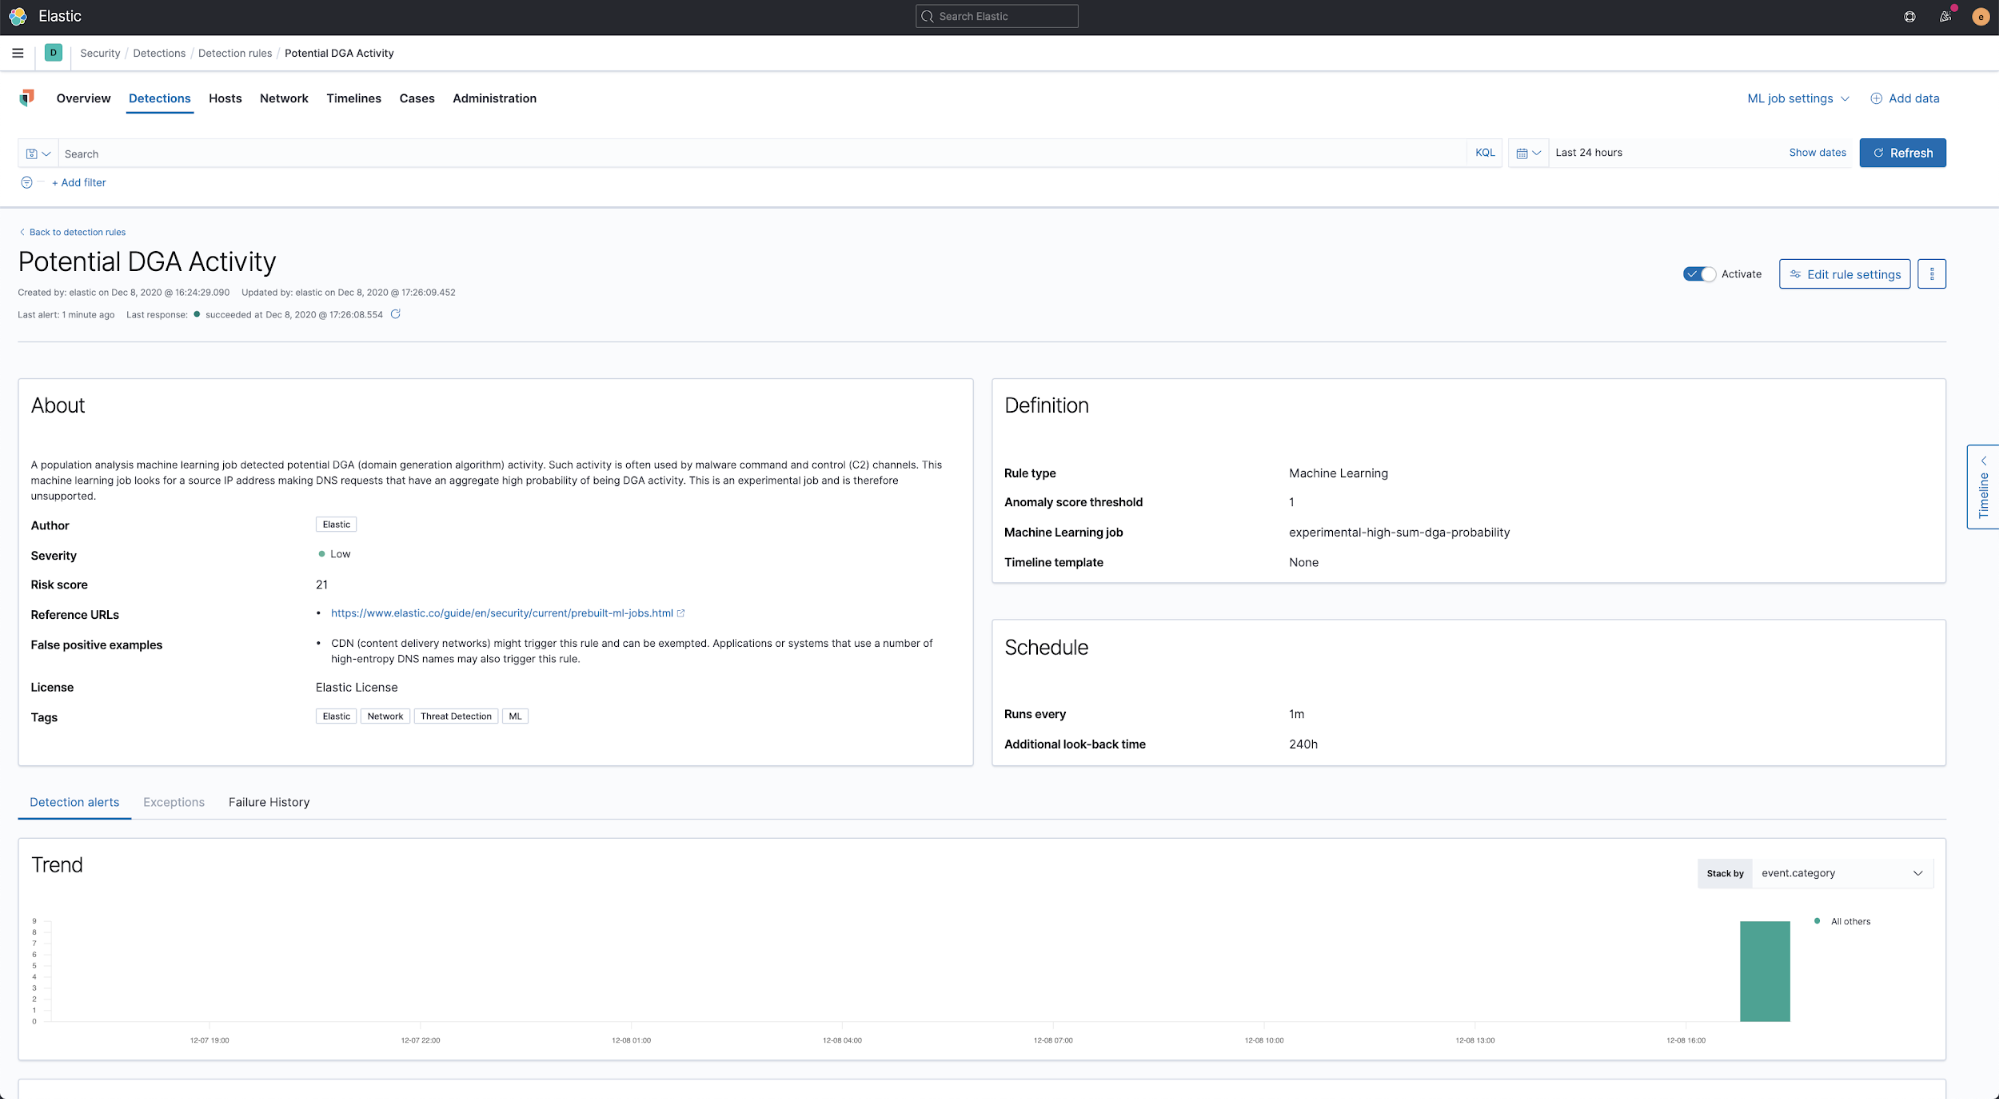
To maximize the benefit from the anomaly detection job, we are releasing it together with a complementary rule: Potential DGA Activity. This will create an anomaly based alert in the detection page in the security app.
Both the preconfigured anomaly detection job and complementary rule are available in the our detection rules repo releases.
How to choose the right configuration for your environment
It all starts with the supervised DGA model. Every DNS request ingested through Packetbeat is analyzed by the model and assigned a probability that indicates the likely maliciousness of the domain involved in the request. You can use the outputs of the supervised model directly in the security app using the conditional logic rules discussed in the ‘Getting started’ section, or, you can import and enable our preconfigured anomaly detection job and rules to further customize the detections to the subtleties of your environment.
How to choose the right configuration for your environment? Start simple. Enable the conditional search rules discussed in the ‘Getting started’ section. These rules act directly on the outputs of the supervised model and will quickly give you an idea of how much false positive background noise there is in your environment. If you find that the conditional search rules operating on the direct outputs of the supervised model produce too many alerts, you may benefit from importing and enabling the anomaly detection job.
In particular, the ML detection rule that operates on the results of the anomaly detection job may be useful for finding sources with aggregate high amounts of DGA activity rather than alerting on individual DGA scores one by one. If you do not have the ML module running, start up a free trial, or you can try it out in Elastic Cloud.
Sample screenshots of the anomaly detection model and associated rules provided with the release are below:
Case study: Detecting real-world DGA activity in the SUNBURST attack
Let’s try to apply this experimental DGA workflow to the recent SUNBURST campaign.
To recap, on December 13 SolarWinds released a security advisory regarding a successful supply-chain attack on the Orion network management platform. At the time of this writing, the attack affects Orion versions released between March and June of 2020. Likewise, on December 13, FireEye released information about a global campaign involving SolarWinds supply-chain compromise that affected some versions of Orion software.
We previously released a blog post addressing Elastic users and the SolarWinds case, commonly called SUNBURST. That post highlights that Elastic Security’s malware prevention technology used by both Elastic Endgame and Elastic endpoint security has been updated with detections for the attacks described in the SolarWinds disclosure.
SUNBURST was a sophisticated software supply-chain attack that reportedly inserted malware into the SolarWinds Orion product and distributed it using an auto-update mechanism. The size, scope, and extent of the incident is still being assessed at the time of this writing.
Existing Elastic Security detections
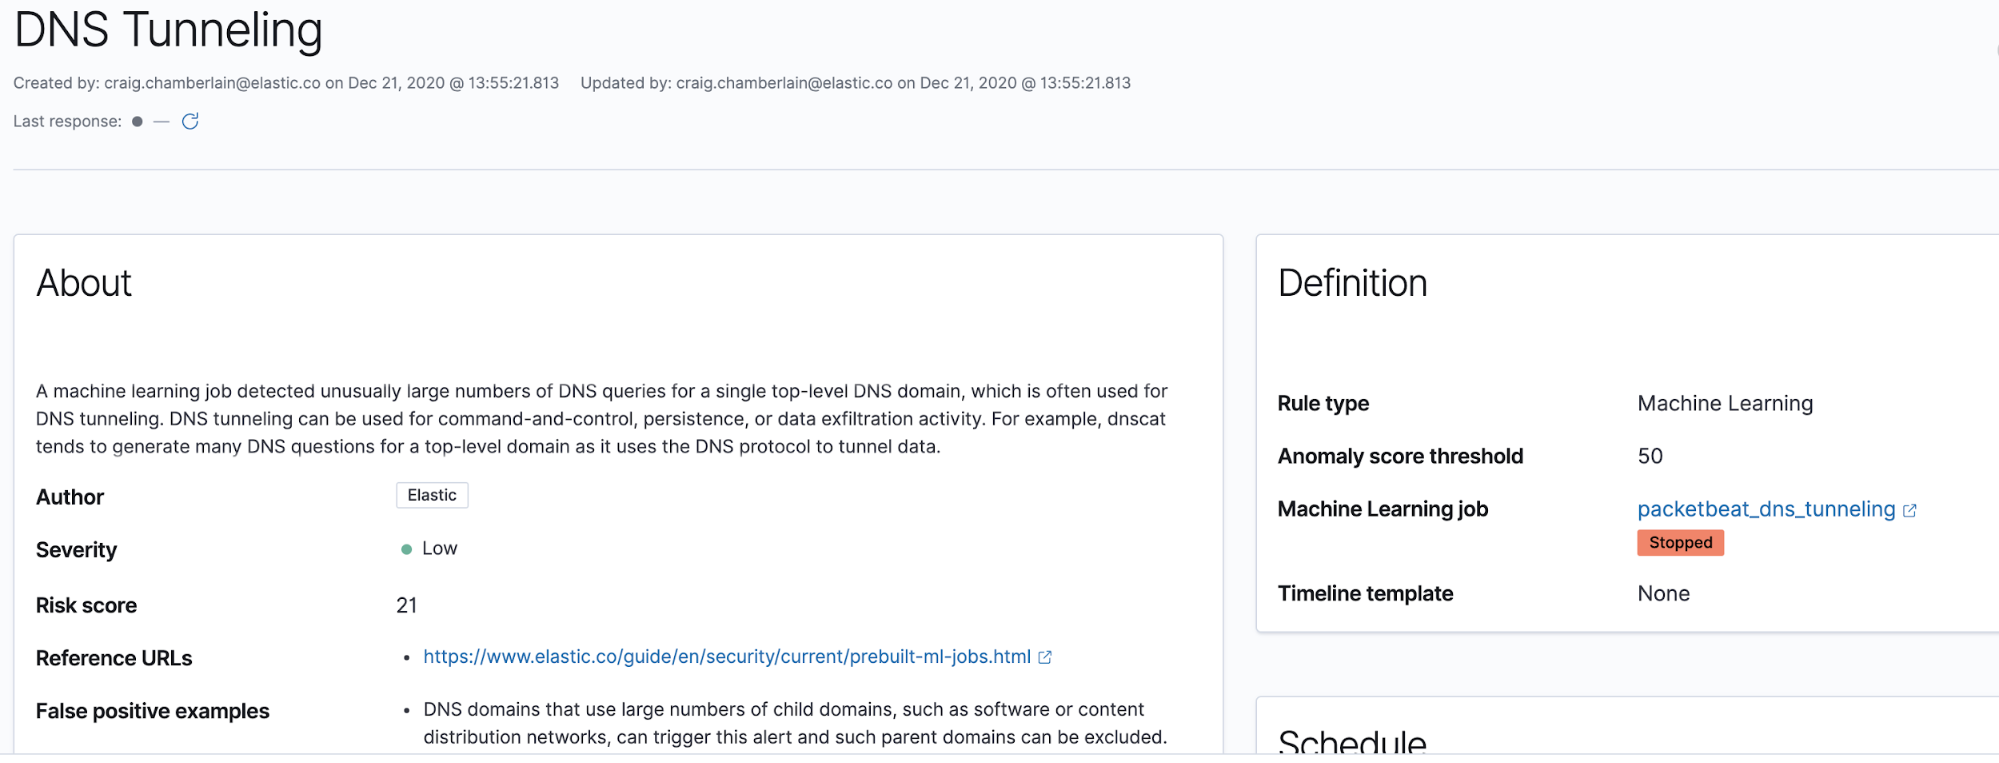
A set of 1722 DGA-generated domain names used by the SOLARWINDS malware has been shared by a security researcher. One of the existing Elastic Security machine learning-based detection rules, DNS Tunneling, produces two anomaly based alerts on the DNS names in this sample. Similar to DNS tunneling, the ratio of child-to-parent domains in the SUNBURST name sample is very high. This ML job associated with this rule is coded to analyze Packetbeat data but it can be cloned and modified to ingest other DNS events in Elastic Common Schema (ECS) format. This is the DNS Tunneling ML job:
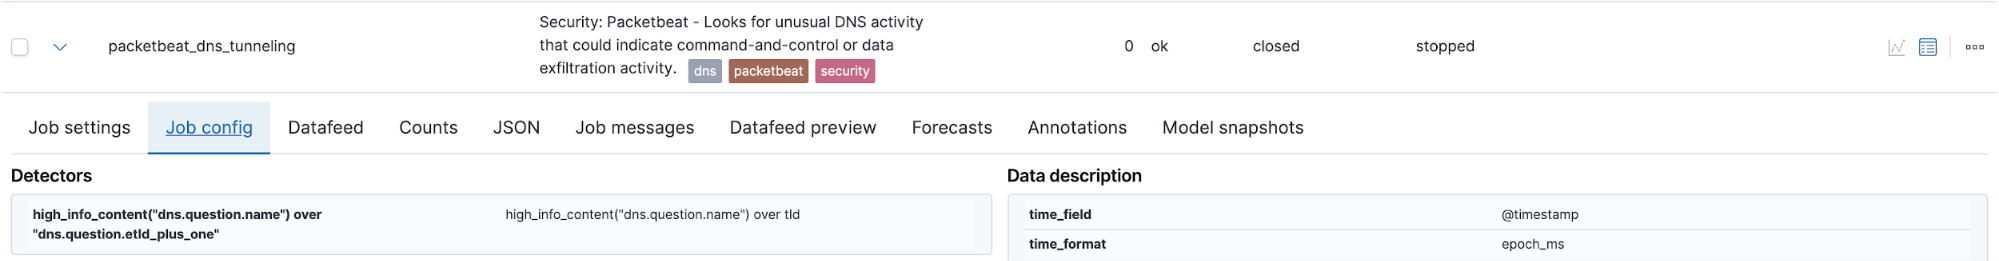
This ML job has an associated detection rule named DNS Tunneling:
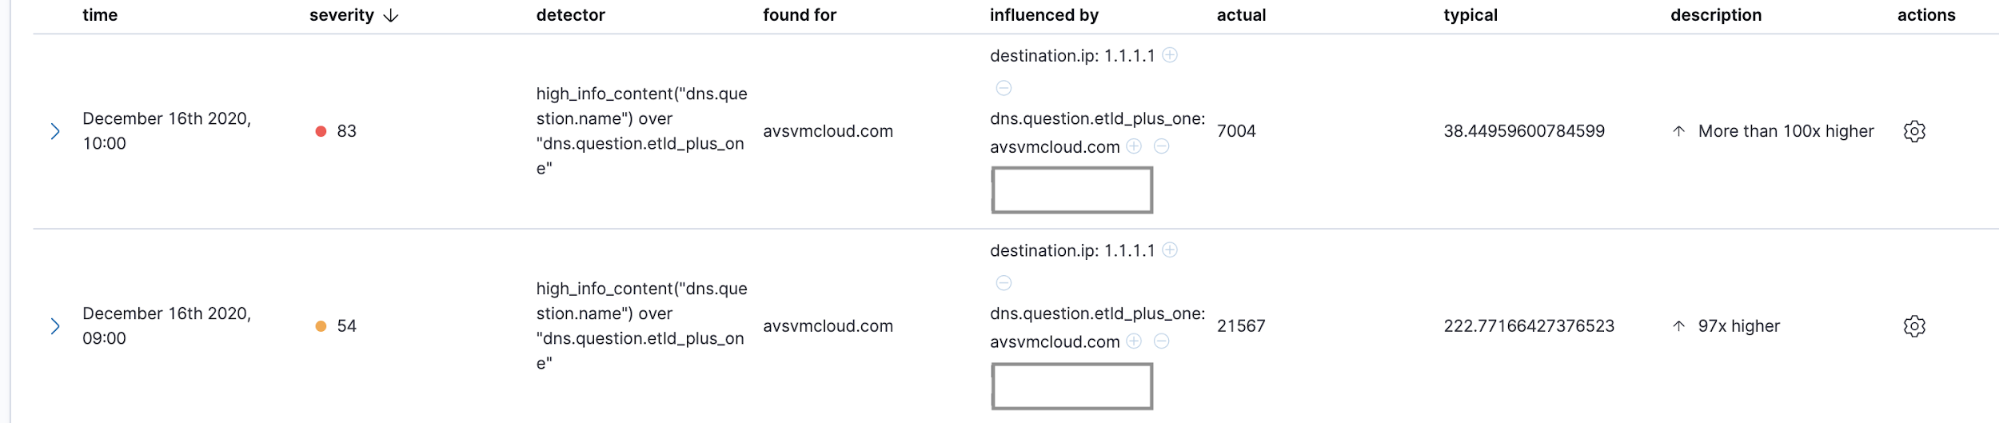
Using these Elastic Security rules, these anomaly detections, shown below, can be transformed into detection alerts and optional notifications in order to get them into appropriate incident triage and response work queues. Here is what these SUNBURST anomaly detections look like in the Elastic Machine Learning app:
This is a useful detection, but this job may not detect DGA activity all of the time. In order to strengthen DGA detection, we are shipping the experimental DGA detection workflow.
Using the experimental DGA workflow
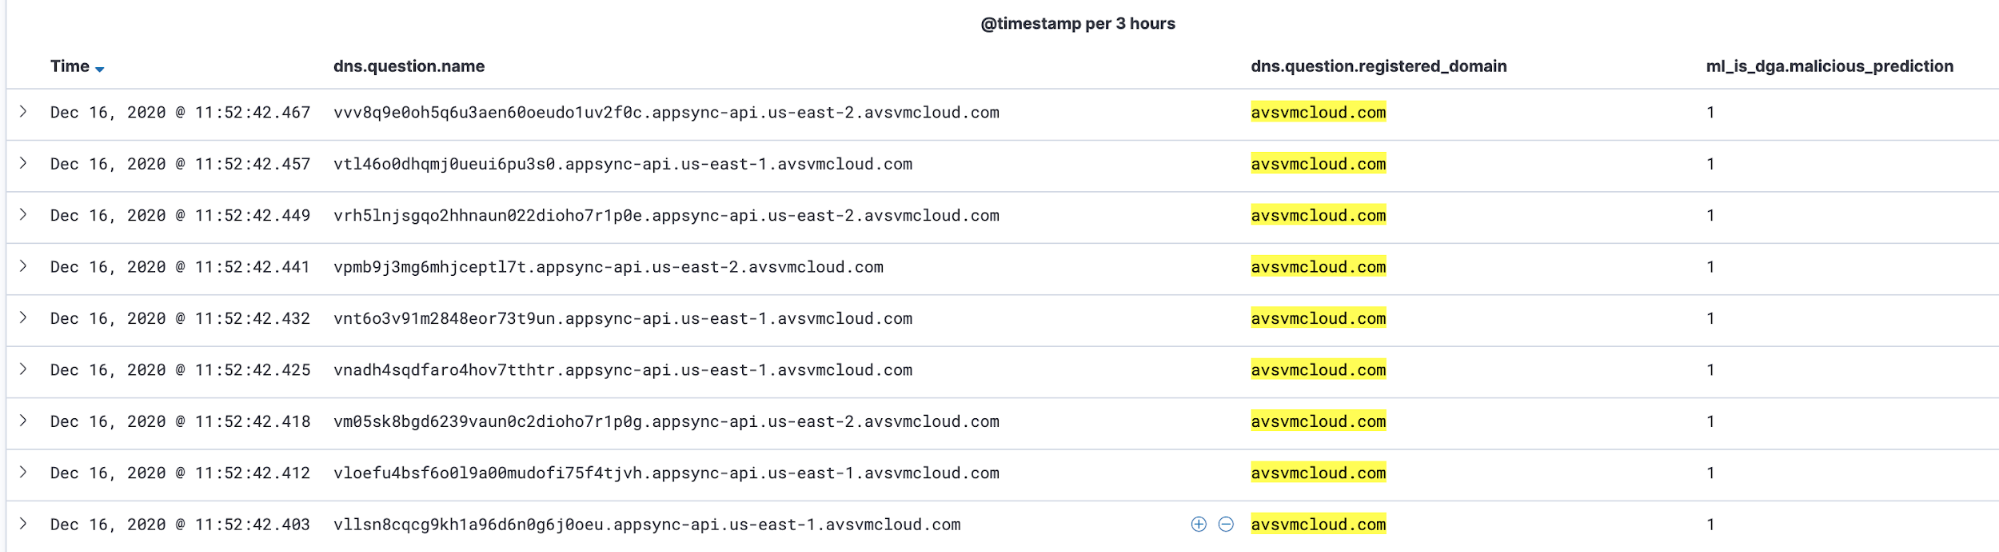
We found that the experimental DGA ML detection workflow detects most of this activity. We ran these SUNBURST DGA domains through the supervised DGA detection model discussed herein (see above for details of how to download and run this model and its rules). We found that the model tagged 82% of the names in the sample as DGA, which would have produced 1420 alerts on the sample set. Here is a screenshot of SUNBURST DNS names that have been tagged as DGA activity by the supervised model:
These events can be turned into detection alerts using the detection rule Machine Learning Detected a DNS Request Predicted to be a DGA Domain. We can also make a copy of this rule and modify it to match the observed parent domain used by a particular malware instance like SUNBURST. We can match this set of SUNBURST DGA events by adding a test to the rule query like this:
network.protocol:dns and ml_is_dga.malicious_prediction: 1 and dns.question.registered_domain: "avsvmcloud.com"
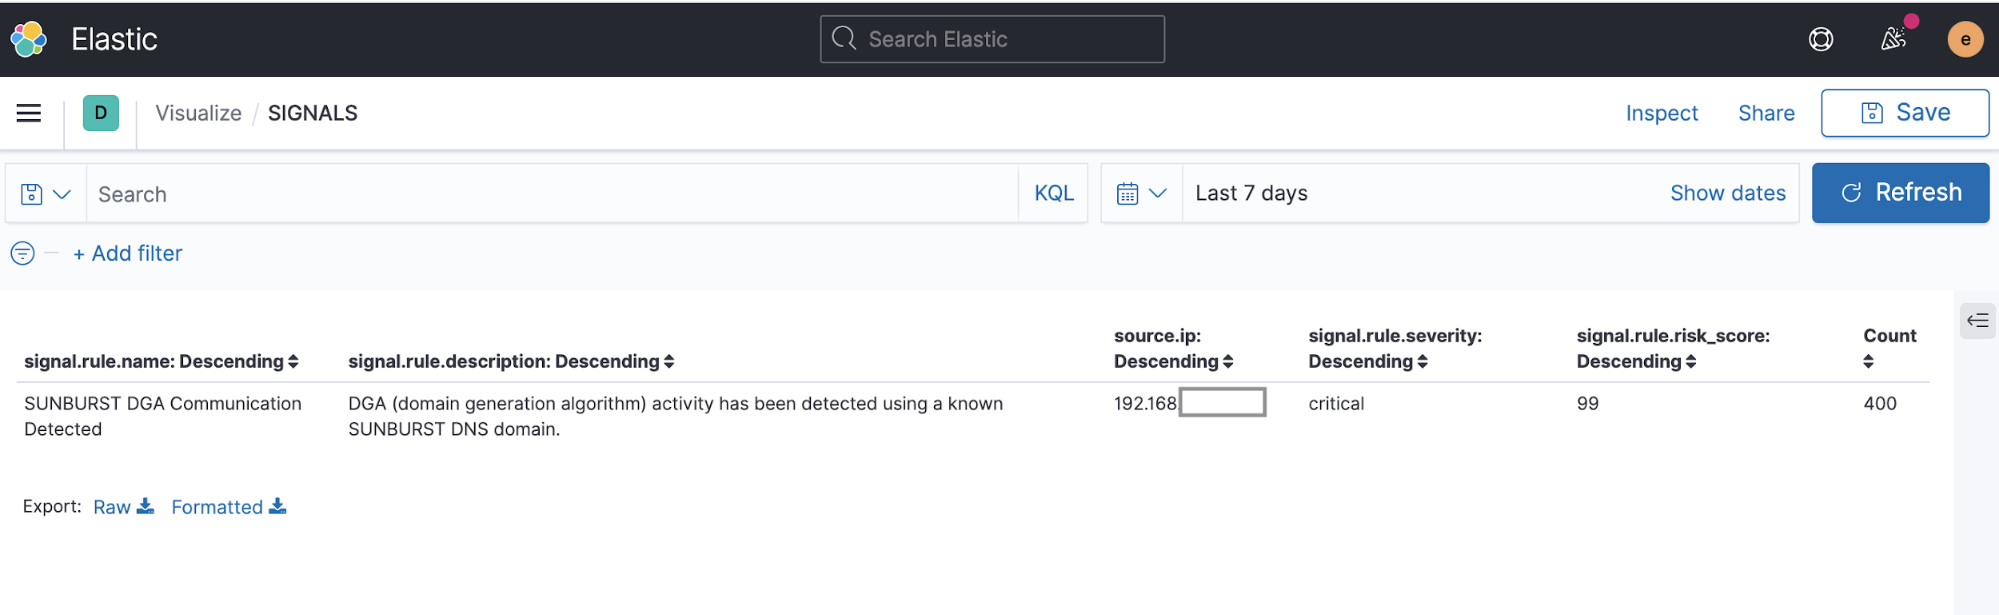
We can then give this rule a critical severity level and a high risk score of 99 in order to move it towards the front of the alert and analysis work queue. Here is a screenshot of alerts generated by this rule modified to call attention to detection of SUNBURST DGA activity:
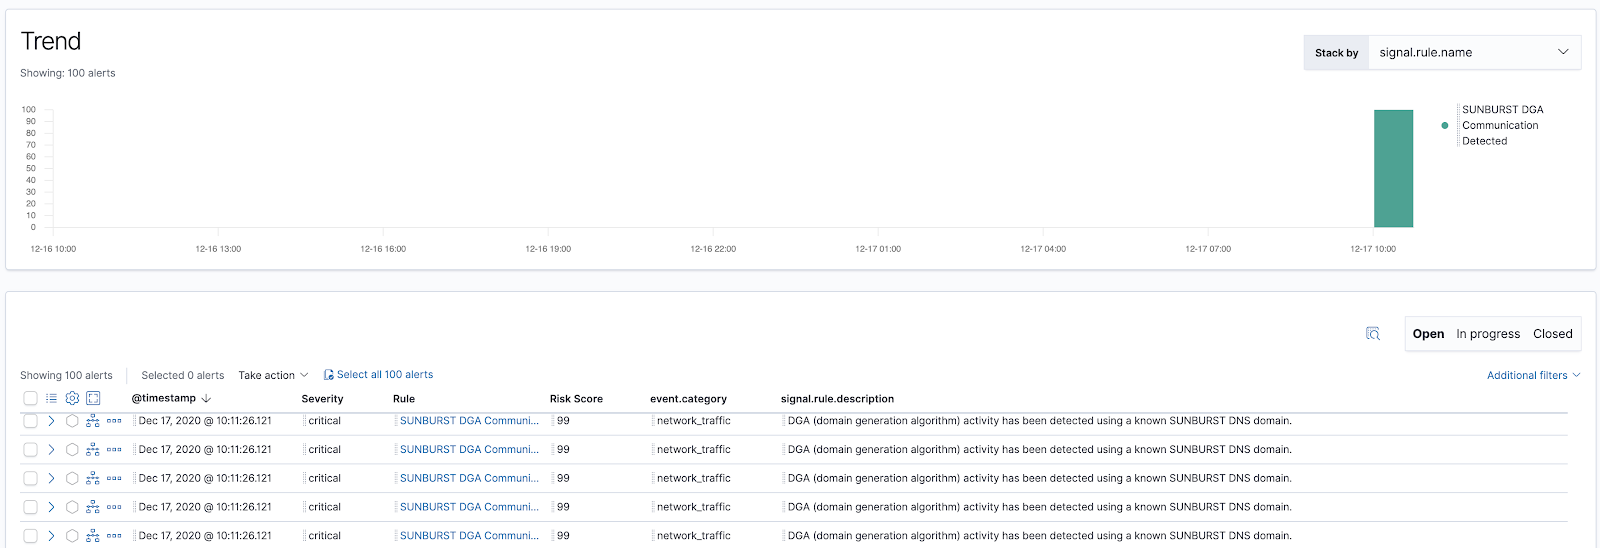
We have included this rule, Machine Learning Detected DGA activity using a known SUNBURST DNS domain, in the package. Under real-world infection conditions, a population of high frequency DGA-using malware instances could produce enough alerts to trip the max_signals circuit breaker which is set to 100 by default. In that case, we might have alerts for some malware instances and not others, depending on which events were first matched by the search.
In order to ensure we identify a greater number of infected hosts engaged in DGA activity, we have increased the max_signals value in the DGA search rules to 10,000. Note: This setting cannot be modified in the rule editor, it must be modified in an external rule file and then imported. The setting can be observed by viewing a rule file in an editor.
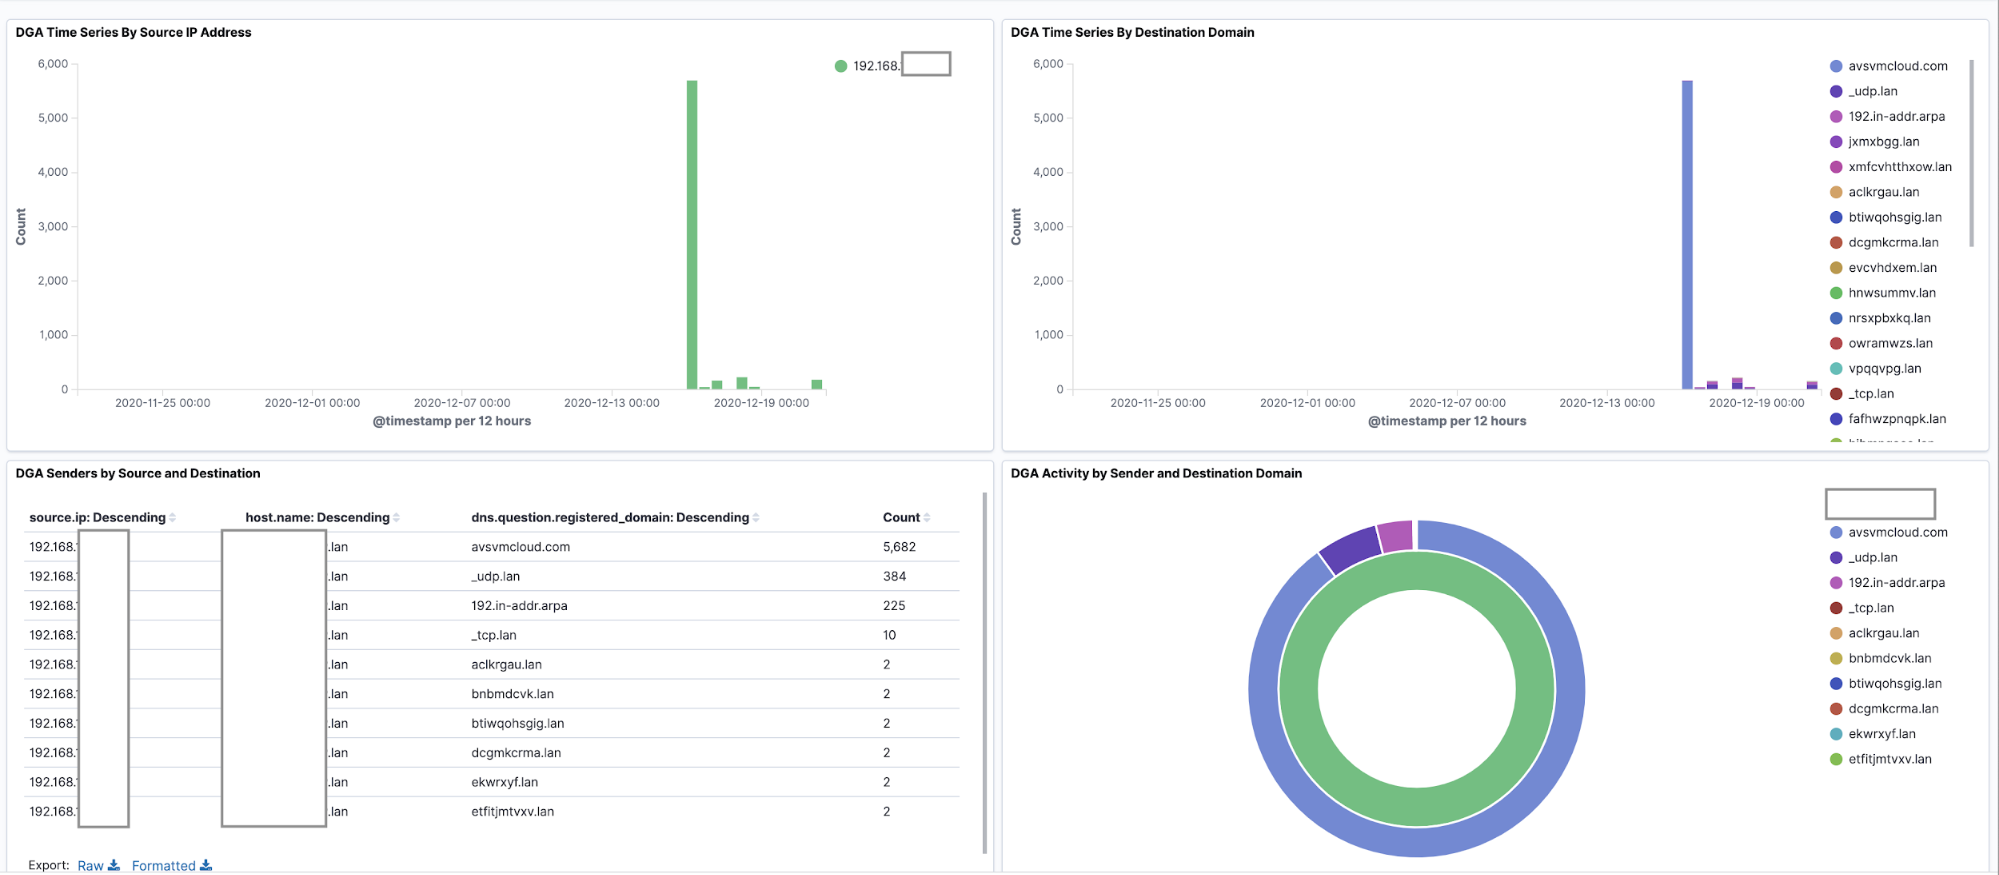
In cases where DGA activity is heavy and alerts are numerous, we can also aggregate and sift DGA alerts or events in order to count them by hostname or source IP in a data table like this:
We are also including a sample dashboard for Packetbeat DGA events with visualizations and aggregations, including this data table visualization, which is aggregated by source.ip. Alternatively, you can aggregate by host.name if your DNS events contain that field. This file is named dga-dashboard.ndjson and can be imported into Kibana by selecting Import on the Saved Objects page which can be found after selecting Stack Management.
Here is a screenshot of this dashboard rendering DGA events in a packetbeat-* index:
We’re here to help
You are not alone! If you run into any issues in this process or simply want to know more about our philosophies on threat detection and machine learning, please reach out to us on our community Slack channel, our discussion forums, or even roll your sleeves up and work with us in our open detection repo. Thank you and enjoy!