What’s new in Kibana 7.11.0: Alerting is now generally available
Kibana 7.11 is here and we’re thrilled to bring you some really exciting new developments, including:
- Alerting in the Elastic Stack now generally available
- Elastic Maps Server (locally hosted Elastic Maps data) now in beta
- Machine learning jobs are now space aware
Already convinced you want to get hands-on with these new features? A free Elastic Cloud trial only takes 3 minutes to spin up and can have you taking these new innovations for a spin in no time. Downloading the latest version of Kibana and the Elastic Stack is also really easy if you prefer the self-managed option.
For a full list of bug fixes and other changes, check out our Kibana 7.11 release notes.
Elastic Stack alerting now generally available
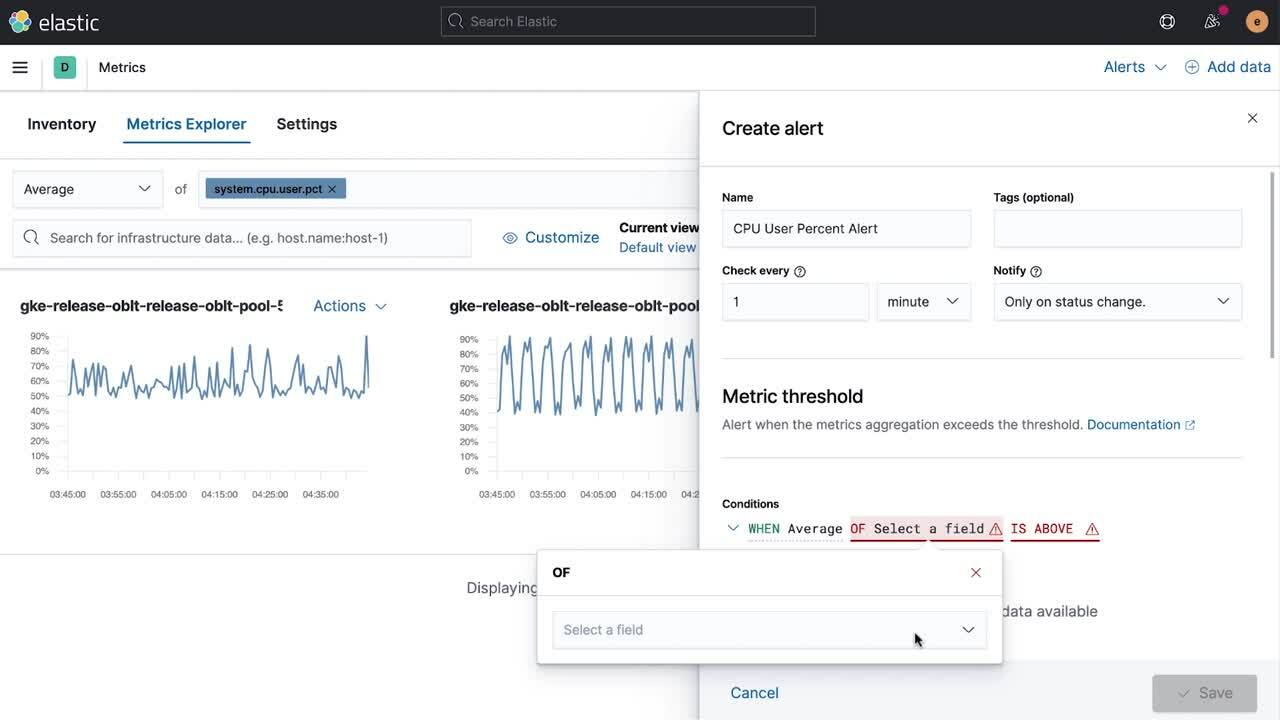
After nine months in beta we are pleased to announce that with the release of 7.11, the new alerting framework for the Elastic Stack is generally available and ready for production use cases. Built from the ground up after working for years with customers using Elasticsearch data to power mission-critical monitoring scenarios, the new alerting capabilities in the Elastic Stack stem from a core belief that alerting itself is fundamental for almost all businesses. Whether you are maintaining a website, ensuring an application is responsive, or protecting company devices from attack, the need to know immediately when something changes is paramount.
Powered by the speed and scale of Elasticsearch itself and deeply integrated into the Elastic Stack’s solutions, the new alerting framework gives you the power and flexibility to build notifications that drive not just awareness, but also action. With integrations to third-party platforms like PagerDuty, Jira, ServiceNow, and, new in 7.11, Microsoft Teams, you can do more than just sound the alarm. From triggering escalations to opening incident tickets, alerting in the Elastic Stack is designed to help you spot, react to, and resolve issues in real time.
For more information on the general availability of alerting in the Elastic Stack as well as its new 7.11 features, be sure to check out our featured alerting blog post.
Organize Kibana with tags
Elastic has many users with tens, hundreds, and sometimes even thousands of dashboards, visualizations, and other Kibana assets. In 7.11, we’ve introduced a better way to manage your content using tags. While straightforward in concept, tags can be an extremely powerful tool to navigate, filter, and back up user-created items.
Tags are great when used to group content into one or multiple categories within a space. For example, you may want to group specific dashboards under production, QA, and development environments. Or maybe you’d like to tag a visualization by the owner — whether that’s a team, a geographic region, or even yourself.
Once created and assigned to a saved object, you can then leverage tags within Kibana applications. This is a quick way to visually group and filter your content.
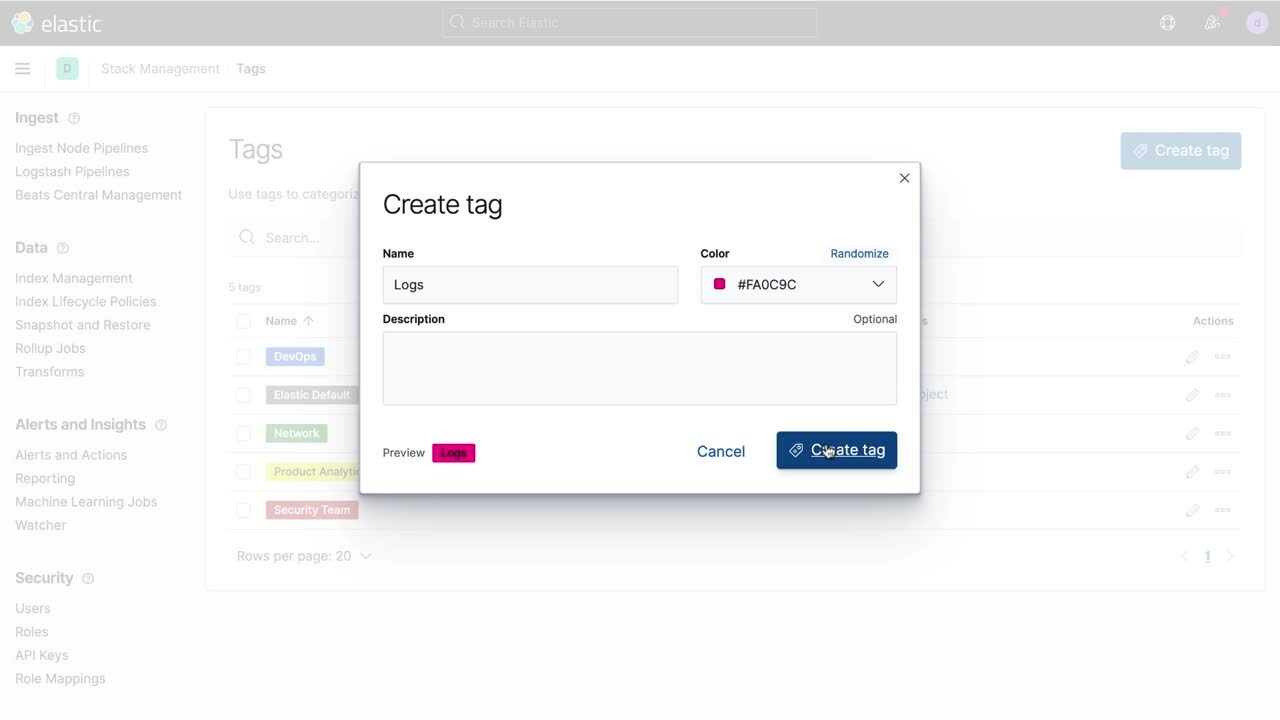
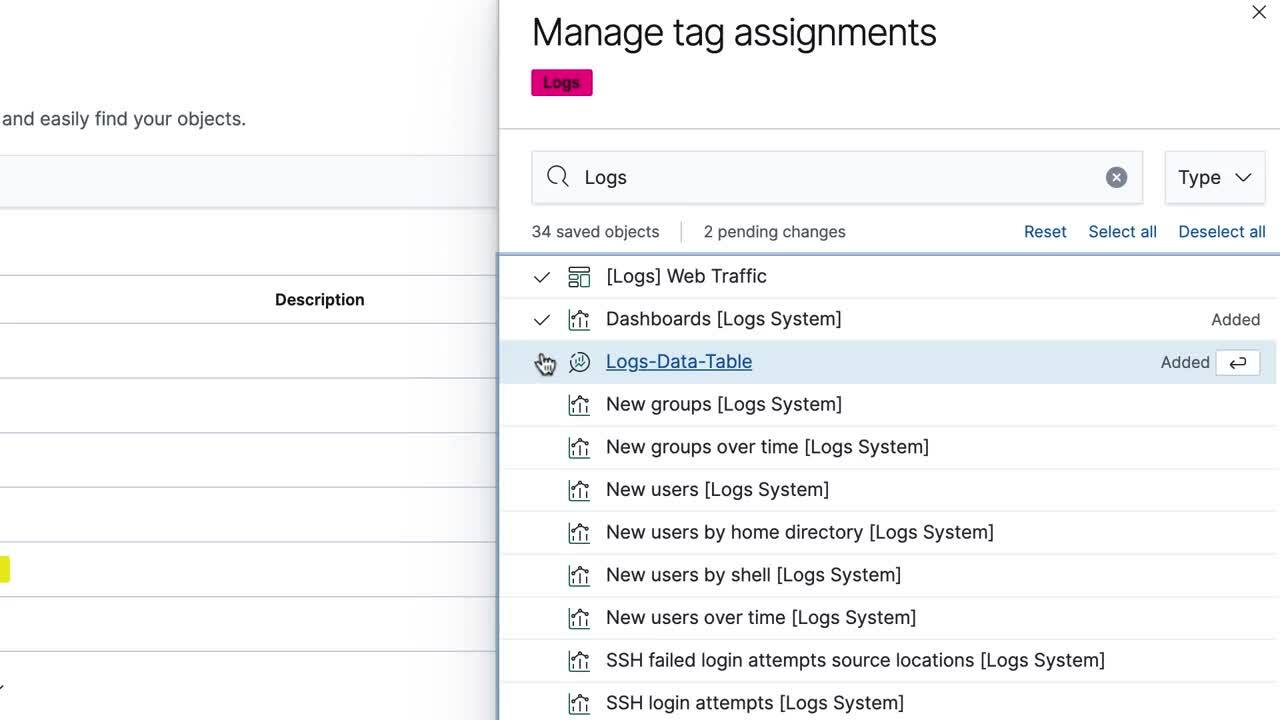
There is also now a tag management tool that lives within Stack Management. Here you can not only create new tags, but also do things like assign and delete existing tags in bulk operations. So if you are one of the many Kibana users that already have hundreds of dashboards that need to be tagged, fear not — it’s only a quick search and a few clicks away. And speaking of search, we have also incorporated tags into navigational search. By typing in a tag name, Kibana will suggest a filter for you to fine tune your search. Tag filters can be combined with type filters and plain text. This quickly streamlines navigation to the content most relevant to you.
We are very excited to deliver on this long-standing request from the community. In this release, tags are supported by visualizations, Lens, dashboards, and maps. This list will continue to grow over time. If you’d like to see support for other assets in Kibana sooner than later, feel free to open an issue in the Kibana repo.
Visualizing your data in Kibana
On the heels of Kibana Lens becoming generally available in 7.10, we’ve continued to work on functionality, experience, and visual design improvements so visualizing your Elasticsearch data is even more expressive.
Pick your color palette
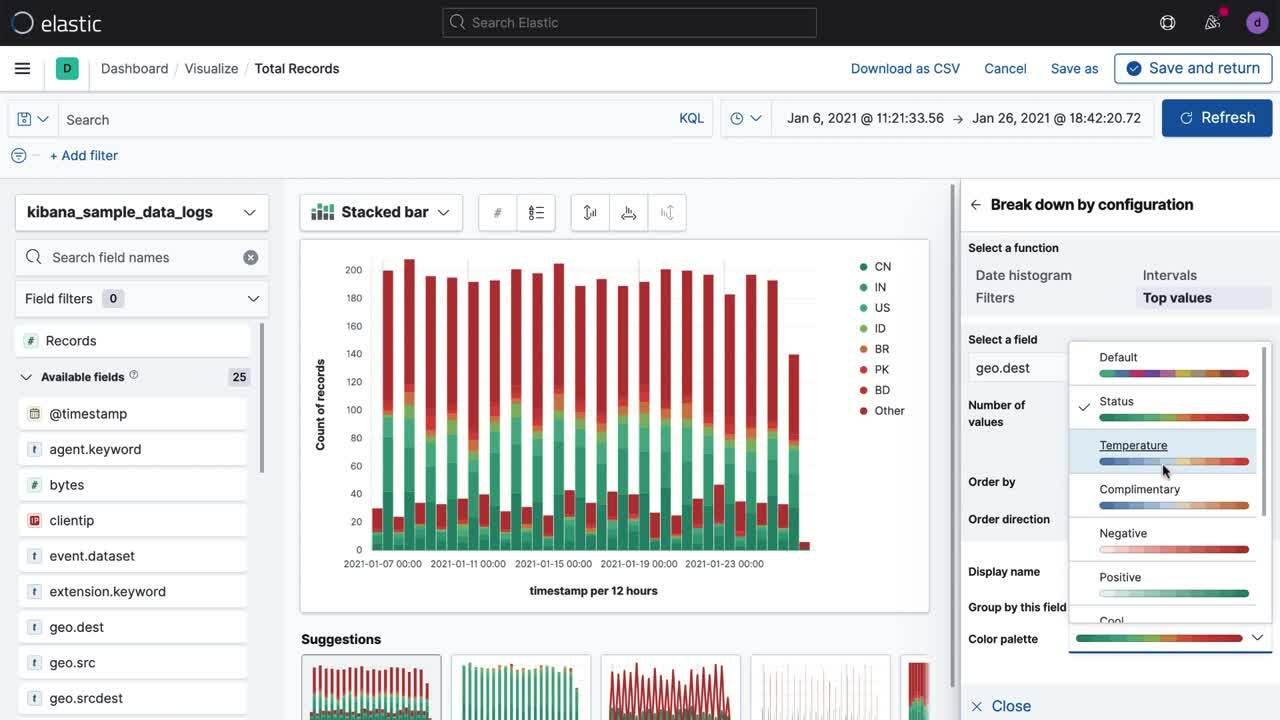
One of our most requested features in Lens has been the ability to customize the colors when using the “Break down by” ability to create a stacked bar chart, pie chart, treemap, etc. In 7.11 you can now select from one of 10 color palettes, including options that emphasize contrast for discrete data as well as gradients for showing degrees of difference.
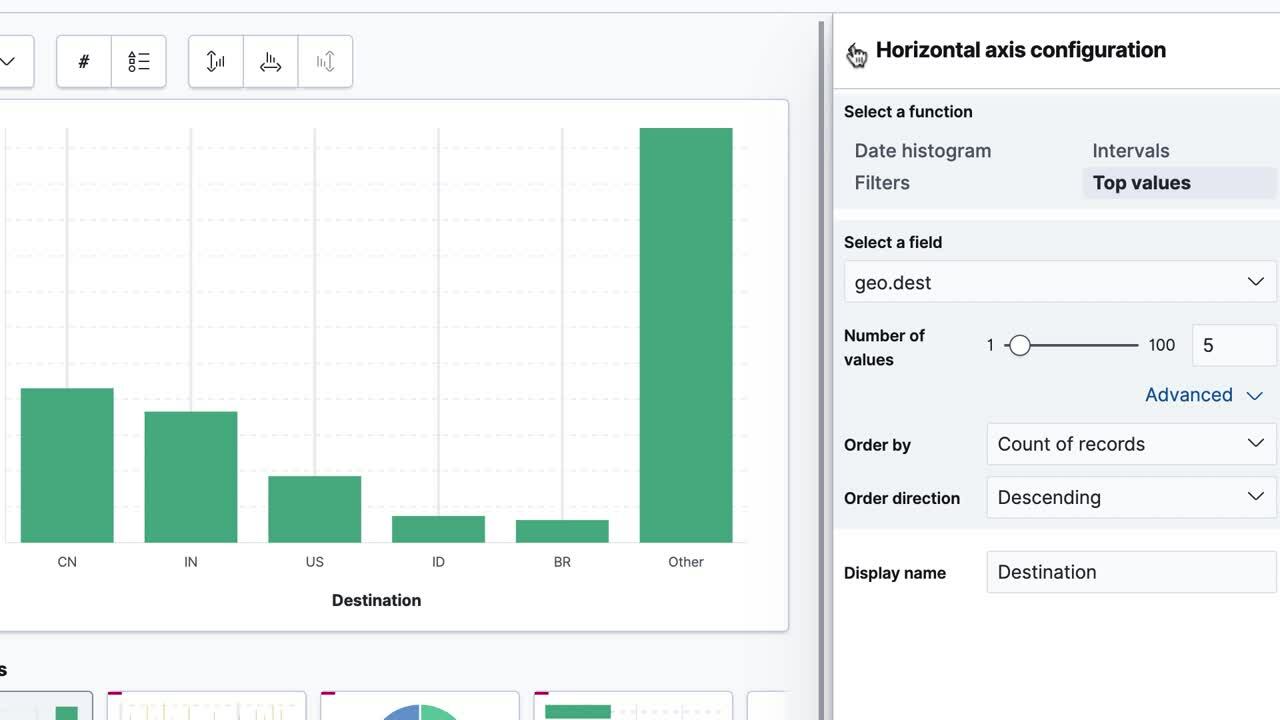
Customize your chart labels
Continuing our theme of pretty and functional, we have added the ability to specify a custom axis label for a given range. Now you can create clear and informative labels for your custom ranges. Additionally, for bar charts in 7.11 you can turn on value labels that show you the precise number or percentage of any given bar in your analysis when using a discrete field from your index (e.g., host name, country, tag, etc.).
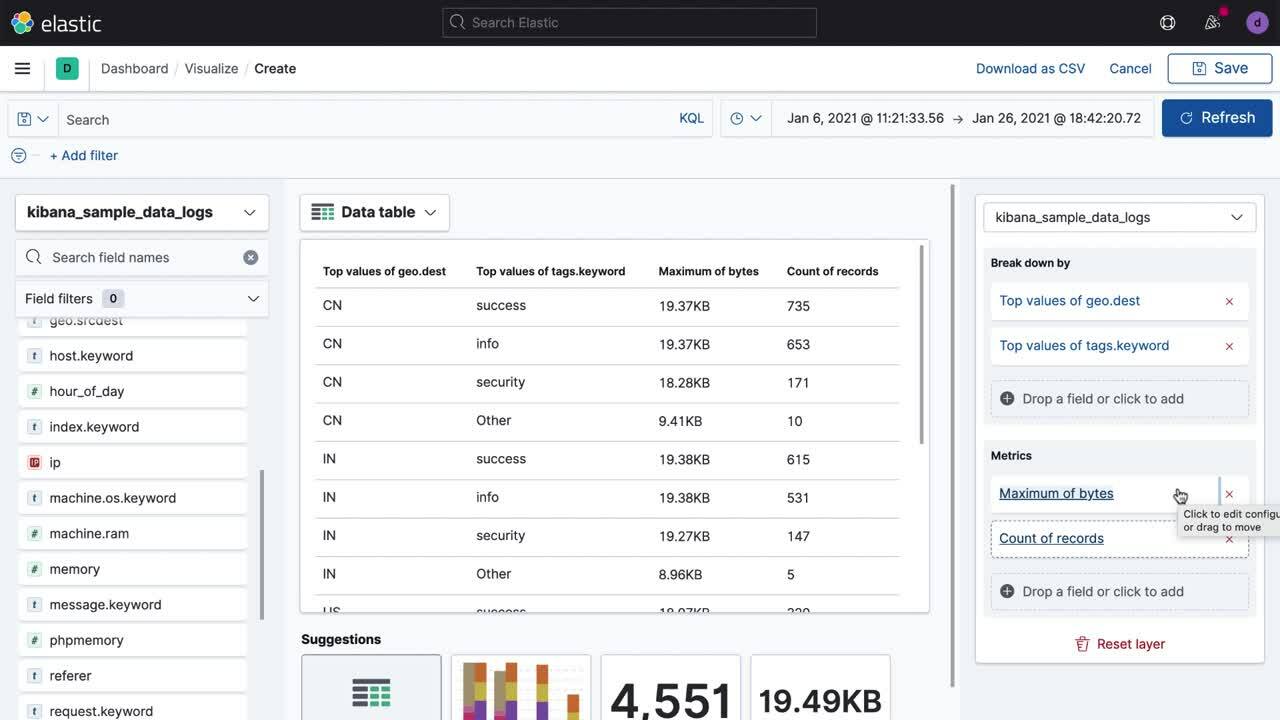
Faster data table reordering
Regardless of whether you call it a report, a pivot table, a matrix, or a data table, creating rows and columns of data is a fundamentally important way to show data, and in Kibana 7.11 we’re improving your ability to make changes on the fly. Now you can rearrange the order of data table columns in Kibana Lens by simply dragging and dropping specific fields to match the order you want. Even better, this works for pie charts and treemaps as well!
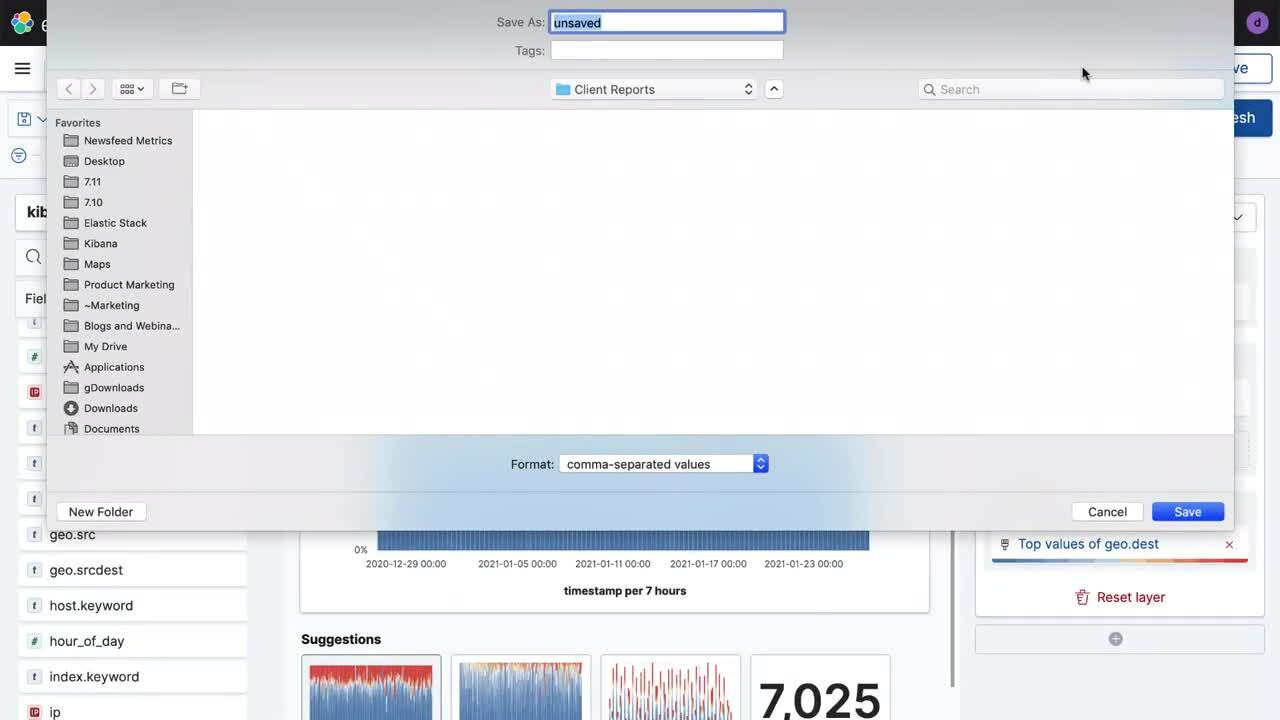
And last, but certainly not least, in Kibana 7.11 you can now export chart data from Lens to CSV for manual use or for importing into other systems.
More drilldown triggers for making Kibana actionable
Drilldowns in Kibana are the ideal way to help you go from dashboard insight to decisive action. Whether you’re selecting a point on a map to move to a more granular dashboard analysis or clicking a row in a table tied to a URL drilldown to bring you to a third-party application, drilldowns improve workflows for taking the next step.
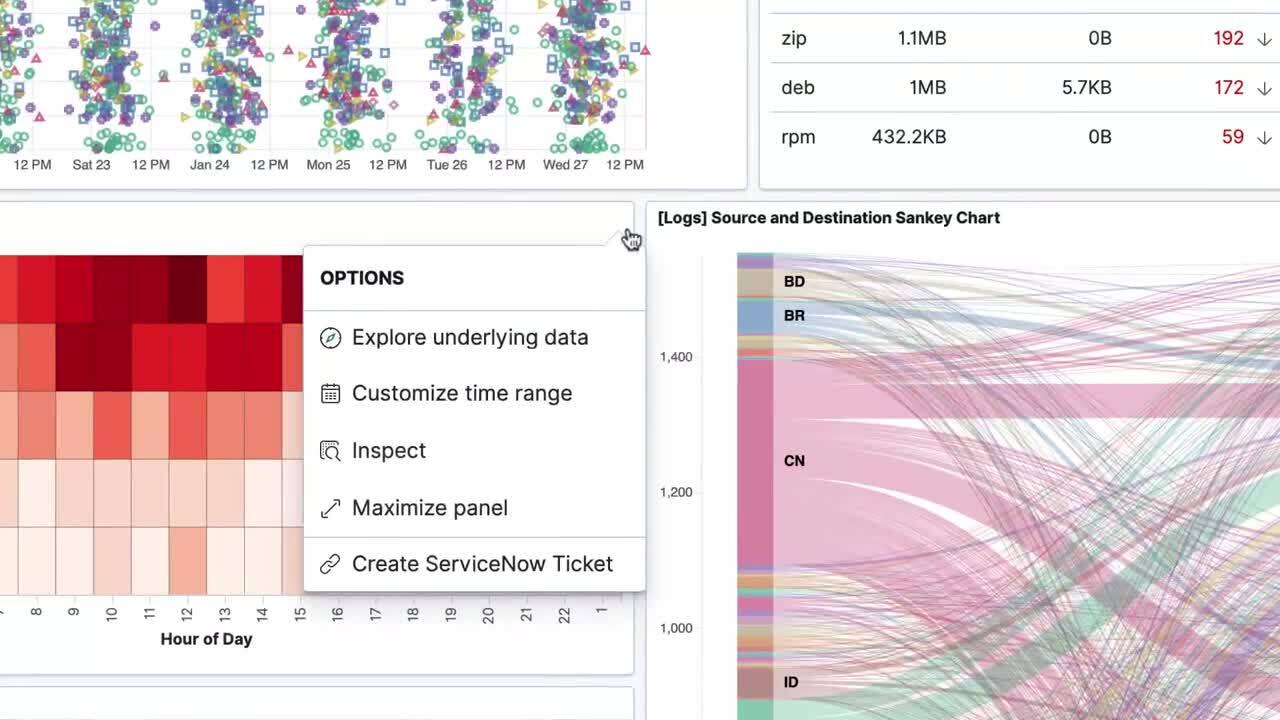
In 7.11 we have added two new trigger enhancements to URL drilldowns designed to make it easier to surface the drilldown interface. The first is called the context menu trigger and, as the name implies, it lets you expose URL drilldowns in the context menu dropdown.
The second, called the table row trigger, adds the ability to configure a URL using one more columns when being used with a Kibana Lens table. Table row triggers are great for building a path from a Kibana dashboard to another platform where multiple URL parameters can be used to augment the page a user lands on (e.g., prepopulate an incident form with data from the dashboard AND set the status to ‘urgent,’ etc.).
Elastic Maps goes on-prem, connects the dots, and more
Elastic Maps Server (beta)
Using maps in secure air-gapped settings or where internet connectivity is limited just got easier with 7.11. Introducing the beta release of Elastic Maps Server, a downloadable docker image containing the default basemaps and boundaries used for doing geospatial analysis in Kibana. Try it for yourself now using your Elastic Enterprise subscription.
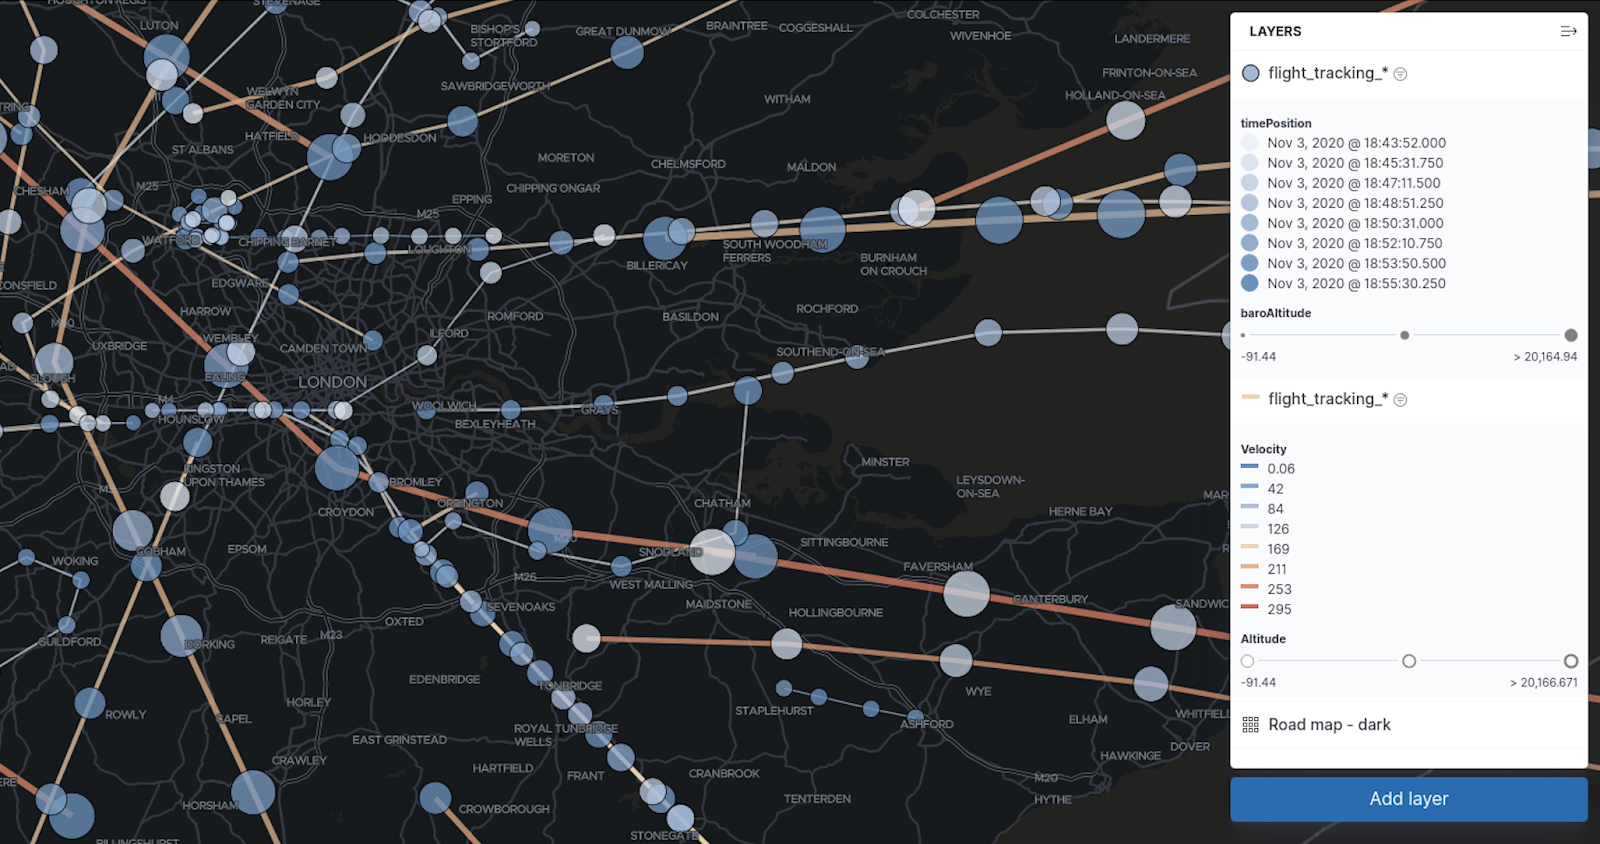
Tracks layer
Also new in the Kibana 7.11 release, a new layer type in Elastic Maps. The tracks layer is a simple way to connect the dots, taking an index of point locations, ordered by time, and displaying them as a line. This is perfect for anyone working with GPS, sensor, or location-tracked time series data who wants to visualize the routes and paths of their data.
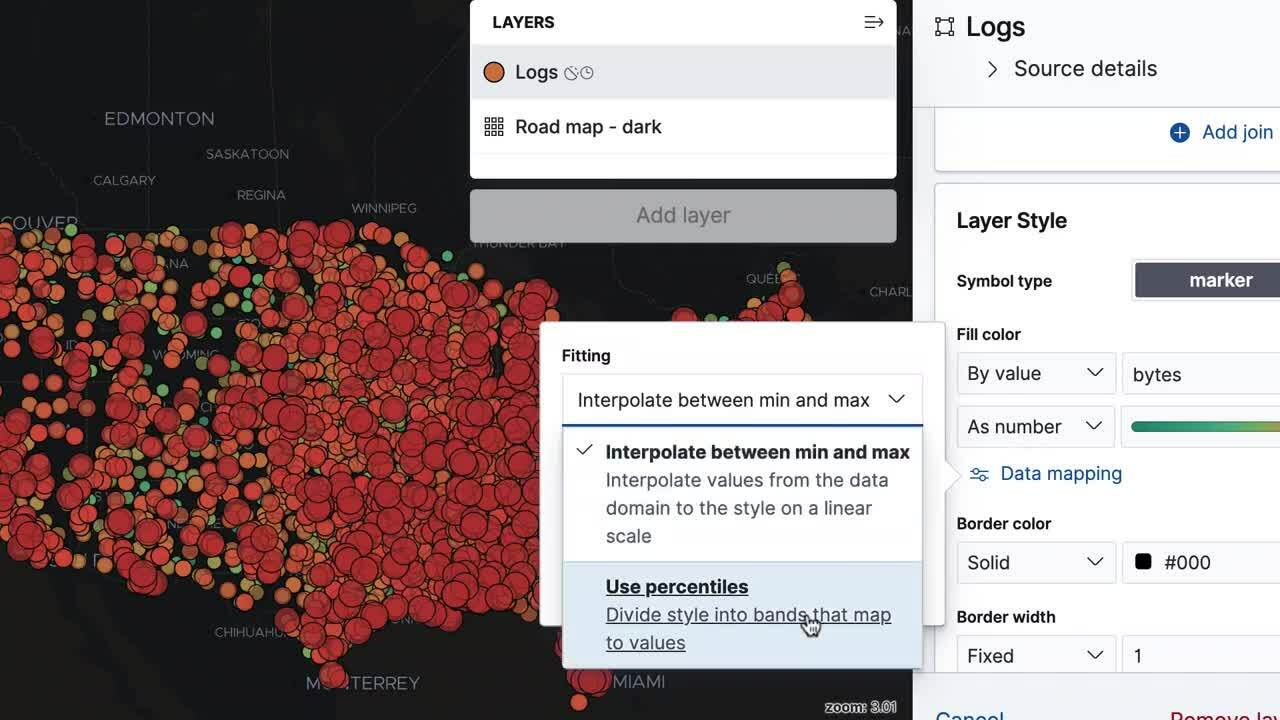
Style by percentile
There are new options for styling layers in 7.11. You can now style by percentile and add any number of percentile ranges. It’s never been easier to see above and below the mean.
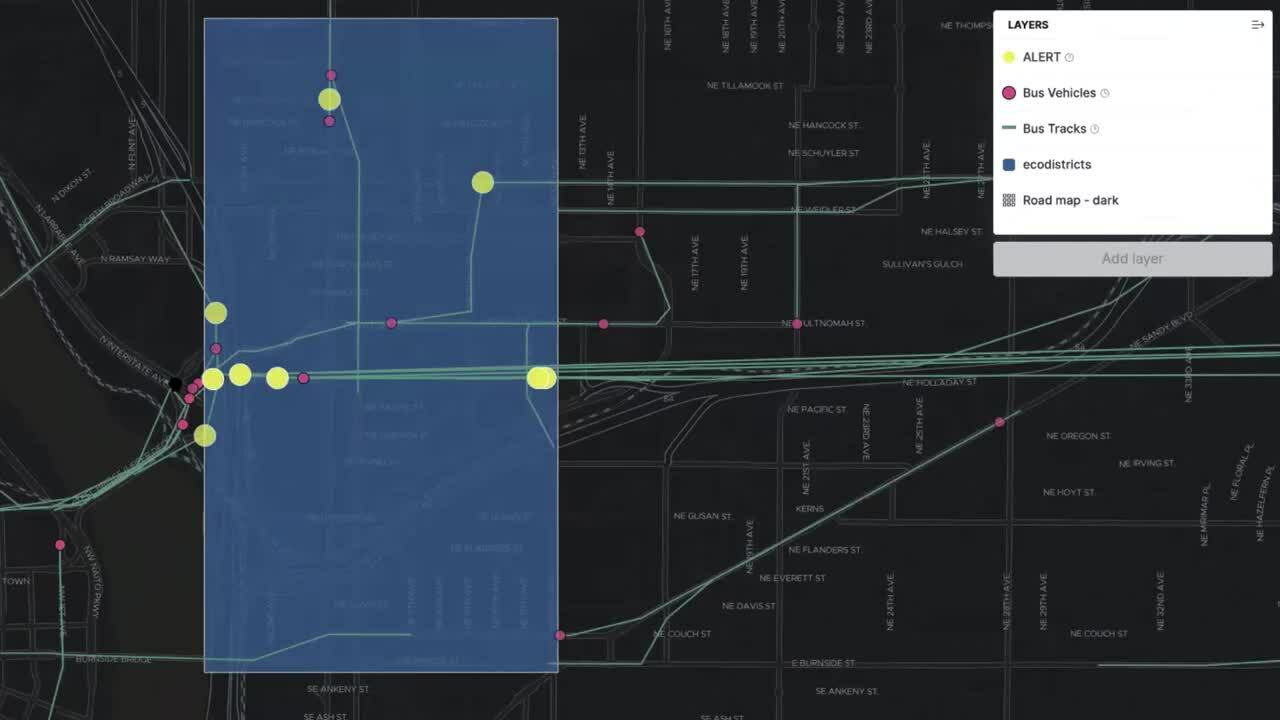
More geo alerts (beta)
In Kibana 7.10 we introduced a new location-driven alert called the tracking alert. In 7.11 we’ve enhanced this alert to allow you to trigger notifications when entities enter, leave, or cross a boundary. We have also added a wholly new geographic alert based on containment designed to monitor the location of an entity while it remains inside a specified boundary. Both of these geo alerts are still currently in beta and require an edit to your kibana.yml file that adds the following modification:
xpack.stack_alerts.enableGeoAlerting: true
Sharing Kibana assets publicly with anonymous access
The ability to make beautiful and insightful things inside of Kibana has often caused the community to wish there was an easy way to share saved objects like dashboards and visualizations simply by forwarding a link. No user name. No password. Just the ability for someone to click on a Kibana link and land directly inside an environment. With 7.11 we’re making that wish come true with release of anonymous access. From maps to dashboards to literally any Kibana saved object, you can now create specialized links that let anyone access an asset without being prompted for credentials.
With anonymous access you can now choose how to bring viewers into your Kibana environment and what objects they can see:
- Embed your assets in an external-facing application or website
- Link directly to Kibana and give anonymous dashboard-only or solution-restricted access to one or more Kibana spaces
- Create an entire demo instance of Kibana that anyone within your organization can access and explore
If your audience is a mix of registered and non-registered Kibana users, you can also prompt them to select whether they want to continue as a guest or log in. Otherwise land them directly on your public resources, bypassing the authentication step entirely.
And of course you are in full control of what you share publicly and the level of public access you permit, since anonymous access is a natural addition to the familiar Kibana security model. Check out the docs to learn more about anonymous access and start sharing.
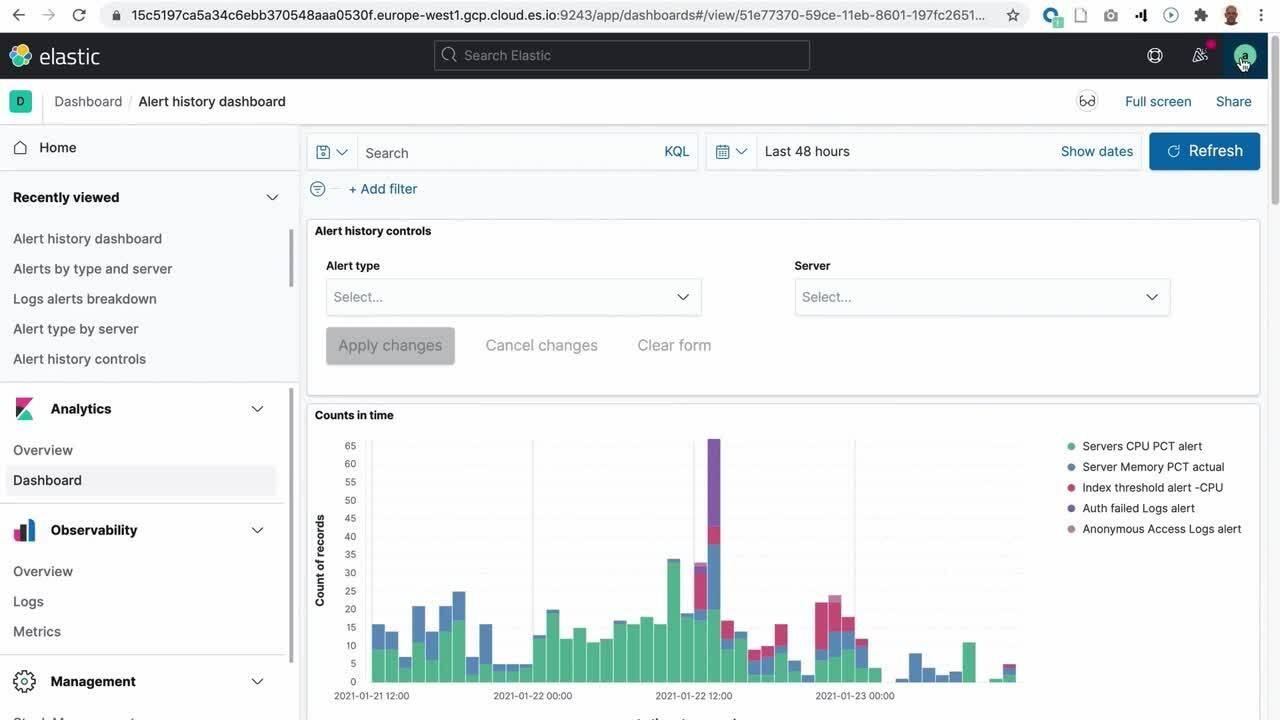
Enhanced security, accountability, and compliance with new Kibana audit logging
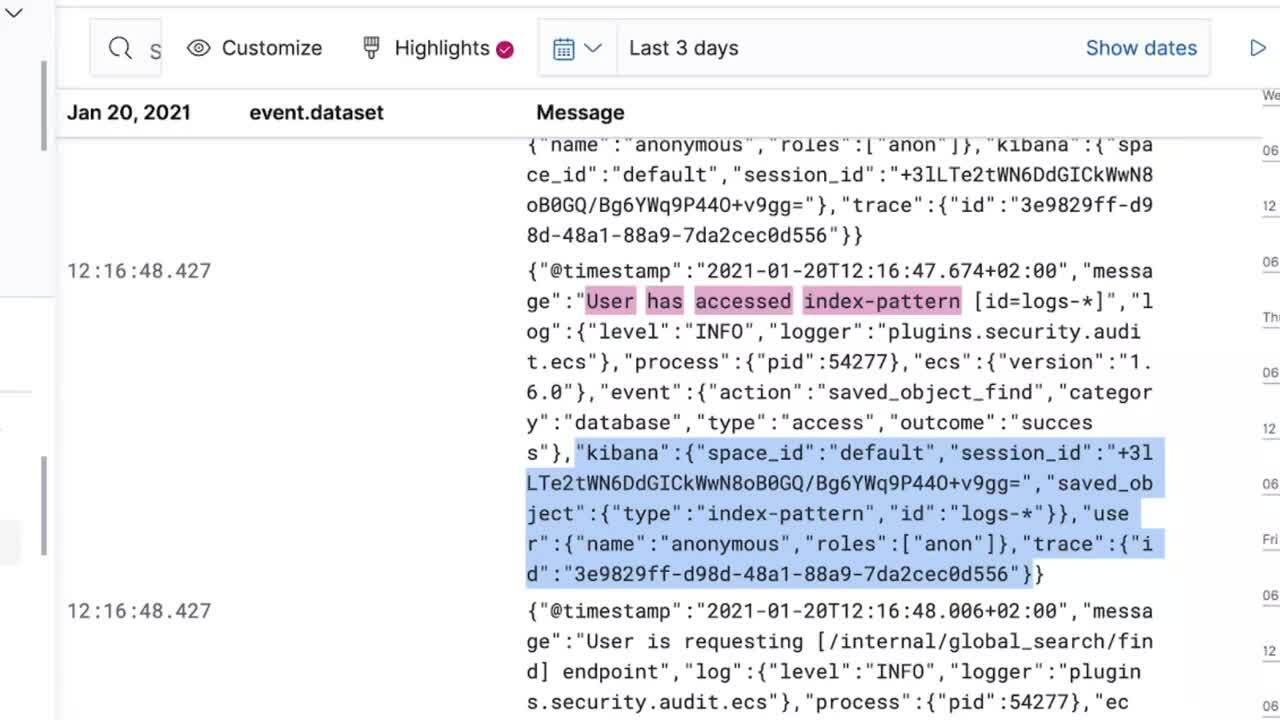
Kibana 7.11 introduces a brand new audit logging capability offering a full audit trail of user activity and audit events. The new Kibana audit logging records a wide array of events, including authentication and authorization, CRUD operations on Kibana saved objects (such as access, changes, and deletion of your dashboards, visualizations, maps etc.), HTTP requests, and more. From who a specific user is, the action(s) they take, and even the event context complete with timestamp — this new audit logging capability gives you a complete picture of activity in Kibana.
Even better, the new Kibana audit logging is Elastic Common Schema (ECS) compliant so audit data is easily ingested into Elasticsearch and natively consumed by Kibana applications. Set it up and watch audit logs appear in the Elastic Logs app or Elastic Security, or use Discover to do ad-hoc investigation. Combine the new Kibana audit logs with Elasticsearch audit logs to get a full cross-stack picture of activity within your Elastic Stack deployment.
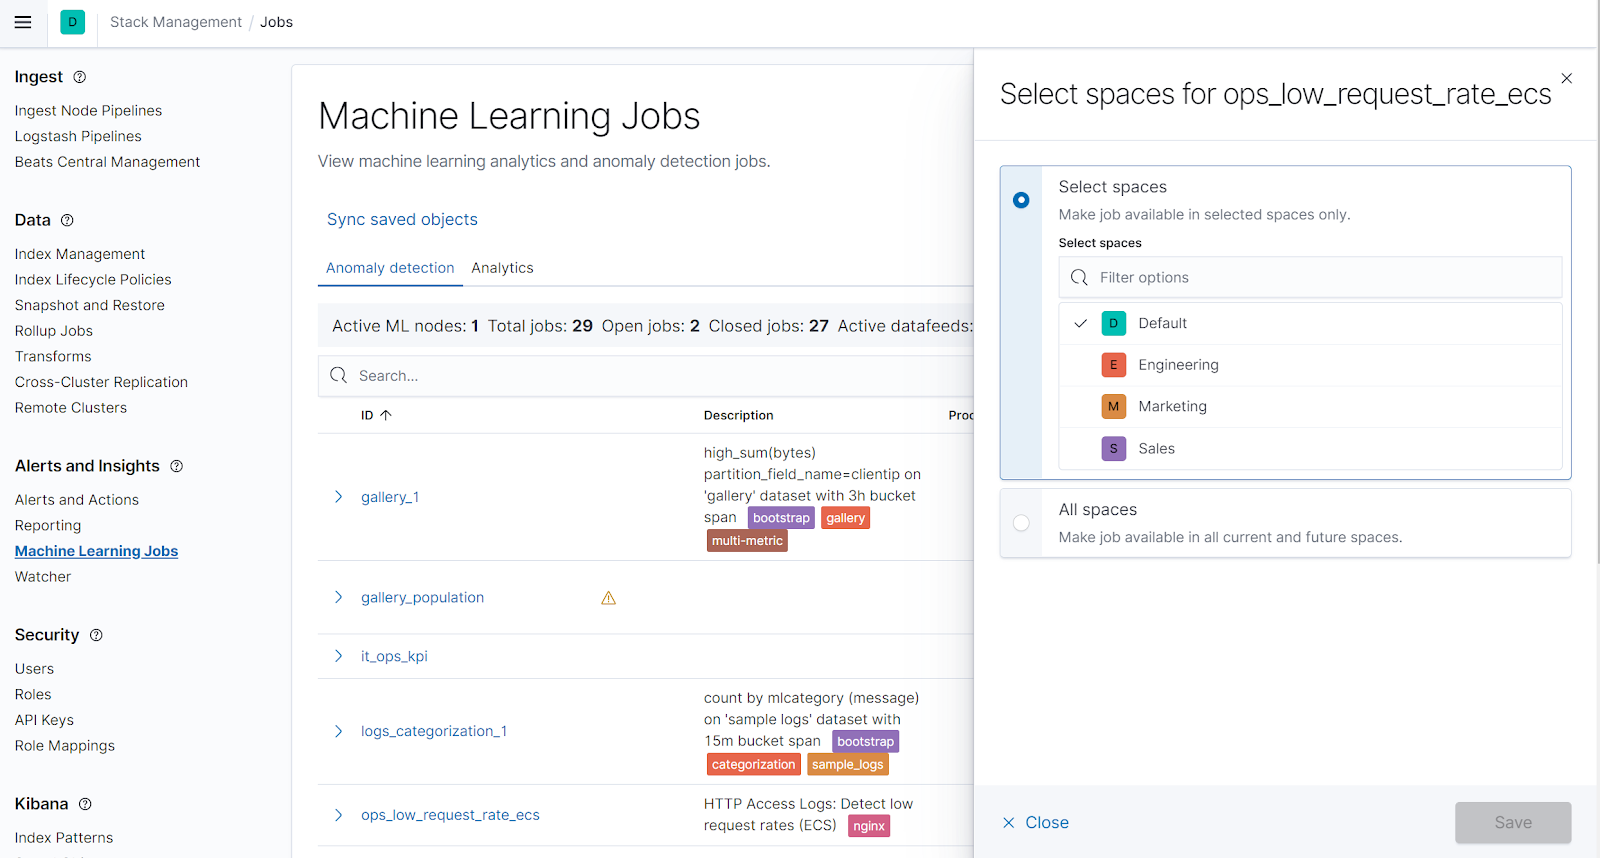
Machine learning jobs are now space aware
With the 7.11 release, both anomaly detection jobs and data frame analytics jobs can now be made available on a per-space basis. Users can manage which spaces their machine learning jobs are available from by selecting the new Machine Learning Jobs option within Stack Management. Inside this new management view a user with the correct permissions can select one or multiple spaces where a machine learning job will be available, as well as make a job available to all spaces.
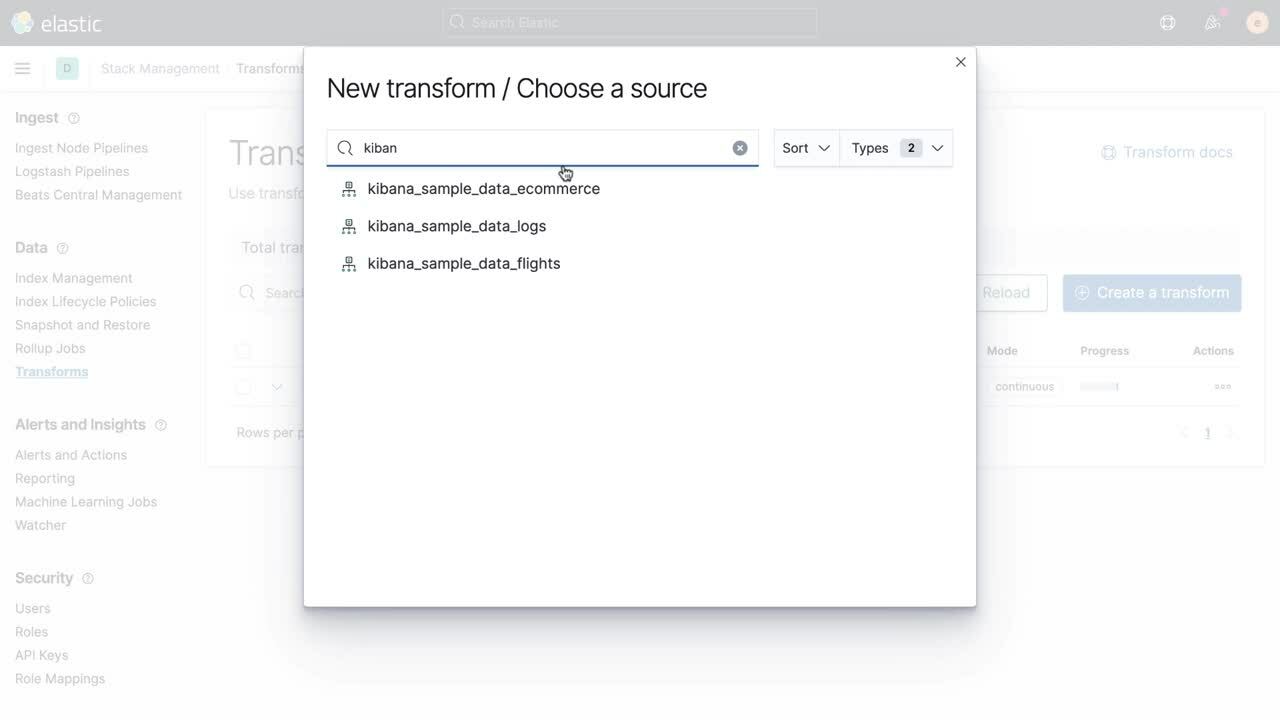
Transform adds a new type: Latest
Transforms in 7.11 has added another type focused on allowing you to copy the most recent documents to a new index. This new transform type, called Latest, works by identifying one or more fields as a unique key and a date field for sorting, then creating an index that can be updated with the most recent document. Scenarios where this becomes especially useful include where companies are trying to keep track of the latest purchase their customers have made or in a monitoring setting where tracking the latest event coming from a host is critical.
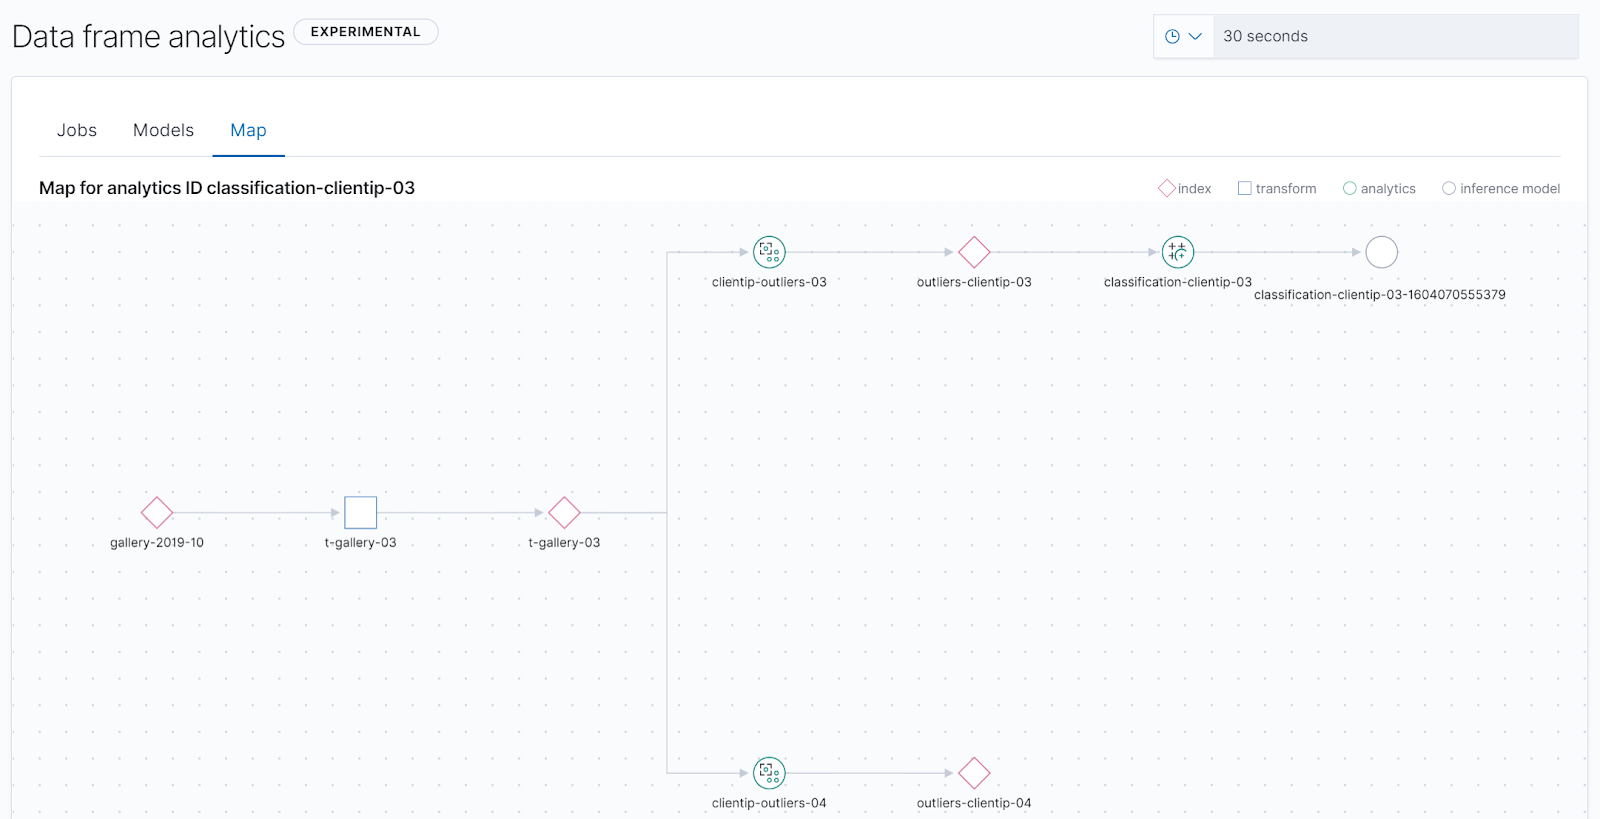
Data frame analytics UI Map view
We have added a new way to visualize your data frame analytics jobs by adding a map-style view to complement the existing jobs and trained models lists. This shows you how your jobs are connected to source indices and transforms, and any subsequent jobs and models that have been created. This provides an initial way to map out a supervised learning workspace, identifying related configurations, which can be useful for example in deleting jobs which are no longer required.
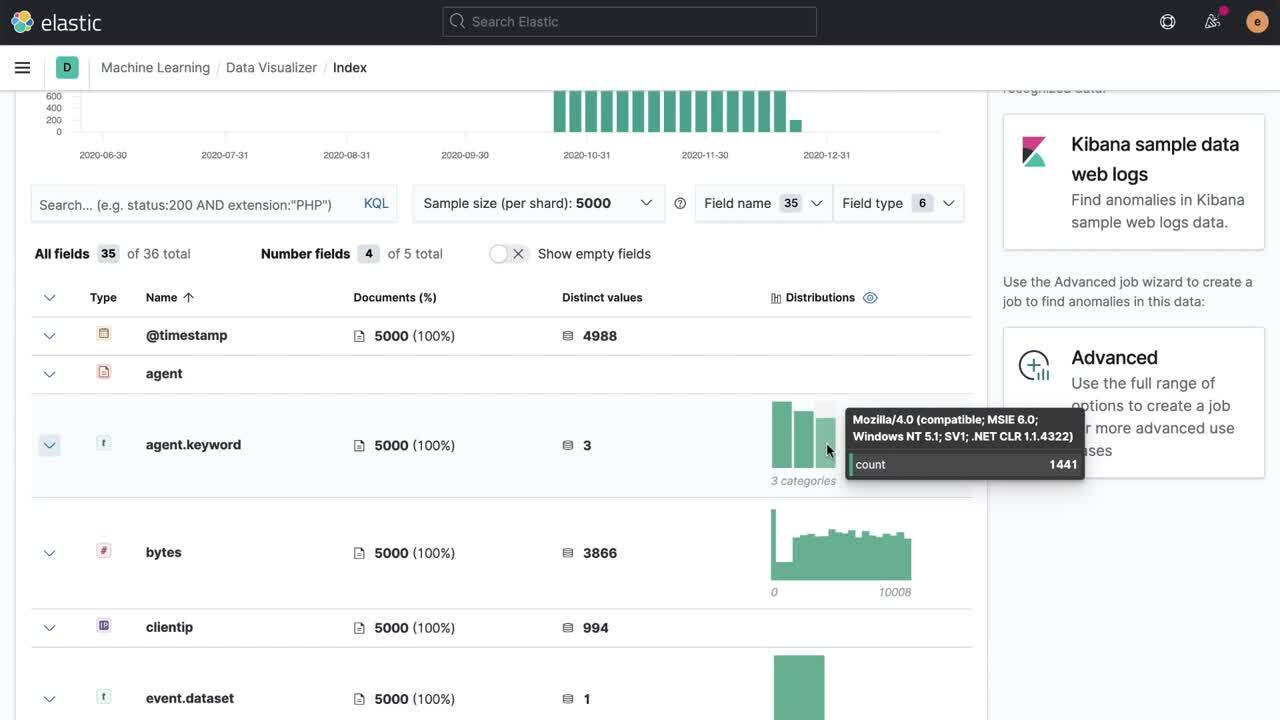
Index-based data visualizer gets new design
The Machine Learning data visualizer provides a great view into your Elasticsearch indices, giving you a better understanding of your data fields prior to creating anomaly detection or data frame analytics jobs. In 7.11, we’ve redesigned the visual layout from a card-based display to a more compact table. This has the benefit of being able to show more results, a new document count chart, and now offers the ability to expand rows for viewing details on individual fields.
Try Kibana 7.11 today
All of these 7.11 features are available now with a free trial of Elasticsearch Service on Elastic Cloud. For a self-managed experience, try downloading the latest builds of Elasticsearch and Kibana and installing it on your own infrastructure.
Like what you see or have a question? You can always find us on Twitter (@elastic) or in the Kibana forum and in the Kibana GitHub repo.
Related blogs: