Elastic 7.10 released, with a beta of searchable snapshots and the GA of Kibana Lens
We are pleased to announce the general availability of Elastic 7.10. This release brings a broad set of new capabilities to our Elastic Enterprise Search, Observability, and Security solutions, which are built on the Elastic Stack — Elasticsearch, Kibana, Beats, and Logstash. 7.10 delivers significant new capabilities to market, transforming the way in which our customers and users can trade off cost, performance, and depth of data with searchable snapshots. Elastic Enterprise Search makes it easy to connect to Slack and to Salesforce sandboxes. Elastic Observability welcomes new capabilities for user experience monitoring and synthetics. Elastic Security is automating the detection and prioritization of complex threats with the beta of Event Query Language (EQL) correlation rules and indicator match rules. 7.10 also welcomes the general availability of Kibana Lens, a powerful drag-and-drop tool for visualizing and analyzing data.
We are also continuing to improve the capabilities of Elastic Cloud, the best place to deploy the Elastic Stack and our solutions. In the last few months, we have launched a new solution-specific getting started experience and enhanced compliance with access to audit logs. And, of course, Elastic 7.10 is available right now on Elastic Cloud — the only hosted Elasticsearch offering to include all of the new features in 7.10. Or you can download the Elastic Stack and our cloud orchestration products, Elastic Cloud Enterprise and Elastic Cloud for Kubernetes, for a self-managed experience.
This is a packed release, and we are excited to share some of the key release highlights below. To get the full feature rundown, dive into the individual solution and product blog posts, but for now, let’s dig in.
Deepen enterprise search with more content sources and enhanced cloud usability
Expand access to content with connectors to Slack and to Salesforce sandboxes
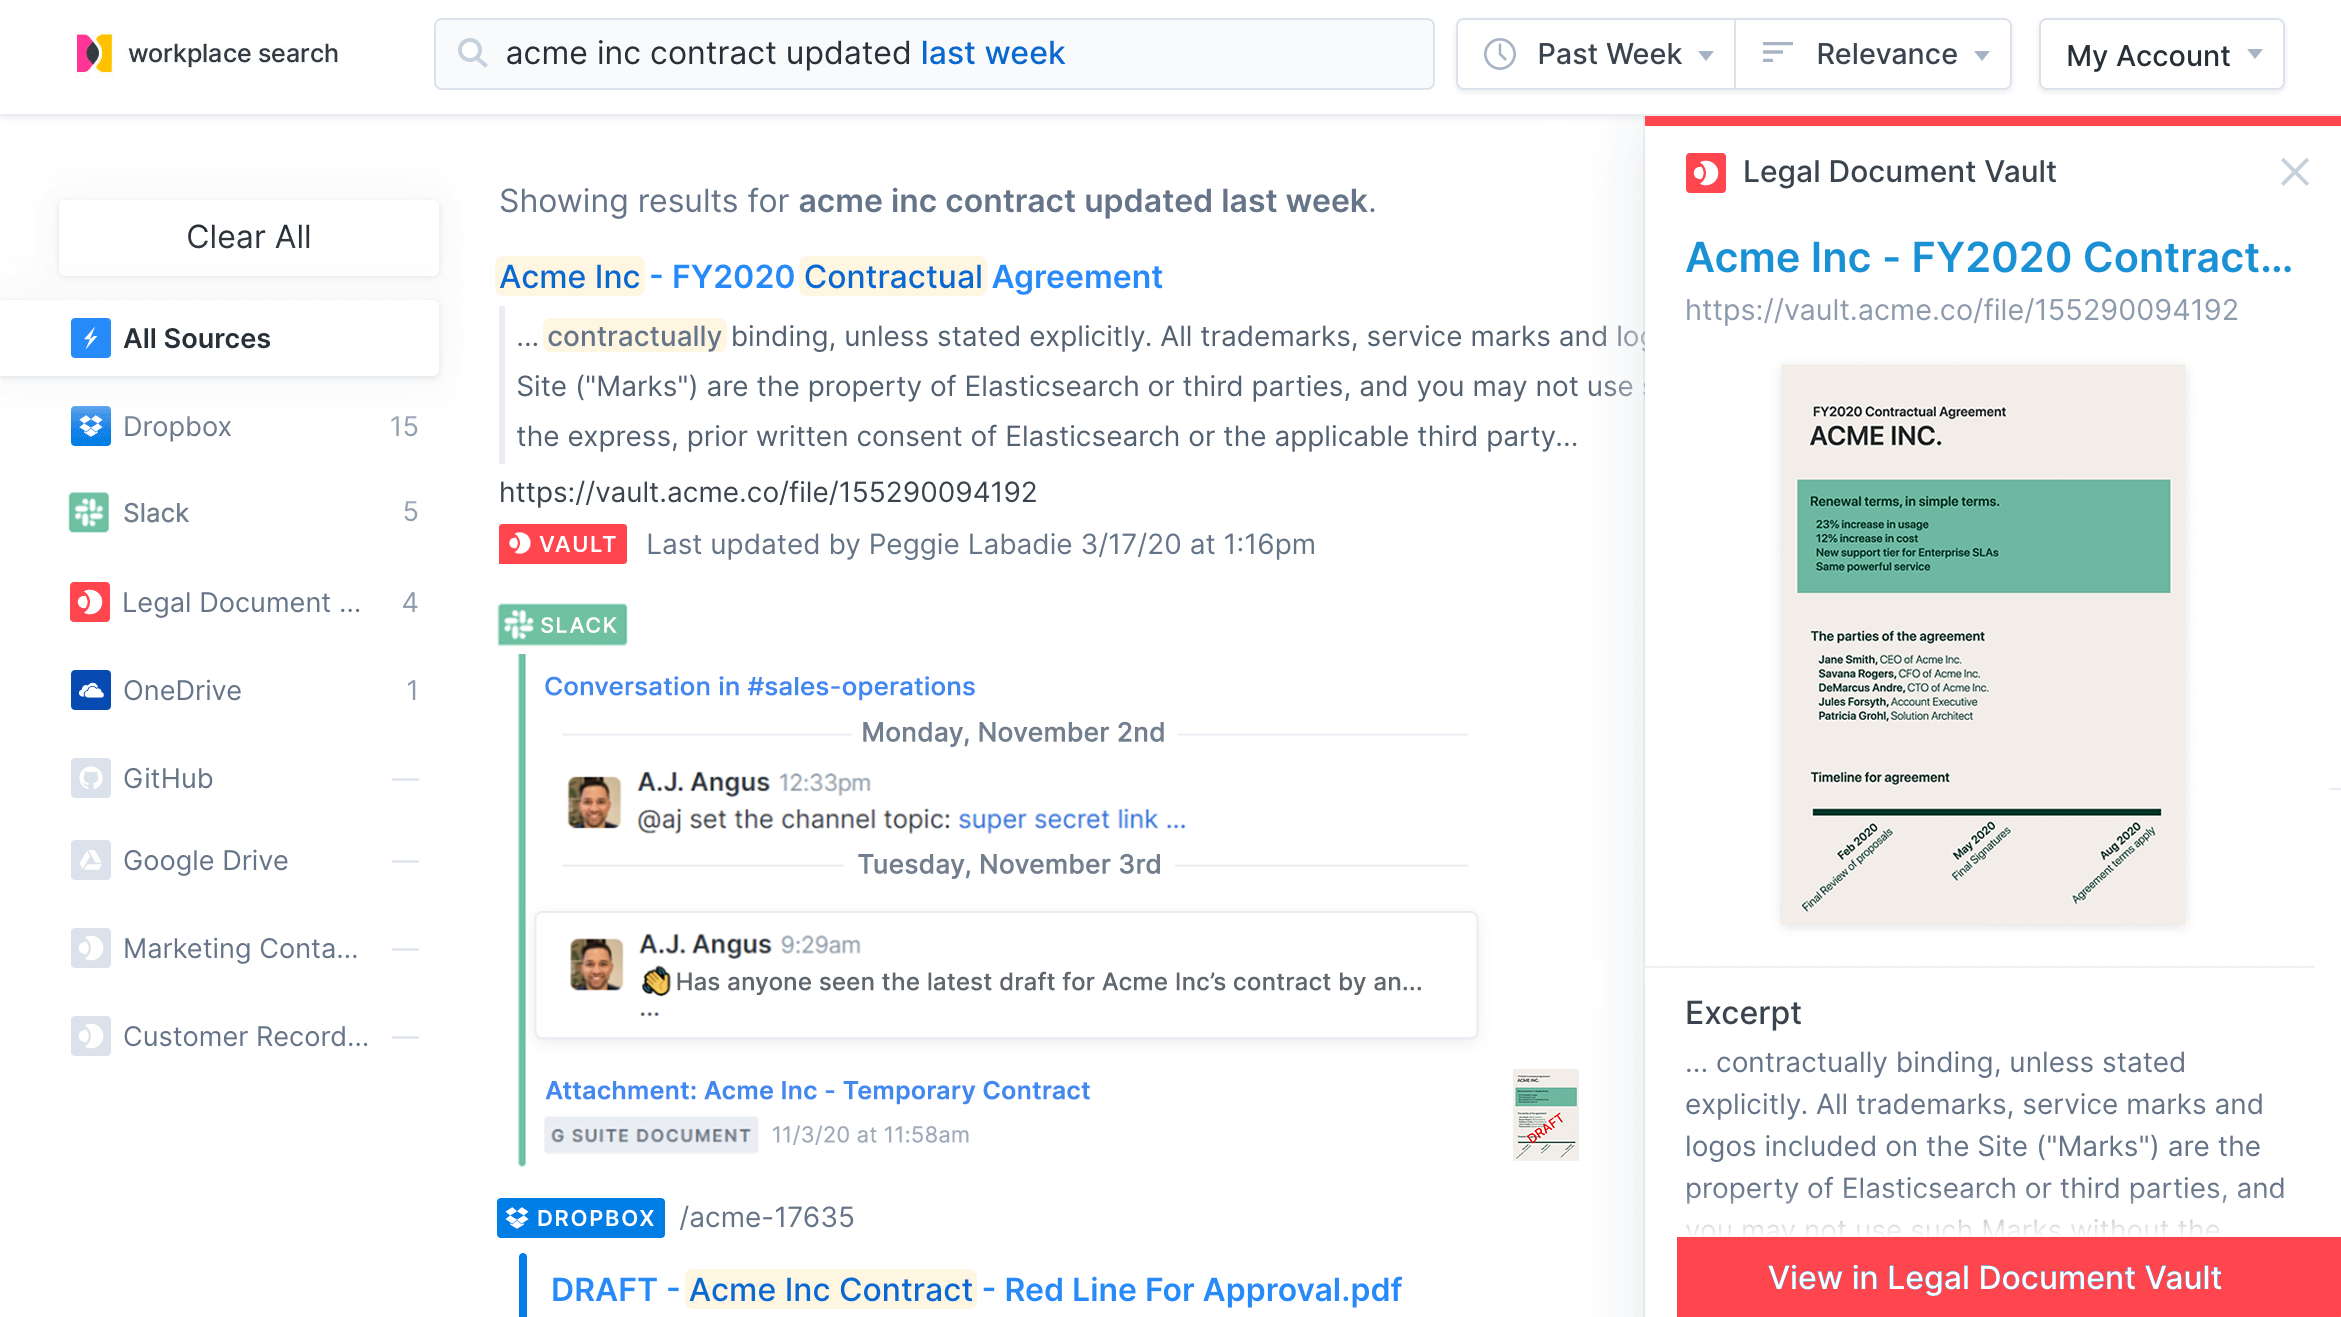
Today’s work happens in Slack. It’s where we share files, connect with remote employees (or the ones sitting six feet away), and collaborate on projects large and small. With 7.10, Workplace Search now supports Slack as a connector so important conversations show up right alongside other work-related content in a single search box with simple, modern search powered by Elastic.
When Workplace Search launched, Salesforce was included as an out-of-the-box connector. In 7.10, Workplace Search now supports Salesforce sandbox environments, giving developers and analysts access to Salesforce content before it’s pushed to production.
Simplify access with single sign-on for Elastic Enterprise Search and Elastic Cloud
Customers love Elastic Cloud for its unique experiences for deploying, operating, and scaling Elastic solutions and products in the cloud. With 7.10, Elastic App Search and Workplace Search users can now sign in to their accounts using their Elastic Cloud credentials. This enhancement applies to the customer and new trial experiences so anyone can quickly access their Elastic Enterprise Search deployments with one less username and password to manage.
Increase controls with document-level security for more Workplace Search connectors
As more content becomes available to search inside your workplace, the need for enhanced document security also increases. In 7.10, Workplace Search includes document-level permission support to manage access to Sharepoint Online, OneDrive, and Microsoft 365 based on an individual or team’s attributes.
Search across all of your application content and historical workplace records without breaking the bank by searching object stores like S3 with searchable snapshots
Enterprise search use cases will also benefit from the new searchable snapshot capabilities launching in the Elastic Stack. Whether you’re supporting additional orders of magnitude of application content or searching across historical organizational records that can be safely stored in object stores like S3, you can store all the archived and historical content in a searchable way without breaking the bank. Stay tuned for more details in future releases.
Get a scoop on all of the new Elastic Enterprise Search features in the Elastic Enterprise Search 7.10 release blog.
Expand observability with user experience monitoring and synthetics, empowering developers to test, measure, and optimize user journeys
Better measure and optimize the digital service quality with user experience monitoring
The success of a business depends on the quality of its digital experiences. We are excited to introduce user experience monitoring — via a new, dedicated User Experience app in Kibana — to help developers and site owners measure, monitor, and understand the performance and quality of their websites as experienced by their end users.
The User Experience app allows you to monitor key user experience metrics, including core Web Vitals. The User Experience app also lets you explore performance by user attributes such as connection type, device type (including variants), operating system, browser, and more. Finally, the app helps you understand who is visiting your website by defined cohorts, so you can make data-driven decisions on which optimization will have the biggest impact.
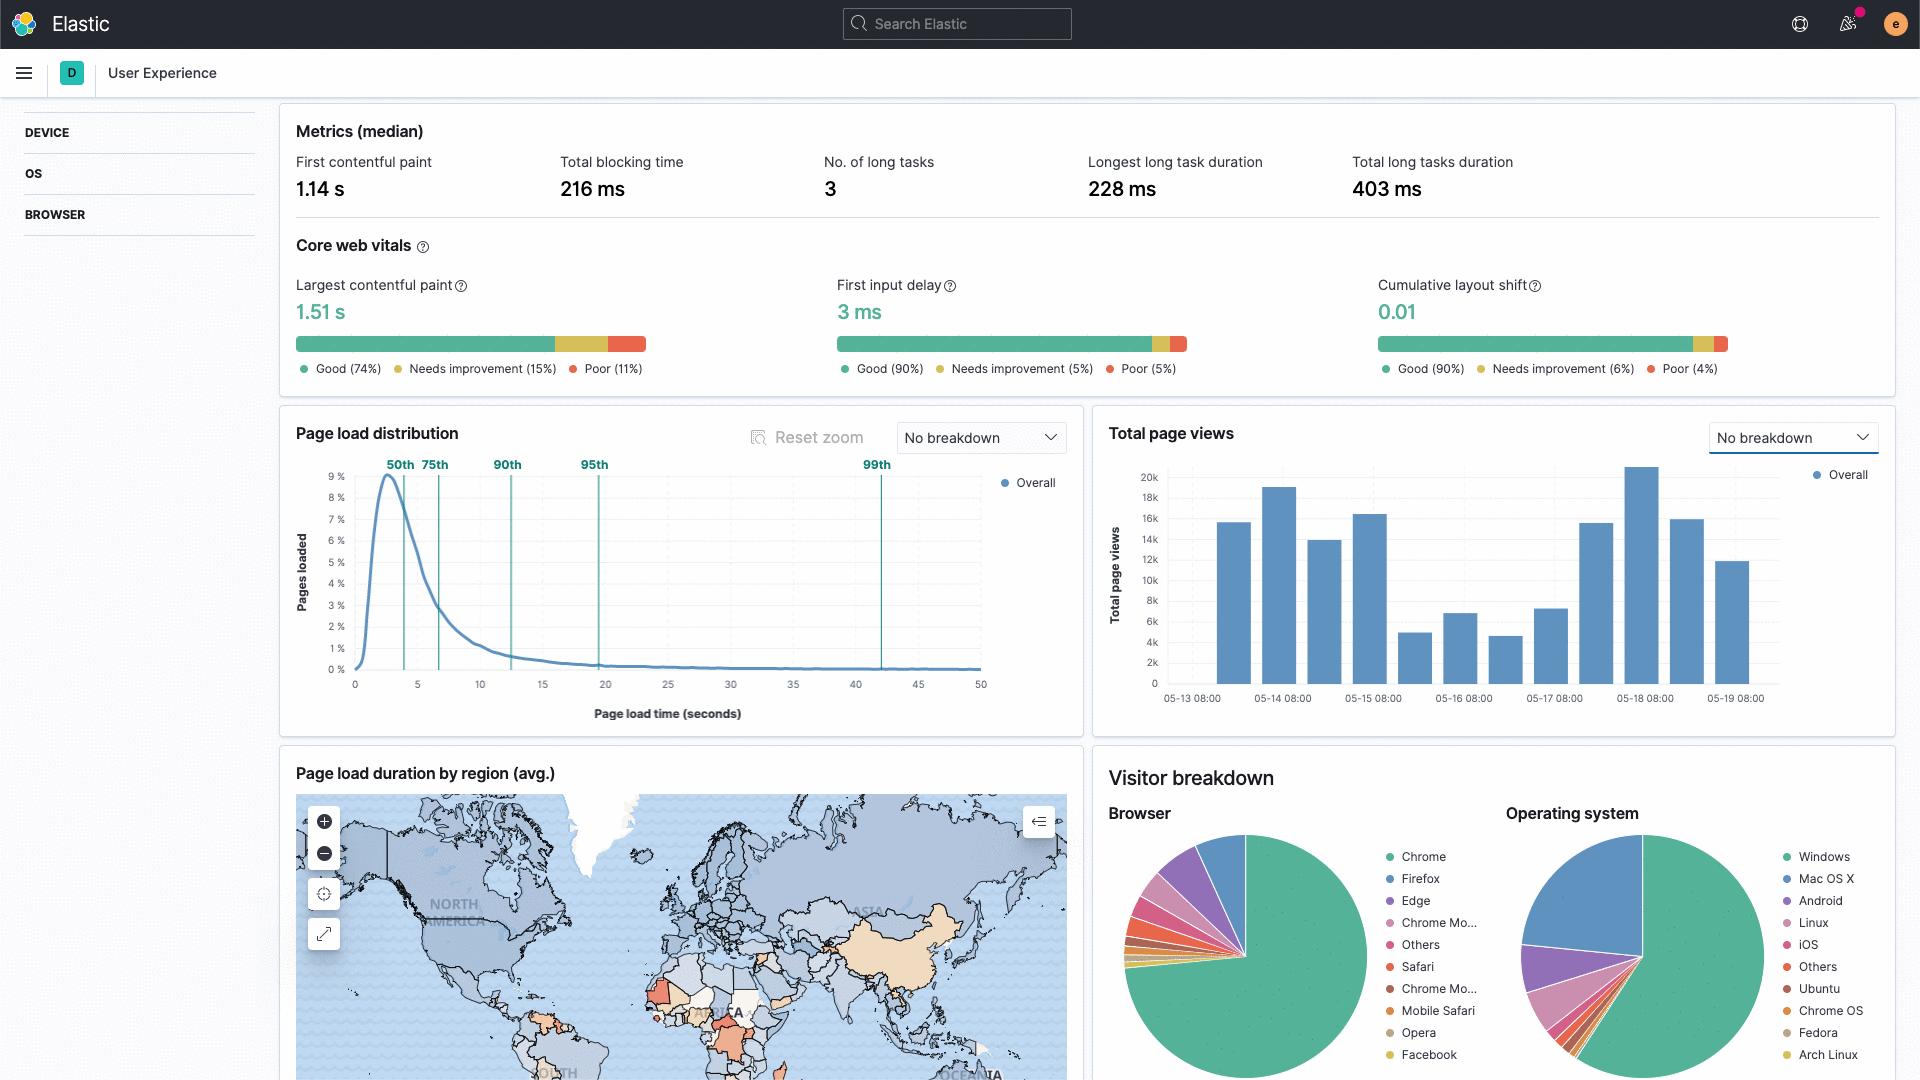
The new User Experience app
Catch issues in critical transaction paths before a user sees them with multi-step journey tests
How can you test and optimize a new interaction path without making real users the test subjects? How do teams generate a clean baseline of performance and functionality? We are excited to introduce multi-step journey checks to Elastic Uptime to help you simulate complex user flows and measure performance. With multi-step journey checks, Elastic Uptime is taking a big leap forward in the synthetic monitoring space to give teams significantly expanded proactive monitoring tools.
Developers can write their test as a scripted journey using principles similar to those they use to write functional tests. Tests can be run locally for a functional test, or pushed to production and used as a synthetic test for live systems. Test results are shown in the Uptime app with a step-by-step breakdown of the code snippets executing, execution status, and a screenshot of the UI when tests are run. Multi-step checks are the first of many exciting Elastic updates to come in the synthetic monitoring space. Stay tuned for more.
Detect common infrastructure issues with zero manual setup with new one-click anomaly detection jobs
Infrastructure is getting more complex. Keeping tabs on the health of thousands of hosts or hundreds of thousands of containers is difficult. Over the last few releases, we have added a series of features that use machine learning to automate or improve common observability workflows. In 7.10, we are building on that theme by introducing out-of-the-box anomaly detection that automatically detects if a host or a Kubernetes pod is experiencing unusual symptoms such as spiking CPU, anomalous outbound traffic, memory leaks, and more.
Anomalies detected by machine learning jobs are also surfaced in the infrastructure map view in the Metrics app, making it easy to spot a troubled container or namespace in a sea of resources. We are introducing a historical timeline into the Metrics app that helps users see the full alert and anomaly timeline across their resource pool, making it easy to spot trends and patterns.
Search years of logs, metrics, and APM traces easily and cost-effectively with searchable snapshots on object stores like S3
So long, rehydration! With the new searchable snapshots capability launching as a beta in the Elastic Stack, you will be able to directly query years of archived data on object stores like S3 — without having to go through the slow and costly process of restoring indices from snapshots before doing a search. With this new capability, you can choose to lower costs while retaining good performance in your search queries and retaining massive amounts of data.
Dive deeper into all the new features in the Elastic Observability 7.10 blog.
Enable security teams to automate the detection and prioritization of complex threats
Lower mean time to detect (MTTD) and reduce alert fatigue with EQL correlation and indicator match rules
With 7.10, security teams can implement threat match rules using EQL (in beta) to compare against threat indicators, and correlation rules based on attack behaviors and techniques. The result? High-fidelity, prioritized alerts for complex threats. Automate multi-stage attack detection, and through correlation with alerts from threat match rules, further prioritize events involving critical assets or high-risk users.
Activate correlation rules and indicator match rules to lower MTTD
Protect your cloud and remote users with prebuilt detections for Azure, Google Cloud, and Zoom
SecOps and DevOps/DevSecOps teams can now gain control over the security posture of their cloud infrastructure environments with newly added Google Cloud and Azure detection rules and machine learning jobs. Additionally, 7.10 provides new Zoom detection rules to help protect remote workers from opportunistic threats pursuing new attack vectors.
Extend visibility across your fast-changing attack surface with new data integrations
Eliminate blind spots with integrations for several common IT and security tools and technologies, including Cisco Umbrella, Juniper SRX, Microsoft 365 Defender, SIP, and Zoom. Plus, integrations for 12 additional sources of security data, including Proofpoint, F5, Snort, CyberArk, Citrix, and Barracuda, are now available experimentally.
Arm threat hunters and analysts with years of high-volume security data sources on object stores like S3, made easily accessible through searchable snapshots
Collect high-volume security-related data, such as IDS, NetFlow, DNS, PCAP, or endpoint data, at greater scale and keep it accessible for longer than previously practical with searchable snapshots and new storage options that reduce costs and preserve searchability. Cold tier options made possible by object stores like Amazon S3 will improve costs, while searchable snapshots enable continued analysis for threat hunting and security analysis.
Get all the details in the Elastic Security 7.10 blog.
Reduce storage costs without compromising performance and visualize data with drag-and-drop ease
Search more data with searchable snapshots and low-cost durable storage like S3 while reducing your storage costs by 50% or more using data tiers
Over time, data tends to grow and expand. The cost of storing that data also grows until customers choose to delete data to save on cost. At Elastic, we see this as a challenge to be solved. We are tackling this by formalizing data tiers, a simple, integrated approach that will give customers complete control over optimizing for cost, performance, and depth of data in order to drive their critical business decisions, enhance revenue, and/or reduce costs.
In 7.10, we are pleased to announce the beta of a critical new Elastic Stack capability, searchable snapshots, that will enable us to deliver data tiers in upcoming releases. Searchable snapshots let customers cost-effectively store and search content even when it is placed into a cold or frozen tier that leverages low-cost object stores like Amazon S3, Azure Storage, or Google Cloud Storage. Searchable snapshots will power a new cold tier, which will deliver up to 50% cost savings over a warm tier, and a future frozen tier, which will deliver search across exclusively low-cost S3-style storage.
Read all about our vision for searchable snapshots in a dedicated post here.
Visualize your data faster with Kibana Lens, now generally available
Eleven months ago we unveiled a new and innovative way to help you rapidly visualize your data with the beta launch of Kibana Lens. With an intuitive drag-and-drop interface that lets you visually investigate your data in Elasticsearch, Lens has been rapidly embraced by the Elastic community as a game-changing visual data analysis tool. We have added a number of new features to Lens, such as treemap visualizations, formatting controls, and even the ability to use multiple indices in the same analysis. We are excited to announce that, with the 7.10 release, Lens is generally available.
We want Elastic users everywhere to know that we are committed to the ongoing journey of making Kibana an incredible visual data analytics experience for everyone — regardless of technical background. By moving Kibana Lens into general availability, we want all of our customers to embrace Lens, even with mission-critical applications like security operations and digital infrastructure monitoring, confident that they will get full SLA-backed production support.

Kibana Lens is generally available in 7.10.
Create a path from data to decisive action with dashboard drilldowns to web apps in Kibana
The goal of every solution that offers data collection and analysis is to help people both find the needle in the haystack and also let them see the big picture that patterns and trends can reveal in aggregated dashboard views. The critical next step is to take action to leverage that insight. This concept of making dashboards actionable has been an ongoing focus for Kibana, and in 7.10 we are excited to roll out the ability to create navigation paths to web apps using URLs that can even include data parameters.
What if a security analyst could, in a single click, be presented with a dropdown offering multiple paths to various web apps to take different actions? Maybe they can drop directly into a security gateway solution with critical parameters passed in. Maybe more investigation is warranted and the next best step is to create a new ticket in ServiceNow. URL drilldowns unlock unlimited paths for making Kibana dashboards actionable.
Read about these features and more in the Kibana 7.10 blog and the Elasticsearch 7.10 blog.
Onboard to Elastic Cloud quickly, save money, and deploy in more places
Optimize for your use case using new solution-specific deployments, audit access to your data using audit logs, and upgrade more easily
Changes to the “create deployment” workflow in the Elastic Cloud console make it easier for you to select and provision deployments that are optimized for your use case. After selecting a solution, Elastic Cloud provisions infrastructure resources (storage, compute, and RAM) that are optimized for that solution’s deployment. Users can always further customize their configurations for special use cases.
Customers will also benefit from enhancements to the ongoing management of their environments. By allowing users to send their deployment logs and metrics to a separate, dedicated Elastic Cloud deployment, Elastic Cloud lets users audit access to their deployments, identify and alert on system health issues, or troubleshoot and resolve slow search queries within their own deployments, all using Elastic Observability capabilities.
Lastly, customers can now take advantage of simplified one-click upgrades when moving to a new version, upgrading all Elastic Stack components together.
Coming soon: Double your storage density or save up to 50% on cost with the new cold tier on Elastic Cloud, powered by searchable snapshots and object stores like S3
Elastic Cloud has long allowed customers to store deployment snapshots in object stores like Amazon S3. With the new managed cold tier, which relies on searchable snapshots, customers will be able to save up to 50% on their data storage costs by relying on the same periodic snapshots they are already taking rather than live replicas to ensure data durability. This new capability will be launching soon.
Data tiers unlock new opportunities for customers who want to balance data analysis with storage costs. Some customers will be able to analyze more data with the same budget. Other customers may continue to analyze the same amount of data and benefit from lower costs.
Deploy Elastic your way with three new additional regions and new Red Hat OpenShift operator certification for Elastic Cloud on Kubernetes
Now Elastic users can run their deployments in more than 40 Elastic Cloud regions. These regions span across AWS, Google Cloud, and Microsoft Azure. Since our 7.9 release in August, we have added support for three new regions, including AWS Mumbai and Azure Iowa and New South Wales. Visit our regions page to see all of our supported regions.
Good news for Elastic and Red Hat customers: we are pleased to announce that Elastic Cloud on Kubernetes will soon be a Red Hat OpenShift-Certified Operator.
To get caught up on all of the Elastic Cloud news, check out the What’s New In Elastic Cloud blog.
There’s always more...
So much more. Check out the individual solution and product blog posts for the details on everything we added in 7.10:
Elastic Solutions
Elastic Enterprise Search 7.10.0 released
Elastic Observability 7.10.0 released
Elastic Security 7.10.0 released