What's new in Elastic Observability 7.10: User experience monitoring and synthetics
We are pleased to announce version 7.10 of Elastic Observability, introducing exciting new capabilities that bring deeper visibility into the most important layer of digital monitoring — the experience of the end user. User experience monitoring — accessed via a brand new app in Kibana — provides real-time visibility into website performance, and multistep journey checks in Uptime significantly expand synthetic monitoring capabilities to help operational teams proactively catch issues by monitoring simulated journeys. Plus, several new features like searchable snapshots, out-of-the-box anomaly detection jobs for infrastructure monitoring, and a PHP agent for Elastic APM help the Elastic Observability community optimize costs while deepening visibility across operations.
Experience the latest version of Elastic Observability on our Elasticsearch Service on Elastic Cloud (a free 14-day trial is available) or install the latest version of the Elastic Stack for a self-managed experience.
And now, without further ado, here are the big hitters in this release.
User experience monitoring: Measure, track, and optimize your website for the end user
The success of a business depends on the quality of its digital experiences. Slow load times on a website degrade the user experience and can have a direct impact on your bottom line. We are excited to introduce user experience monitoring — via a new, dedicated User Experience app in Kibana — to help developers and site owners measure, monitor, and understand the performance and quality of their websites as experienced by their end users.
The information displayed in the User Experience app is based on the frontend performance data collected by the Elastic RUM agent. If you already have applications instrumented using the RUM agent, all you have to do is upgrade to 7.10 to start investigating the user experience in those applications.
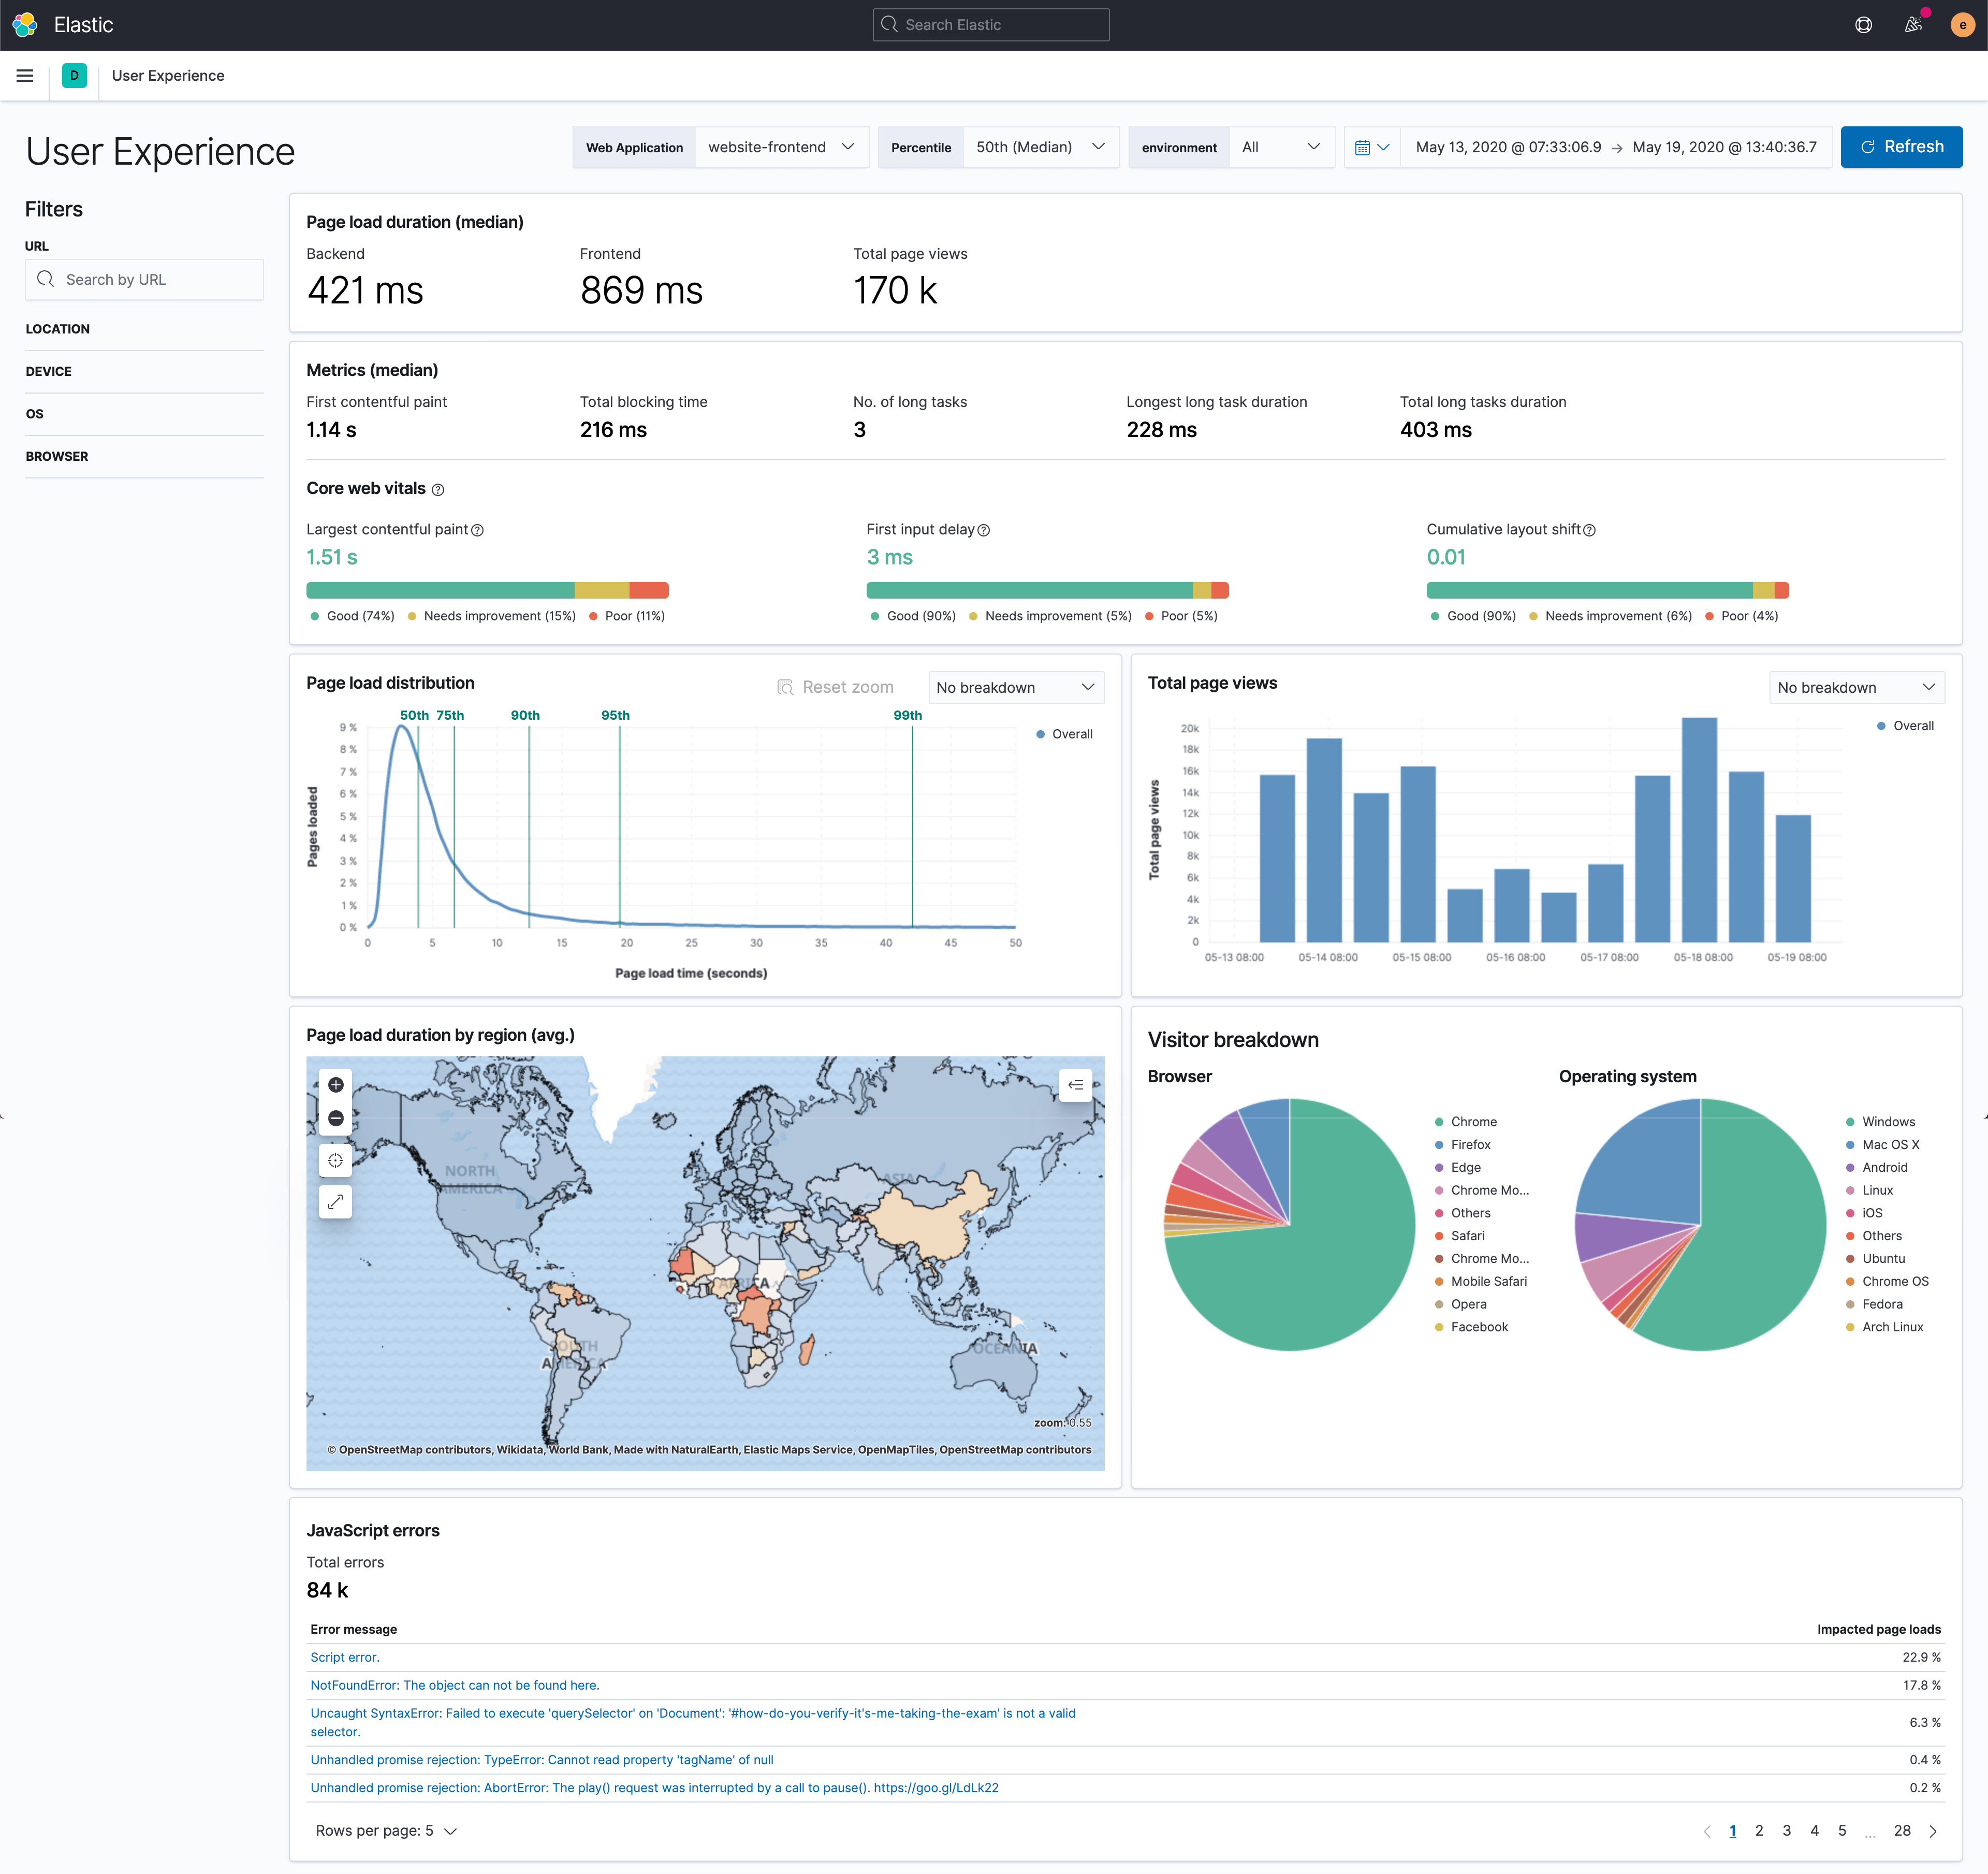
The User Experience app helps developers do the following:
- Monitor key user experience metrics, including Core Web Vitals: User Experience surfaces a curated set of well-known performance metrics that developers typically use to understand and optimize website performance. An important set of metrics in this view are Core Web Vitals — an emerging set of experience quality metrics from Google that are designed to help developers interpret experience and quality without having to be web performance experts. Starting in May 2021, Core Web Vitals will be an input signal into Google’s page ranking algorithms — which means making sure that Core Web Vitals are healthy will be even more critical to online success.
- Explore performance by user attributes: Client-side factors like connection type, device make/model (including variants), operating system (OS), and browser, all have a significant impact on how your code performs on the user’s browser or device, and thus the user experience. The User Experience app includes controls to help you explore the various performance metrics by these various cohorts. For example, see how a page is performing for mobile Safari on iOS as compared to Android devices.
- Understand who is visiting your website: Break down experience by various client-side attributes like OS, location, and browser types. Combine the performance metrics by cohort along with the relative size of the various cohorts to prioritize performance optimizations that will have the biggest impact.
To learn more about this exciting feature, head over to the deep dive blog. Ready to try it out? Get up and running in no time with the User Experience Monitoring Quick Start.
Multistep synthetic tests: Catch issues before a user sees them
User experience is a powerful way to monitor the web performance experienced by real users. But what if you are still in pre-production and don’t have users yet? How can you test and optimize a new interaction path without testing it on real users? Since real user data is noisy with various client-side factors impacting performance, how do teams generate a clean baseline of performance and functionality? We are excited to introduce multistep journey checks to Elastic Uptime to help developers simulate complex user flows (for example, filling a basket and completing a transaction) and measure performance. With multistep journey checks, Elastic Uptime is taking a big leap forward in the synthetic monitoring space to give teams significantly expanded proactive monitoring tools.
Developers can write their tests as scripted journeys using principles similar to those they use to write functional tests. The test can be run to debug locally using familiar browser-based dev tools. The same scripted journey can then be promoted as a synthetic test to monitor the live production system. Not only does this help reduce duplication, but it also helps keep synthetic tests in sync with code changes. The latter alignment also helps ensure the on-call engineers are not alerted in the middle of the night because of false positives from a broken test. Test results are shown in the Uptime app with a step-by-step breakdown of the code snippets executed, execution status, and the screenshot of the UI when tests are run.
Synthetic monitoring is a great complement to user experience monitoring. The former allows you to simulate the user experience for various scenarios and proactively catch issues before a user encounters them, and the latter allows you to understand the experience of real users. Multistep checks are the first of many exciting Elastic updates to come in the synthetic monitoring space. Stay tuned for more.
To learn more about this exciting feature, head over to the deep dive blog.
One-click anomaly detection: Detect common infrastructure issues with zero effort
Infrastructure is constantly getting more complex. Keeping tabs on the health of thousands of hosts or even hundreds of thousands of containers is a hard task. Alert fatigue is common. Over the last few releases, we have had a continuous drip of features (such as log categorization) that use machine learning to automate common observability workflows to help tame this growing complexity. In 7.10, we are building on that theme by introducing turnkey anomaly detection jobs that automatically detect if a host or a Kubernetes pod is experiencing unusual symptoms (for example, spiking CPU, anomalous outbound traffic, memory leaks, etc.). The goal is to help infrastructure ops teams monitor their massive fleet of resources, and spot failing resources, with minimal manual effort. Enabling anomaly detection and seeing value is a click away.
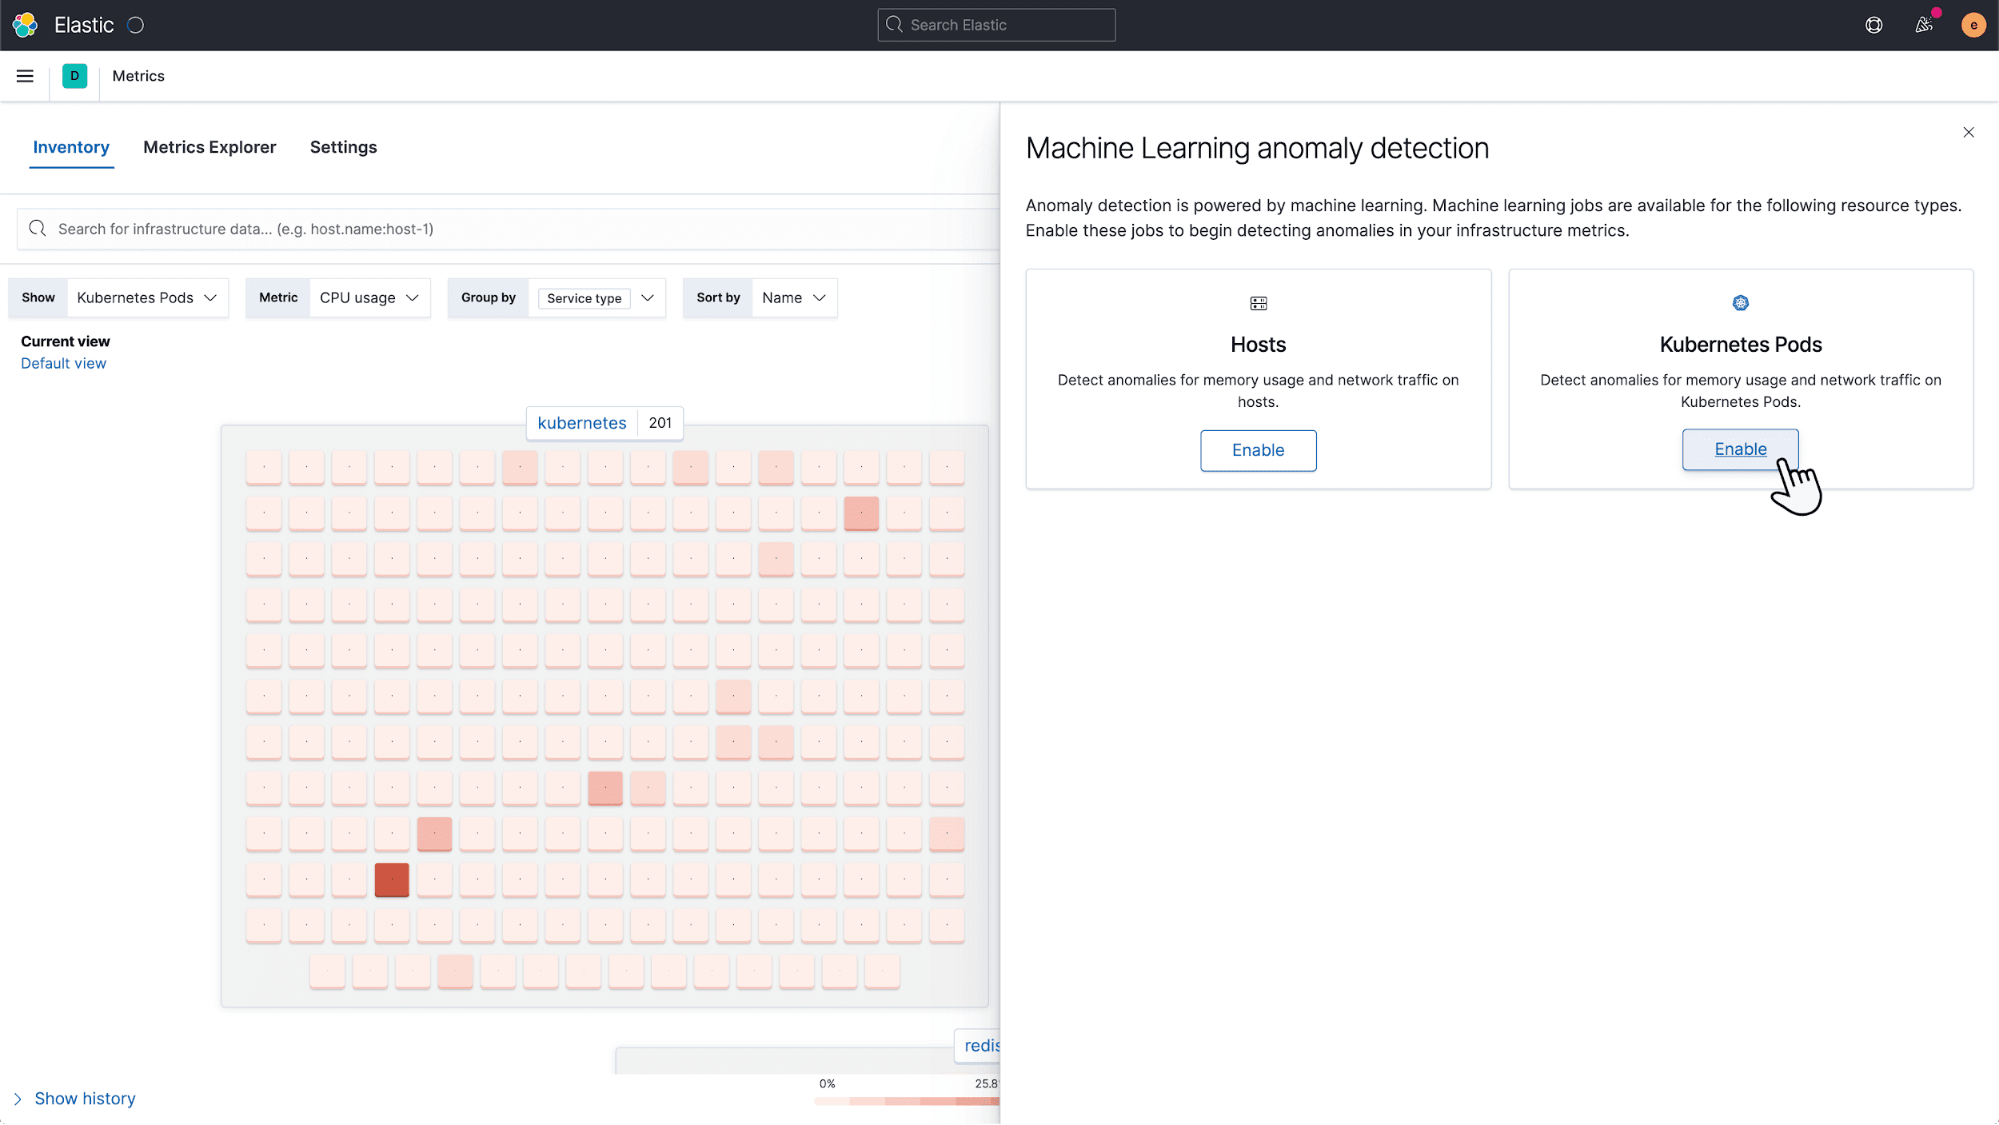
Anomalies detected by the machine learning jobs are surfaced in the infrastructure map view in the Metrics app, making it easy to spot a troubled container or namespace in a sea of resources. Operators want to see when resources are behaving unusually vs. when a metric is just high or low on an absolute scale. For example, CPU suddenly spiking to 50% may be a more worrisome signal than max CPU pegged at 85%.
We are also introducing a historical timeline element into the Metrics app that helps users see the full alert and anomaly timeline across their resource pool, making it easy to spot temporal trends and patterns. Users can use the timeline to scrub back to a point in time to explore the state of their infrastructure when a past incident occurred, which is often a key step in incident investigation.
Learn more about this and other exciting monitoring features in the release highlights.
Elastic APM adds a PHP agent, bringing free and open APM to the massive PHP community
PHP has been, and continues to be, a very popular language for web design and development, with approximately 80% of dynamic websites using it as their server-side language. We are excited to introduce a PHP agent (beta in 7.10) to Elastic APM, bringing free and open APM solutions to millions of PHP developers globally. With the addition of PHP, Elastic APM now supports all major application development languages, including Java, .NET, Go, Python, Ruby, and JavaScript. Polyglot programming is becoming increasingly common in microservices architectures, with developers choosing the best language for the service. Now, Elastic APM can help enterprises monitor any polyglot environments that use PHP, and get end-to-end visibility into the performance of their apps.
Learn more about this and other new APM features in the release highlights.
Searchable snapshots: Search years of logs, metrics, and traces cost-effectively and easily on object stores like S3
When it comes to telemetry data — logs, metrics, traces, etc. — not all data is treated equally. Data tiering is a common operations strategy used to manage the trade-off between performance and cost, whereby your most accessed data with the highest performance needs is stored on expensive hardware for speedy access, and data is moved to cheaper, slower hardware as those requirements fade. The least accessed data is often archived on object stores like S3, which are very cost-effective, but not searchable. Until now. Say hello to searchable snapshots!
Launching as a beta in Elasticsearch 7.10, searchable snapshots allow users to directly search and analyze data on object stores like S3 without having to go through the slow and cumbersome process of rehydrating the data to make it searchable. Searchable snapshots power the cold tier, also new in 7.10, which can reduce storage costs by up to 50% without significantly impacting query performance.
Time-based tiering (e.g., migrating and storing older logs on cold tiers for compliance reasons) will be the most common use case for this feature in observability. However, data tiering can be done on any dimension. For example, you could use cold tiers for application traces from your tier 3 services that don’t have the same SLA requirements.
Searchable snapshots and data tiers are a game-changing innovation that will allow Elastic users to do more with less — without increasing operational complexity, changing investigative workflows, or hindering access to data. So long, rehydration!
But wait — there’s more
- Elastic APM adds several new features, including a brand new services overview page, micrometer integration, automated alerts on performance anomalies by machine learning, and the ability to collapse long traces for better navigation. Also, service maps are now generally available.
- Google Cloud Billing integration allows you to ingest and visualize billing metrics from Google Cloud operations, providing visibility into cloud spend. Users can combine data collected by this integration with that collected by existing Azure and AWS Billing integrations for unified spend management in multi-cloud environments.
Go deeper to learn about all of these new capabilities and more in the release highlights.
Better still, start taking advantage of these great new capabilities by upgrading your deployment to 7.10, grabbing a free 14-day trial of Elasticsearch Service, or installing the latest version of the Elastic Stack.