Introducing user experience monitoring view and synthetic user journeys
We are pleased to announce the release of several new capabilities that will change how you monitor and understand frontend user experience within Elastic Observability in the 7.10.0 release — on the Elasticsearch Service, or when you download the Elastic Stack.
Ready to dive right in? Follow the User Experience Monitoring Quick Start to get up and running in just a few steps.
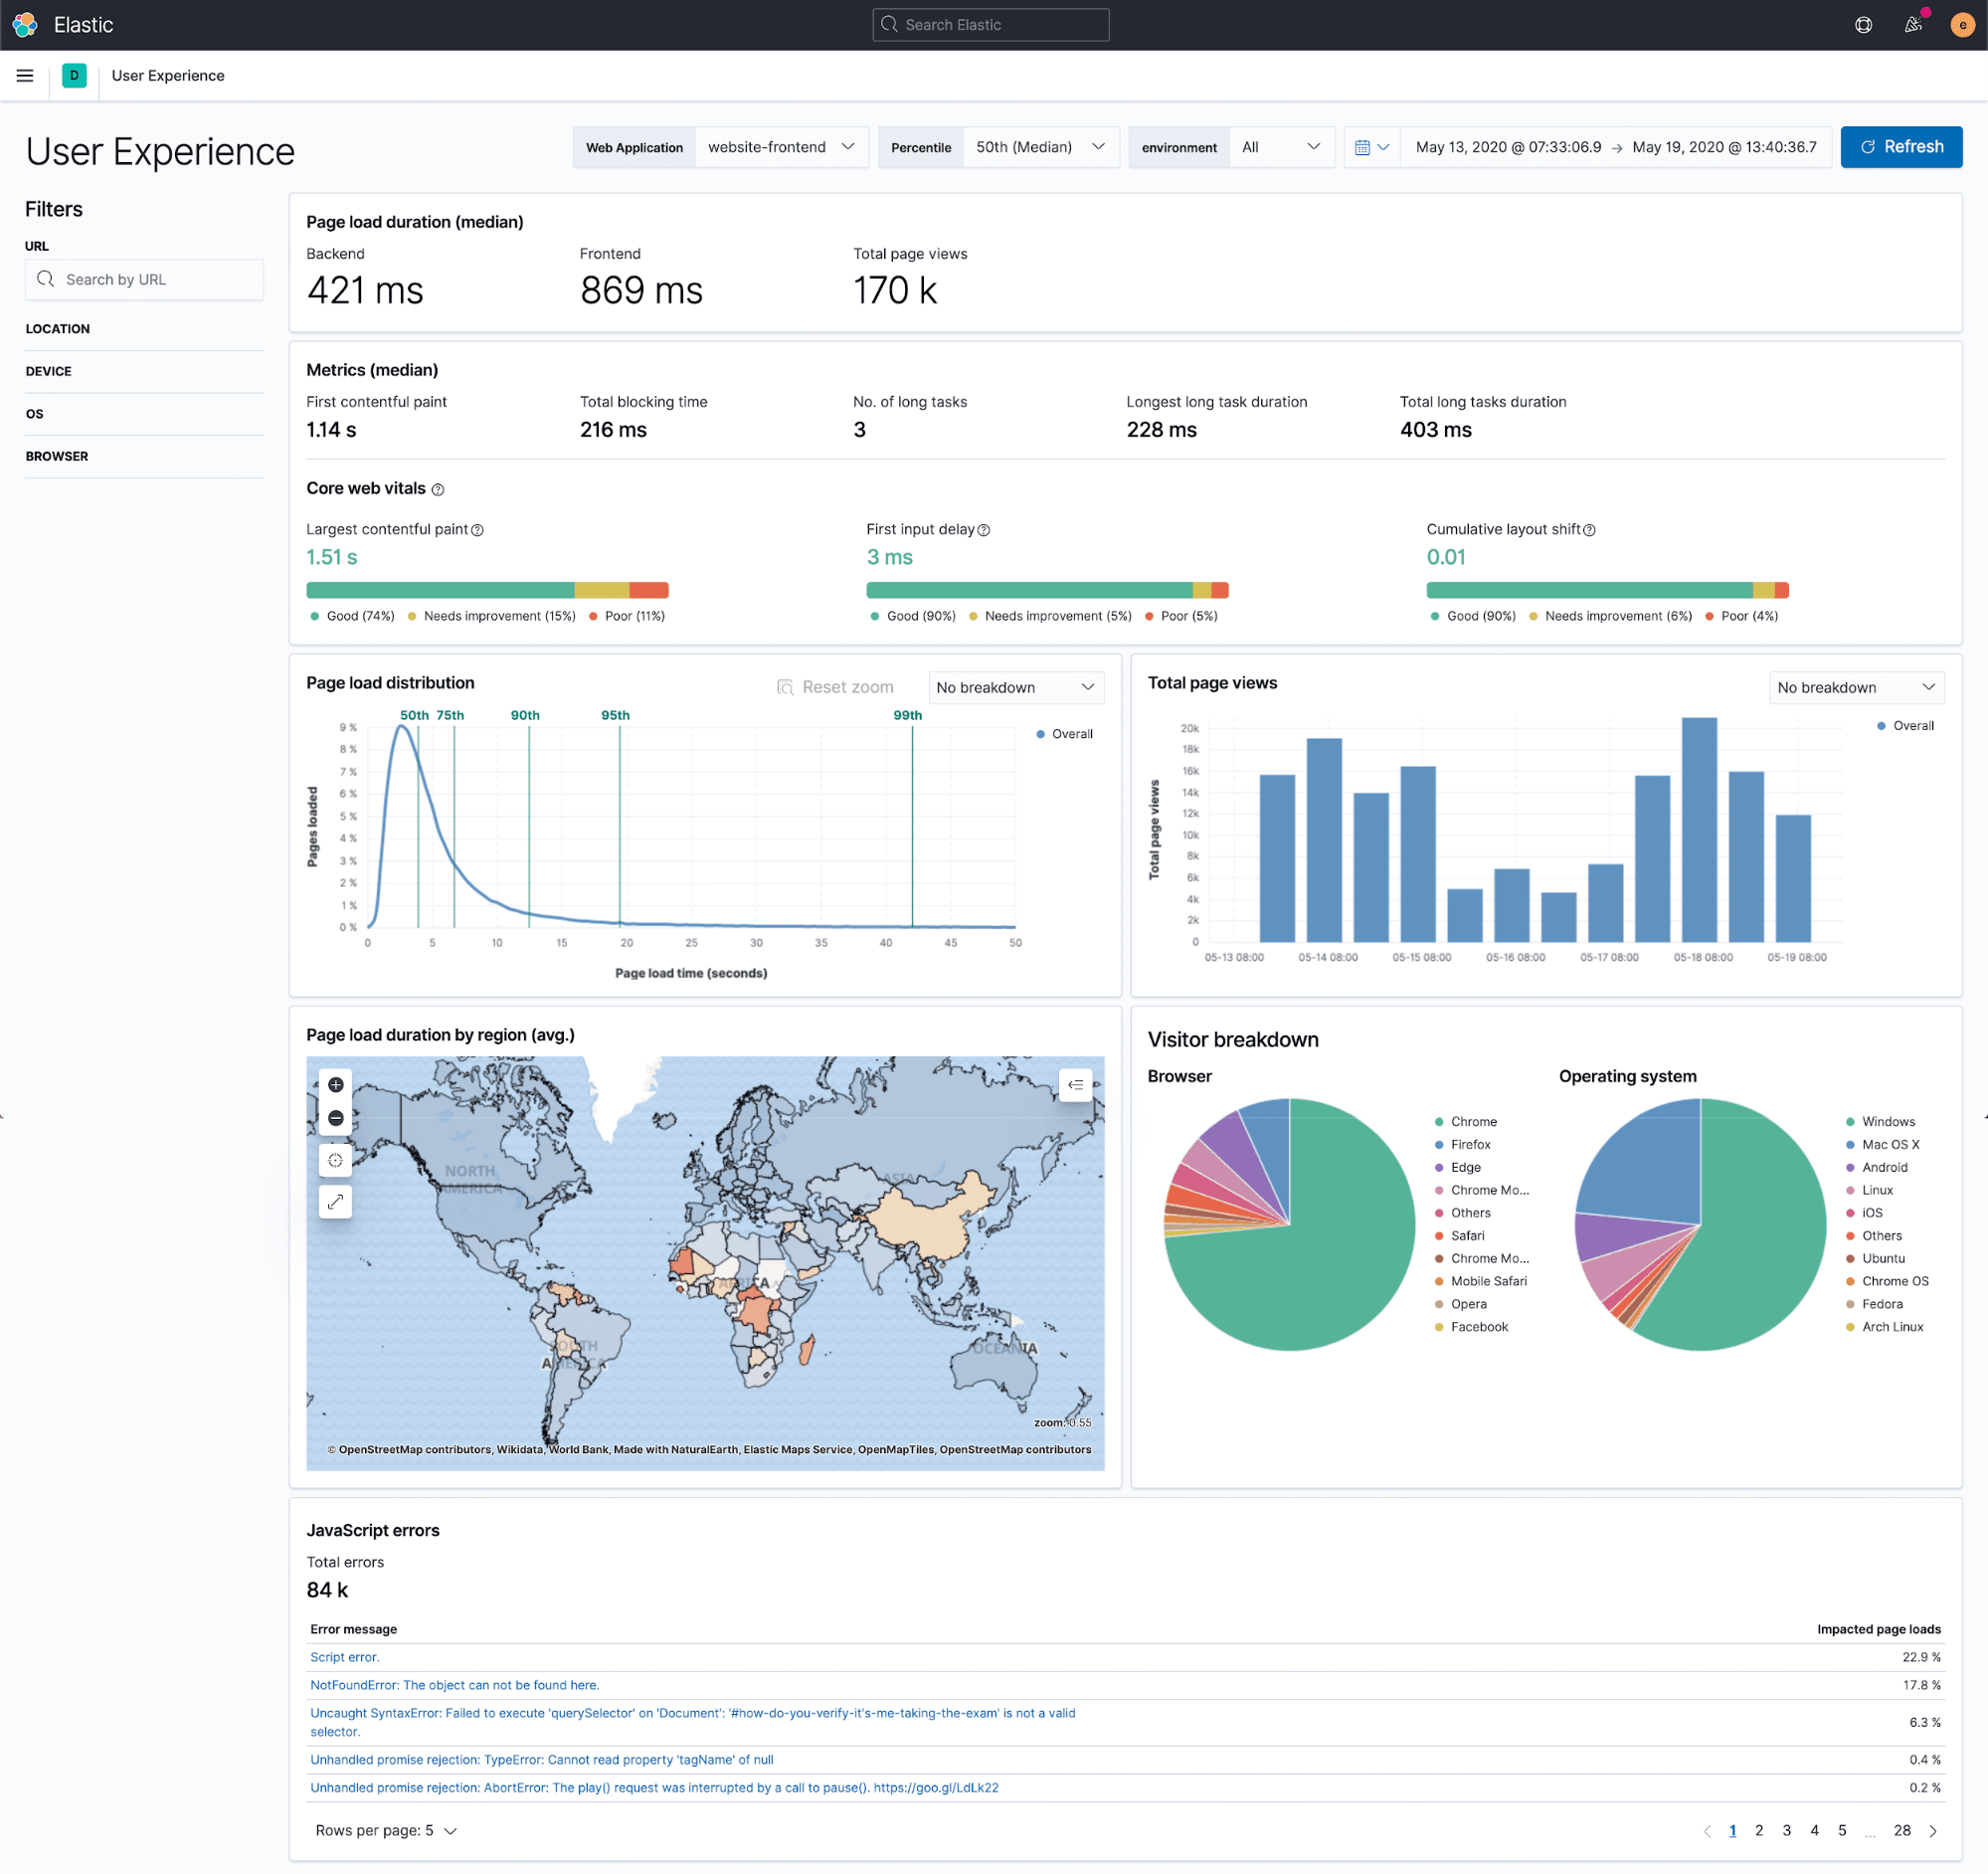
The first new capability coming to Elastic Observability in 7.10 is user experience monitoring. Understanding the experience of visitors on a website and their behavior is critical to having a complete understanding of how a website is operating — and we want to help you measure the distribution of experiences your visitors are having on different devices and browsers and in different locations.
In the new User Experience app, we are very excited to feature Google’s Core Web Vitals, which support the increasing importance search engines are placing on user experience when organically ranking websites. Core Web Vitals are based on metrics that score three key areas of user experience: loading performance, visual stability, and interactivity. This is becoming increasingly more important as Core Web Vitals are set to become the main performance measurement in Google’s ranking factors, beginning in May 2021. If your site performance is bad, you will be down ranked! Also, if you’re a content-based site that wants to appear in the “Top Stories” section of Google’s search results, you want to have good Core Web Vitals results. In this case, time (speed) really does equal money!
We also enable exploration of your user experience data with filters and breakdowns on the charts that enable you to identify performance outliers in your visitor population and drill down into specific user cohorts. We also have a powerful URL filter that will enable you to view performance for common sections of your website (like all product pages or search result pages) without complicated queries or RegEx patterns.
The best part is that we’ve only just gotten started. We have a range of incredible features planned for upcoming releases to help our users understand what impact performance is having on user behavior, with quantifiable business outcomes, proactive optimization targets, and reactive anomaly detection across every visitor cohort across your websites.
In addition to user experience monitoring, we are also shipping our first experimental real browser-based synthetic website monitoring agent in 7.10. This will enable users of our synthetic monitoring tool, Elastic Uptime, to check the availability and functionality of key user journeys through their websites, alongside the current lightweight ICMP (ping), TCP, and HTTP monitors.
Users will be able to script multistep journeys through a webpage using plain JavaScript in Playwright, run and debug locally, and even have your preproduction synthetic tests be promoted to production alongside your code.
Just like user experience monitoring, real browser-based synthetic monitoring is only getting started here at Elastic. We have a very exciting roadmap and can’t wait to share more of it with you. To be in the know, visit synthetic monitoring page to sign up for updates.
Want to see it in action?
You can access the latest version of Elastic Uptime and the new User Experience app on Elasticsearch Service on Elastic Cloud by creating a new cluster or upgrading an existing cluster the day of release, or you can download the Elastic Stack, grab the synthetics Docker image, and get started improving your users' experiences today.
Accelerate your learning with this tutorial: User Experience Monitoring Quick Start.