Monitoring Kubernetes the Elastic way using Filebeat and Metricbeat
In my previous blog post, I demonstrated how to use Prometheus and Fluentd with the Elastic Stack to monitor your Kubernetes ecosystem. That’s a good option if you’re already using those open source-based monitoring tools in your organization. But, if you’re new to Kubernetes monitoring, or want to take full advantage of Elastic Observability, there is an easier and more comprehensive way. In this blog, we will explore how to monitor Kubernetes the Elastic way: using Filebeat and Metricbeat.
Using Filebeat and Metricbeat
Beats, as you know, is a free and open platform dedicated to data shipping. Using Beats, you can transfer data from hundreds or thousands of machines to Logstash or Elasticsearch.
Filebeat, which is known as a lightweight log shipper, also supports containerized architecture. Filebeat can be deployed on Docker, Kubernetes, and cloud environments, collecting all log streams, as well as fetching metadata such as containers, pods, nodes, virtual environments, and hosts and automatically correlates them to corresponding log events. Metricbeat is a lightweight metric shipper which, like Filebeat, also supports containerized environments. In a Kubernetes environment, containers are dynamically deployed as pods on available worker nodes. This "dynamic" is the key, and Filebeat and Metricbeat have a handy feature called Autodiscover. When you run applications in containers, they become moving targets for monitoring systems. Kubernetes Autodiscover Providers of Filebeat and Metricbeat monitor the start, update, and stop of Kubernetes nodes, pods, and services. When Filebeat or Metricbeat detects these events, they make the appropriate metadata available for each event. Also, depending on annotations of the launched Kubernetes pods, they apply the appropriate settings to the target logs and metrics. Hint-based Autodiscover is explained in detail in our previous blog post on Docker and Kubernetes Hints-Based Autodiscover with Beats.
Monitoring architecture
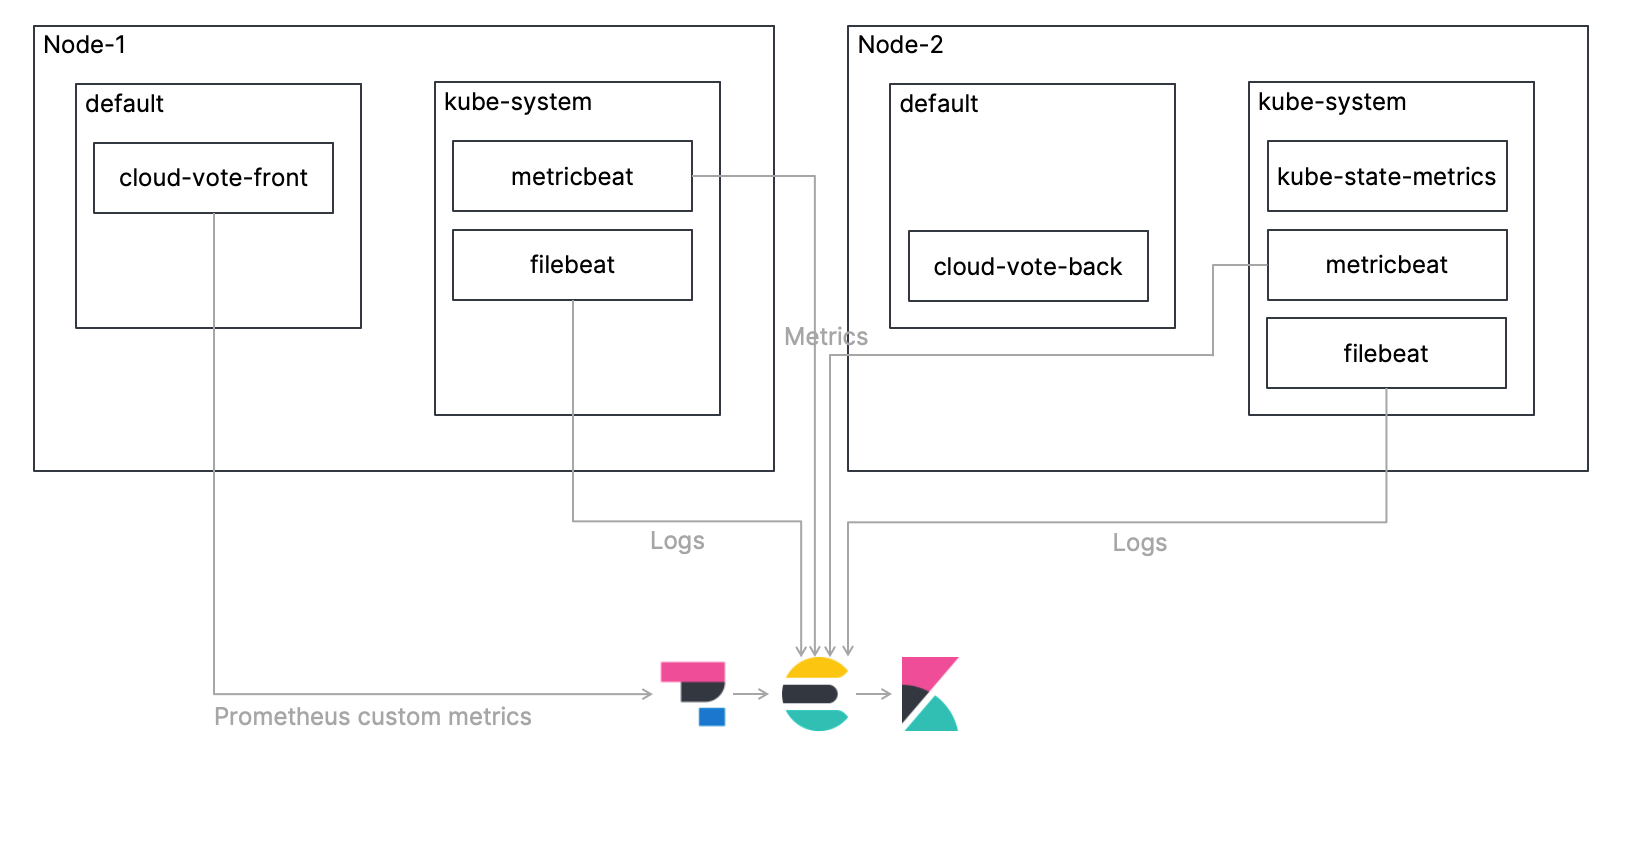
As in the previous blog, we will deploy a simple, multi-container application called Cloud-Voting-App on a Kubernetes cluster and monitor the Kubernetes environment including that application. This time, I will explain the procedure to collect logs using Filebeat, collect metrics using Metricbeat, ingest them directly to Elasticsearch, and monitor them using Kibana. I will also cover how to get Prometheus custom metrics using Elastic APM. The overview architecture is shown in the figure below. Also, the code for this tutorial is available in my GitHub repo, so please refer to that for the complete procedure.
Let's take a look at each step!
Deploying Filebeat as a DaemonSet
Only one instance of Filebeat should be deployed per Kubernetes node. The manifest for the DaemonSet is already defined in the file elastic/filebeat-kubernetes.yaml, but let's take a look at the relevant settings.
First, use the Kubernetes Autodiscover Provider to configure the application pod annotation settings to handle logs. As you can see, the Autodiscover settings are defined in the filebeat.autodiscover section. I enabled the hints and set the default path for the container logs. Please refer to the Filebeat documentation for more information on configuring Autodiscover for Filebeat.
...
    # To enable hints based autodiscover, remove `filebeat.inputs` configuration and uncomment this:
    filebeat.autodiscover:
      providers:
        - type: kubernetes
          node: ${NODE_NAME}
          hints.enabled: true
          hints.default_config:
            type: container
            paths:
              - /var/log/containers/*${data.kubernetes.container.id}.log
...
Other than above, all you have to do basically is add the URL and credentials for your Elasticsearch cluster.
...
     containers:
      - name: filebeat
        image: docker.elastic.co/beats/filebeat:7.13.0
        args: [
          "-c", "/etc/filebeat.yml",
          "-e",
        ]
        env:
        - name: ELASTICSEARCH_HOST
          value: elasticsearch
        - name: ELASTICSEARCH_PORT
          value: "9200"
        - name: ELASTICSEARCH_USERNAME
          value: elastic
        - name: ELASTICSEARCH_PASSWORD
          value: changeme
        - name: ELASTIC_CLOUD_ID
          value:
        - name: ELASTIC_CLOUD_AUTH
          value:
...
Deploying kube-state-metrics
kube-state-metrics is a Kubernetes add-on that monitors the objects stored in Kubernetes. kube-state-metrics is focused on identifying the condition of the Kubernetes objects deployed to a Kubernetes cluster. For example, at a given point in time, how many pods are deployed to the cluster, what are the allottable CPU cores in the cluster, how many jobs failed, and so on. kube-state-metrics is not deployed to Kubernetes clusters by default, so you will need to deploy it by yourself. A sample manifest of kube-state-metrics is placed under examples/standard for your reference. Please refer to this GitHub repo for more information on kube-state-metrics.
Deploying Metricbeat as a DaemonSet
Only one instance of Metricbeat should be deployed per Kubernetes node, similar to Filebeat. The manifest for the DaemonSet is already defined in the file elastic/metricbeat-kubernetes.yaml, but it's a bit trickier than Filebeat. Let's take a look at the key settings.
Settings for Autodiscover are defined in the metricbeat.autodiscover section. The first - type: kubernetes setting is for the entire Kubernetes cluster. Here, we use Metricbeat's Kubernetes module to configure metrics for the entire Kubernetes cluster. The first - module: kubernetes configuration sets up the metrics we get from the kube-state-metrics mentioned above. The second - module: kubernetes configuration is a configuration for monitoring the Kubernetes API server (kube-apiserver), which is the core of the Kubernetes control plane that exposes Kubernetes API. Please refer to the Metricbeat documentation for more information on Metricbeat's Kubernetes module.
metricbeat.autodiscover:
  providers:
    - type: kubernetes
      scope: cluster
      node: ${NODE_NAME}
      unique: true
      templates:
        - config:
            - module: kubernetes
              hosts: ["kube-state-metrics:8080"]
              period: 10s
              add_metadata: true
              metricsets:
                - state_node
                - state_deployment
                - state_daemonset
                - state_replicaset
                - state_pod
                - state_container
                - state_cronjob
                - state_resourcequota
                - state_statefulset
                - state_service
            - module: kubernetes
              metricsets:
                - apiserver
              hosts: ["https://${KUBERNETES_SERVICE_HOST}:${KUBERNETES_SERVICE_PORT}"]
              bearer_token_file: /var/run/secrets/kubernetes.io/serviceaccount/token
              ssl.certificate_authorities:
                - /var/run/secrets/kubernetes.io/serviceaccount/ca.crt
              period: 30s
In addition, hints are defined to leverage the Kubernetes Autodiscover Provider to enable processing of the metrics using application pod annotation settings. Please refer to the Metricbeat documentation for more information on configuring Autodiscover for Metricbeat.
    # To enable hints based autodiscover uncomment this:
    - type: kubernetes
      node: ${NODE_NAME}
      hints.enabled: true
The following ConfigMap settings are for node/system/pod/container/volume, which are default Metricset of Metricbeat's Kubernetes module. These metrics are pulled from the kubelet endpoint of each node.
kubernetes.yml: |-
  - module: kubernetes
    metricsets:
      - node
      - system
      - pod
      - container
      - volume
    period: 10s
    host: ${NODE_NAME}
    hosts: ["https://${NODE_NAME}:10250"]
    bearer_token_file: /var/run/secrets/kubernetes.io/serviceaccount/token
    ssl.verification_mode: "none"
And, just like Filebeat, all you have to do is add the URL and credentials for your Elasticsearch cluster.
Deploying the application
As with the previous blog, we will deploy the Cloud-Voting-App. The application interface has been built using Python/Flask. The data component uses Redis. Recall that the application was instrumented with Prometheus Python Client to expose Prometheus custom metrics. How do we collect Prometheus custom metrics despite the lack of Prometheus this time? Starting with 7.12, we can use Elastic APM Agent to get custom Prometheus metrics!
First, the application imports ElasticAPM and the environment variables are used for the Elastic APM Agent settings. SERVICE_NAME is an arbitrary character string for identifying the application, ENVIRONMENT is an arbitrary character string for identifying the application environment, and SECRET_TOKEN and SERVER_URL are for communicating with your APM Server. The final PROMETHEUS_METRICS is a parameter that indicates whether to get the metric from prometheus_client.
from elasticapm.contrib.flask import ElasticAPM
...
app = Flask(__name__)
...
# Elastic APM Configurations
app.config['ELASTIC_APM'] = {
# Set required service name. Allowed characters:
# a-z, A-Z, 0-9, -, _, and space
'SERVICE_NAME': os.environ['SERVICE_NAME'],
#
# Use if APM Server requires a token
'SECRET_TOKEN': os.environ['SECRET_TOKEN'],
#
# Set custom APM Server URL (default: http://localhost:8200)
'SERVER_URL': os.environ['SERVER_URL'],
#
# Set environment
'ENVIRONMENT': os.environ['ENVIRONMENT'],
#
# Set prometheus_metrics
'PROMETHEUS_METRICS': os.environ['PROMETHEUS_METRICS'],
}
apm = ElasticAPM(app)
The following is the Manifest for deploying the Cloud-Voting-App to a Kubernetes cluster. The respective file is located at elastic/cloud-vote-all-in-one-redis-aks.yaml. First of all, regarding the user interface cloud-vote-front, the variables required for the above-mentioned APM Agent are set as environment variables in container spec. Here, no pod-specific annotations are specified, hence both logs and metrics are acquired using the default settings.
apiVersion: apps/v1
kind: Deployment
metadata:
  name: cloud-vote-front
spec:
  replicas: 1
  selector:
    matchLabels:
      app: cloud-vote-front
  strategy:
    rollingUpdate:
      maxSurge: 1
      maxUnavailable: 1
  minReadySeconds: 5
  template:
    metadata:
      labels:
        app: cloud-vote-front
    spec:
      nodeSelector:
        "beta.kubernetes.io/os": linux
      containers:
      - name: cloud-vote-front
        image: your image name
        ports:
        - containerPort: 80
        resources:
          requests:
            cpu: 250m
          limits:
            cpu: 500m
        env:
        - name: REDIS
          value: "cloud-vote-back"
        - name: SERVICE_NAME
          value: "cloud-voting"
        - name: SECRET_TOKEN
          value: "APM Server secret token"
        - name: SERVER_URL
          value: "APM Server URL"
        - name: ENVIRONMENT
          value: "Production"
        - name: PROMETHEUS_METRICS
          value: "True"
On the other hand, the backend, cloud-vote-redis uses pod annotations to enable the Filebeat redis module for logs and the Metricbeat redis module for metrics, applying any necessary settings. While cloute-vote-front uses the default settings to collect logs and metrics with Beats, cloud-vote-back uses Beats' redis module for collecting logs and metrics. Also, by configuring how to collect logs and metrics in the application manifest instead of the Beats manifest, you can isolate the responsibilities between the Development team and the Observability platform team.
apiVersion: apps/v1
kind: Deployment
metadata:
  name: cloud-vote-back
spec:
  replicas: 1
  selector:
    matchLabels:
      app: cloud-vote-back
  template:
    metadata:
      labels:
        app: cloud-vote-back
      annotations:
        co.elastic.logs/enabled: "true"
        co.elastic.logs/module: redis
        co.elastic.logs/fileset.stdout: log
        co.elastic.metrics/enabled: "true"
        co.elastic.metrics/module: redis
        co.elastic.metrics/hosts: "${data.host}:6379"
    spec:
      nodeSelector:
        "beta.kubernetes.io/os": linux
      containers:
      - name: cloud-vote-back
        image: redis
        ports:
        - containerPort: 6379
          name: redis
Let's access Kibana
Now we have deployed all the required components. Let's vote a few times with the Cloud-Voting-App and then access Kibana.
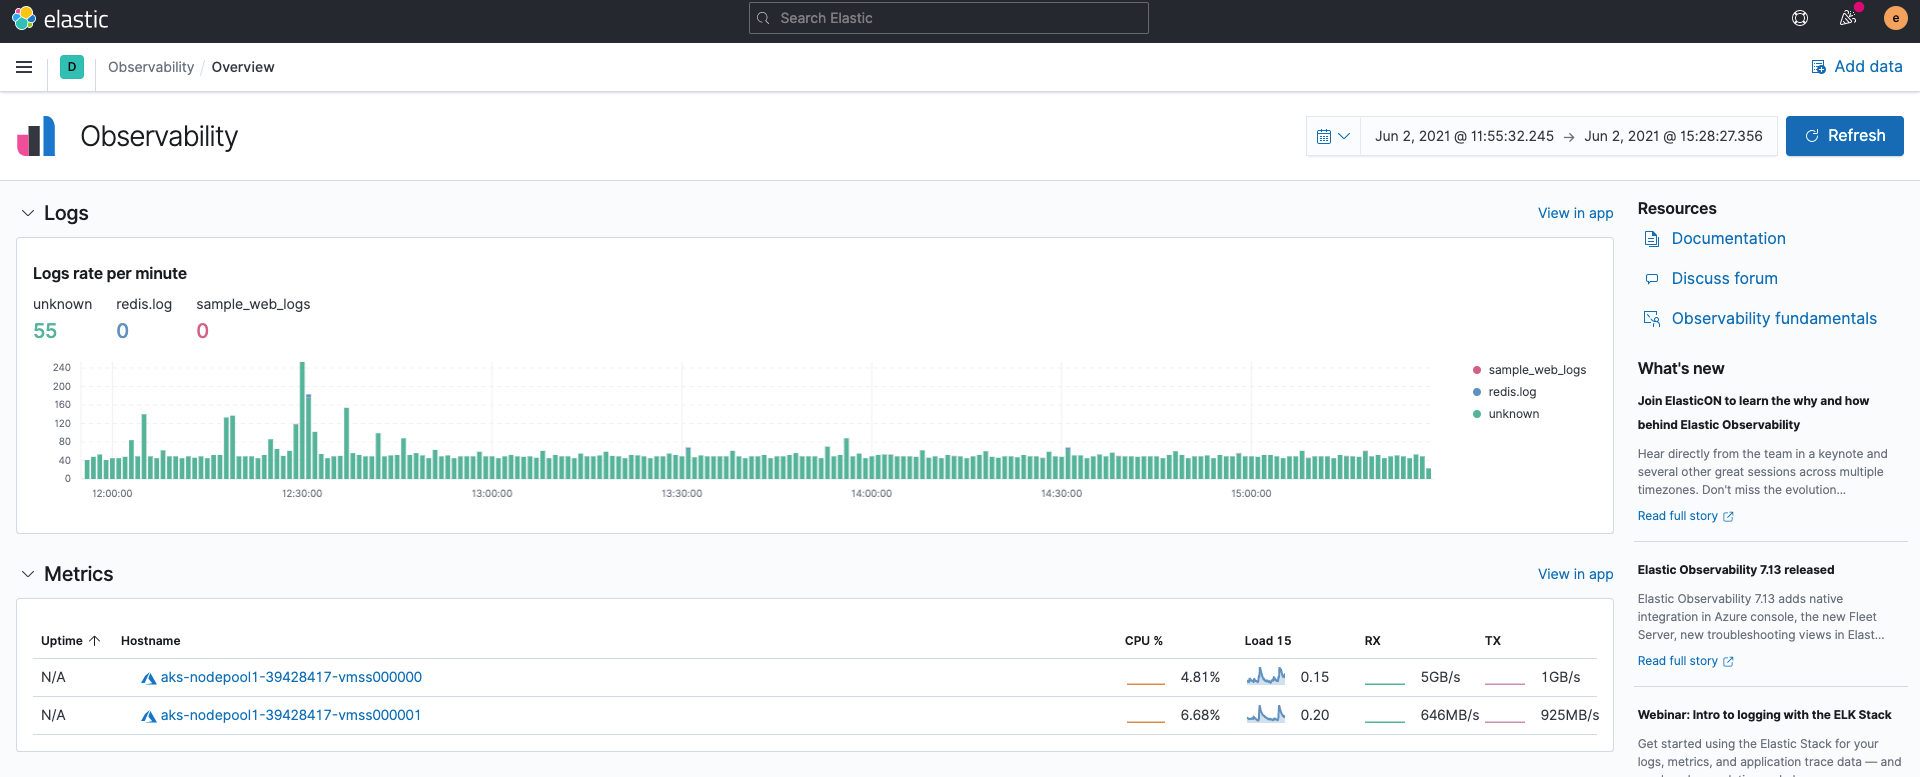
Observability overview
First of all, when you open Elastic Observability in Kibana, the logs rates of the log inputs from Filebeat and the summary of the metric inputs from Metricbeat are displayed without doing anything. This result comes from the fact that Filebeat and Metricbeat ingest data in ECS format by default.
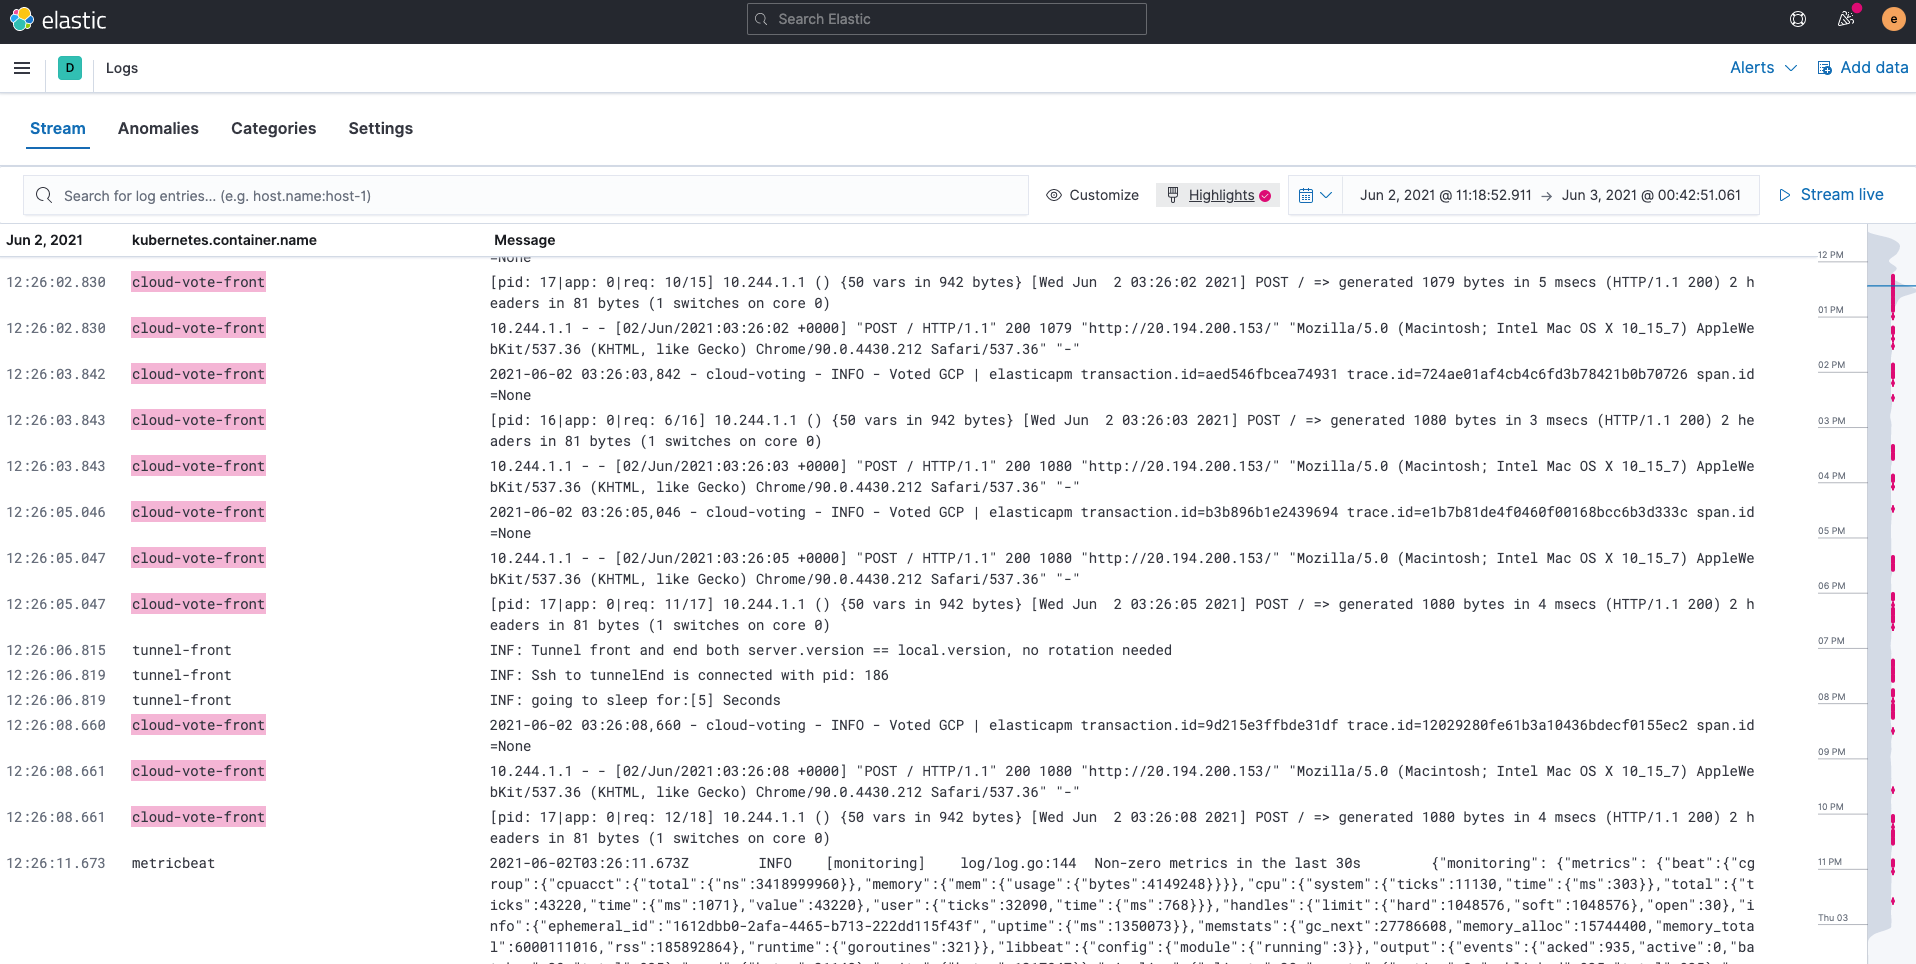
Logs
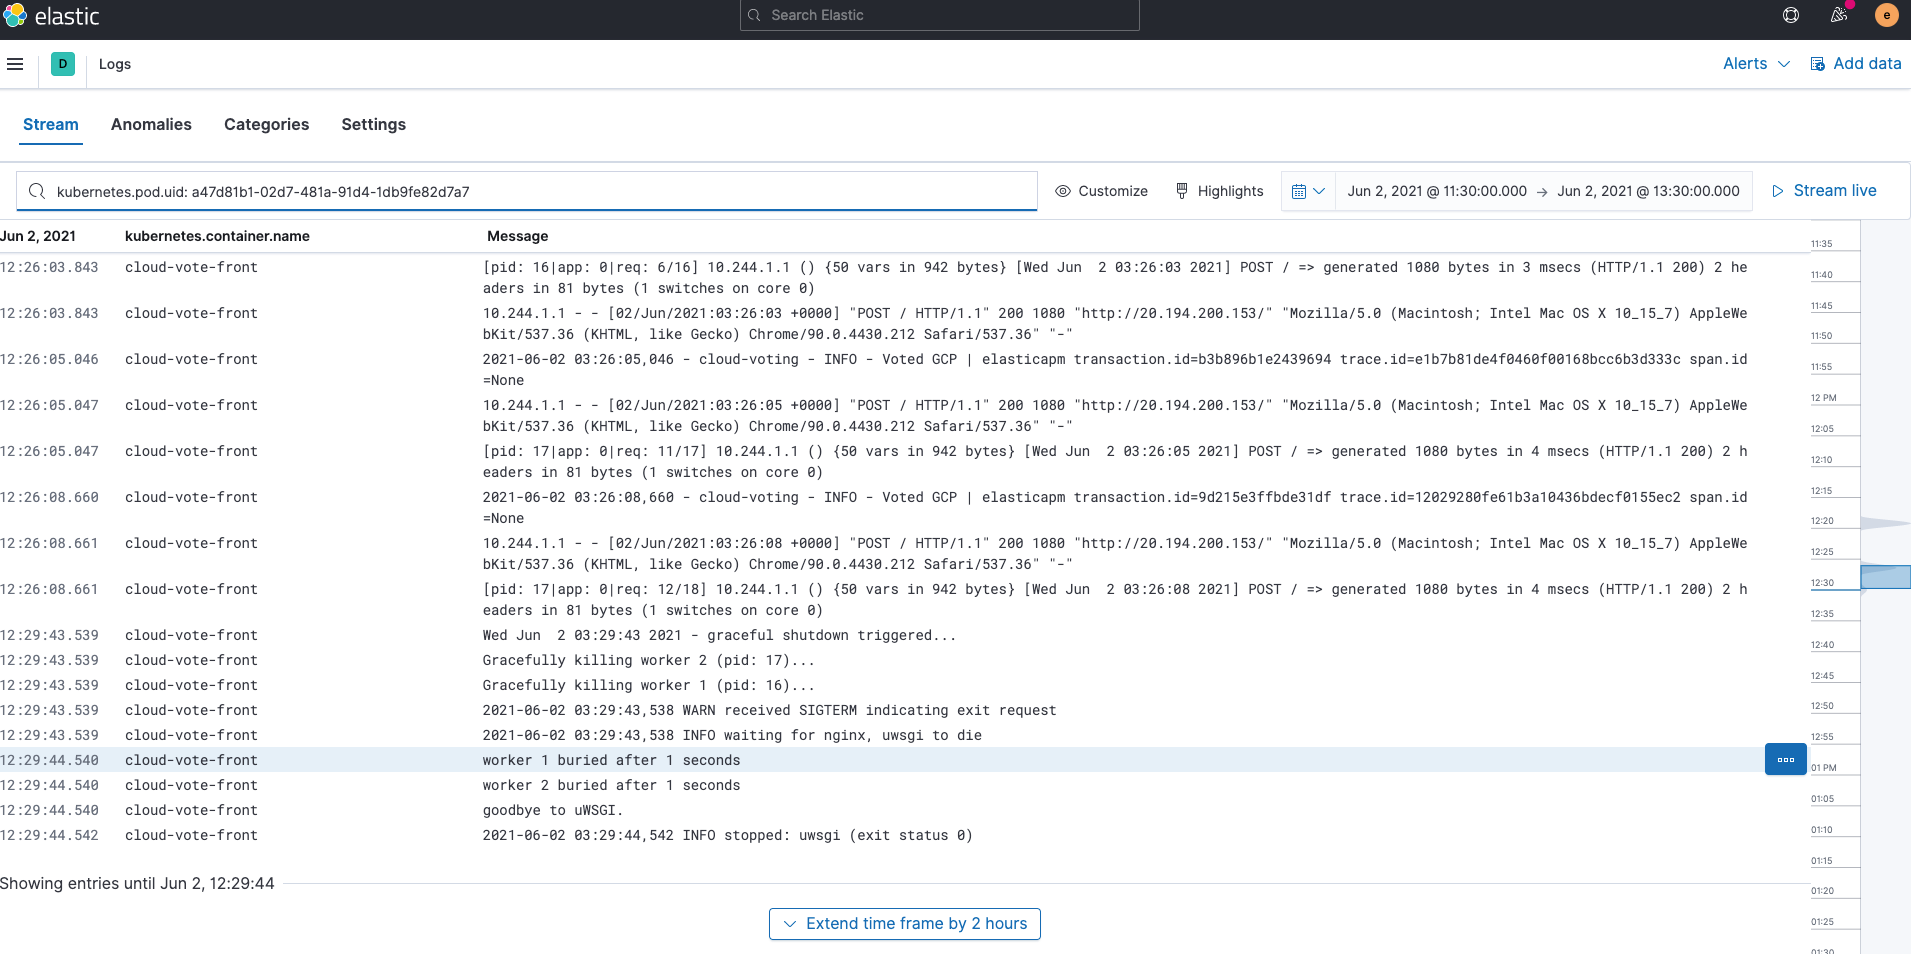
Logs ingested by Filebeat are stored into the indices filebeat-*. You can use the Logs app on Kibana to search, filter, and tail all the logs collected in Elasticsearch. You can also highlight specific strings; for instance, we’ve highlighted cloud-vote-front in the example below.
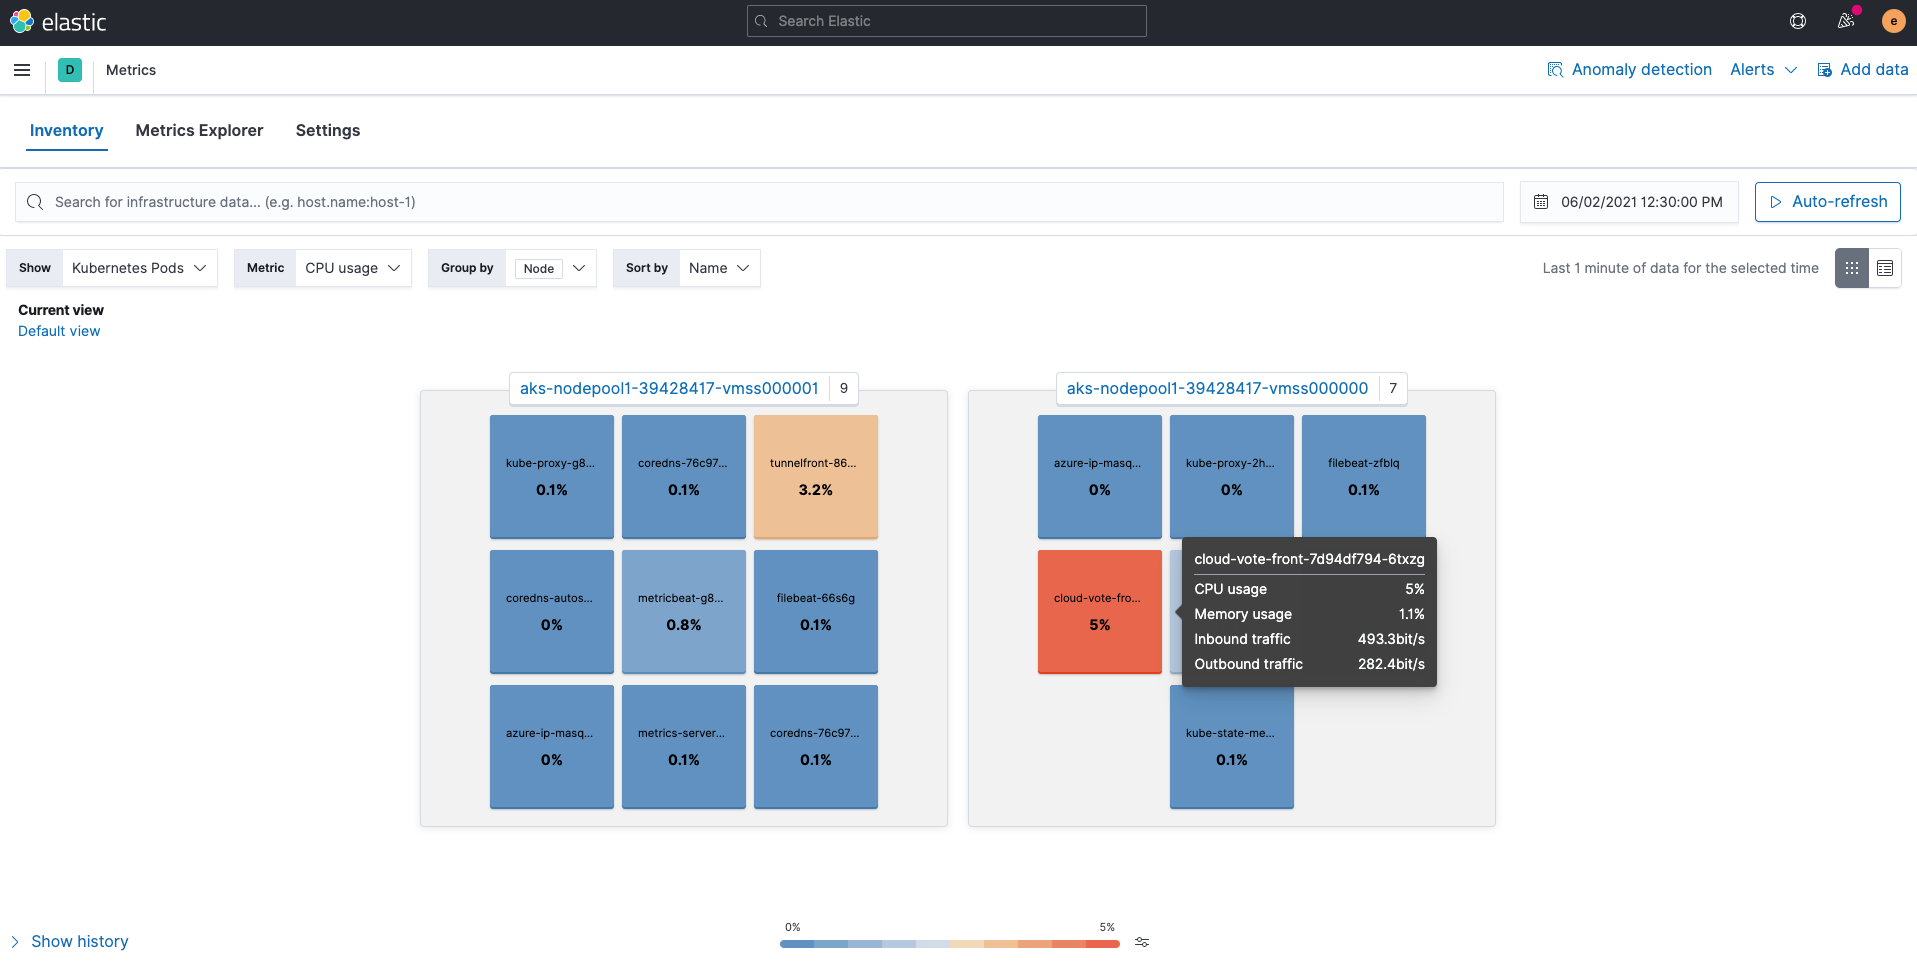
Metrics
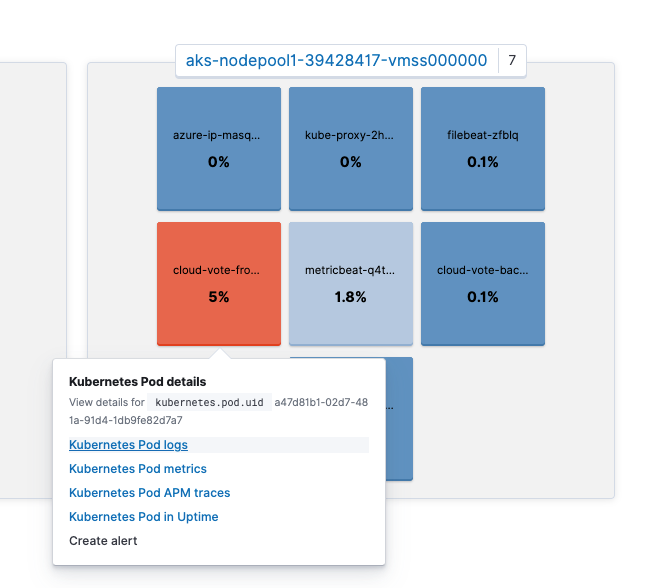
Metrics ingested by Metricbeat are stored into the indices metricbeat-*. The Metrics app in Kibana provides an easy-to-understand and intuitive way to view the metrics collected in Elasticsearch. Using the Kubernetes Pods view, as shown below, maps Kubernetes nodes and pods, and shows the usage of each resource.
You can also click on a specific pod to jump to other apps, such as pod logs or APM traces, while preserving context. Notice that View details for kubernetes.pod.uid a47d81b1-02d7-481a-91d4-1db9fe82d7a7 is displayed on the screen.
You can then jump to the logs for this pod by clicking on Kubernetes Pod logs. Did you notice that the search bar in the Logs app is already populated with kubernetes.pod.uid: a47d81b1-02d7-481a-91d4-1db9fe82d7a7? By preserving the context in this way, Kibana can transition from app to app seamlessly returning relevant results instantly.
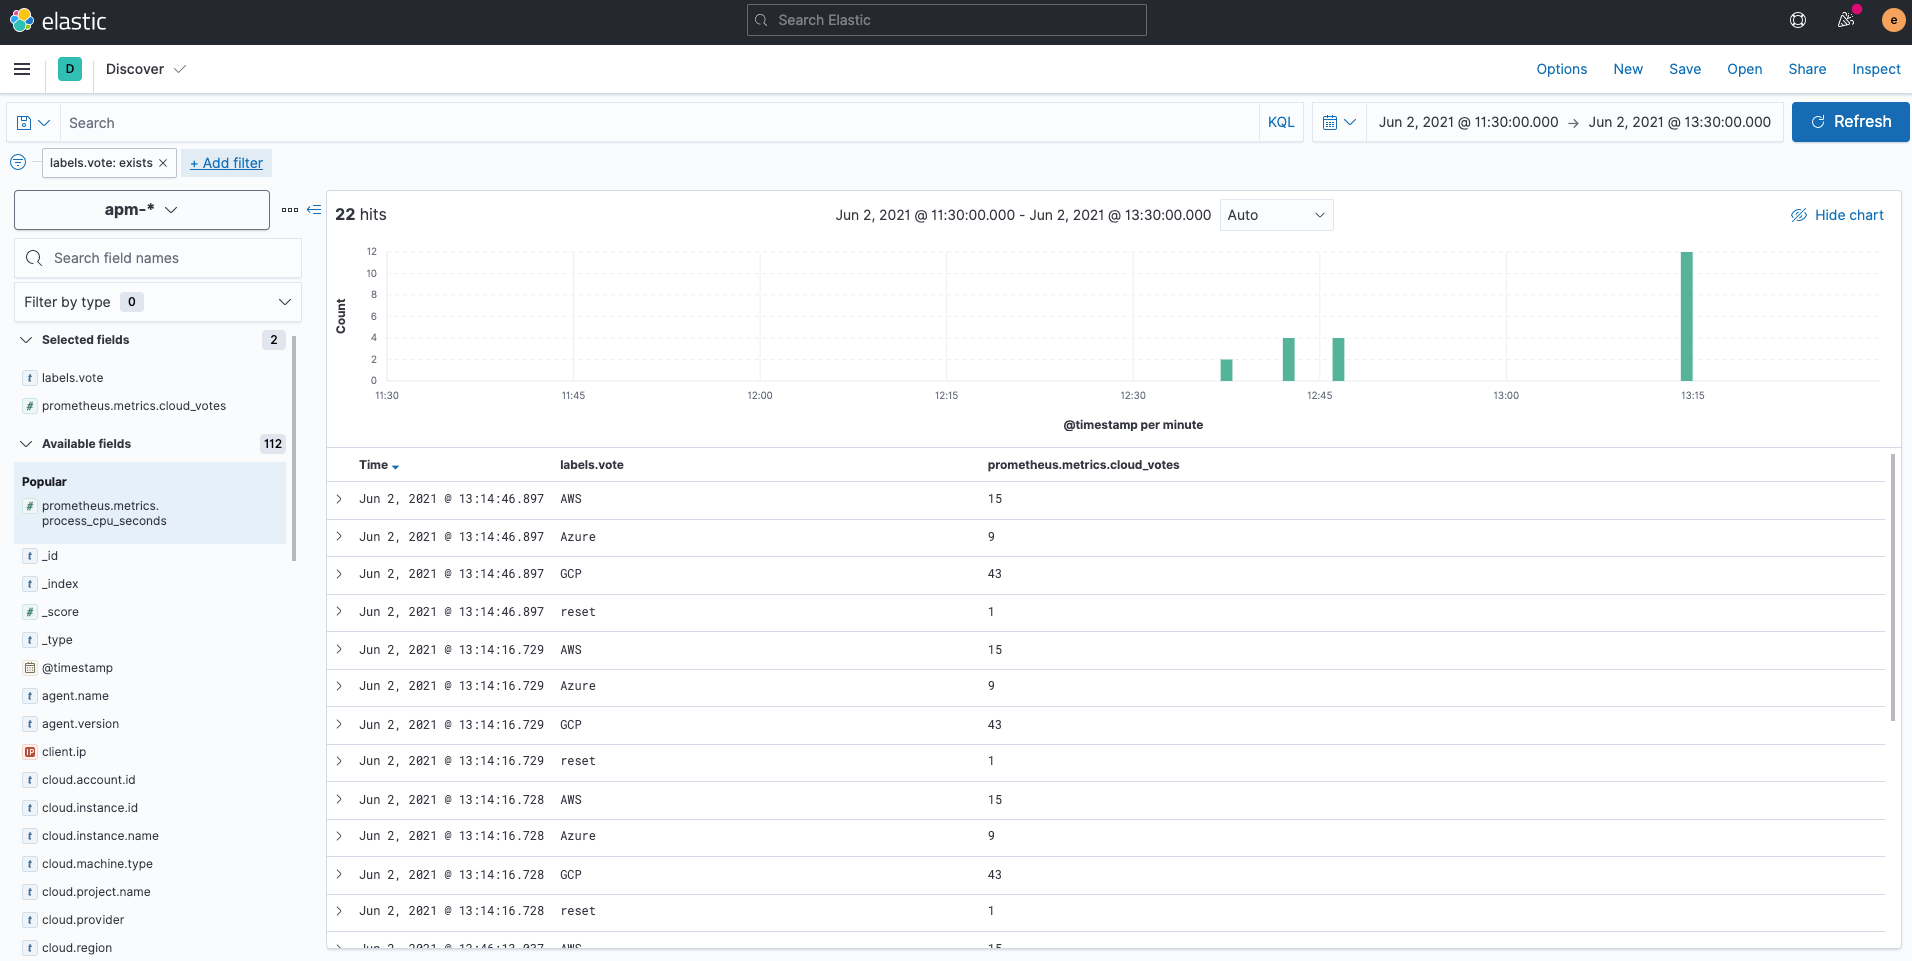
So what happened to the Prometheus custom metrics? Custom metrics held by the Prometheus Python Client are written to indices called apm-* via Elastic APM Agent. If you check with Kibana Discover, you can see that it is collected in the field prometheus.metrics.cloud_votes. The variable in the POST request is stored as labels.vote. Please refer to the APM documentation for more information on collecting Prometheus custom metrics with Elastic APM Python agent.
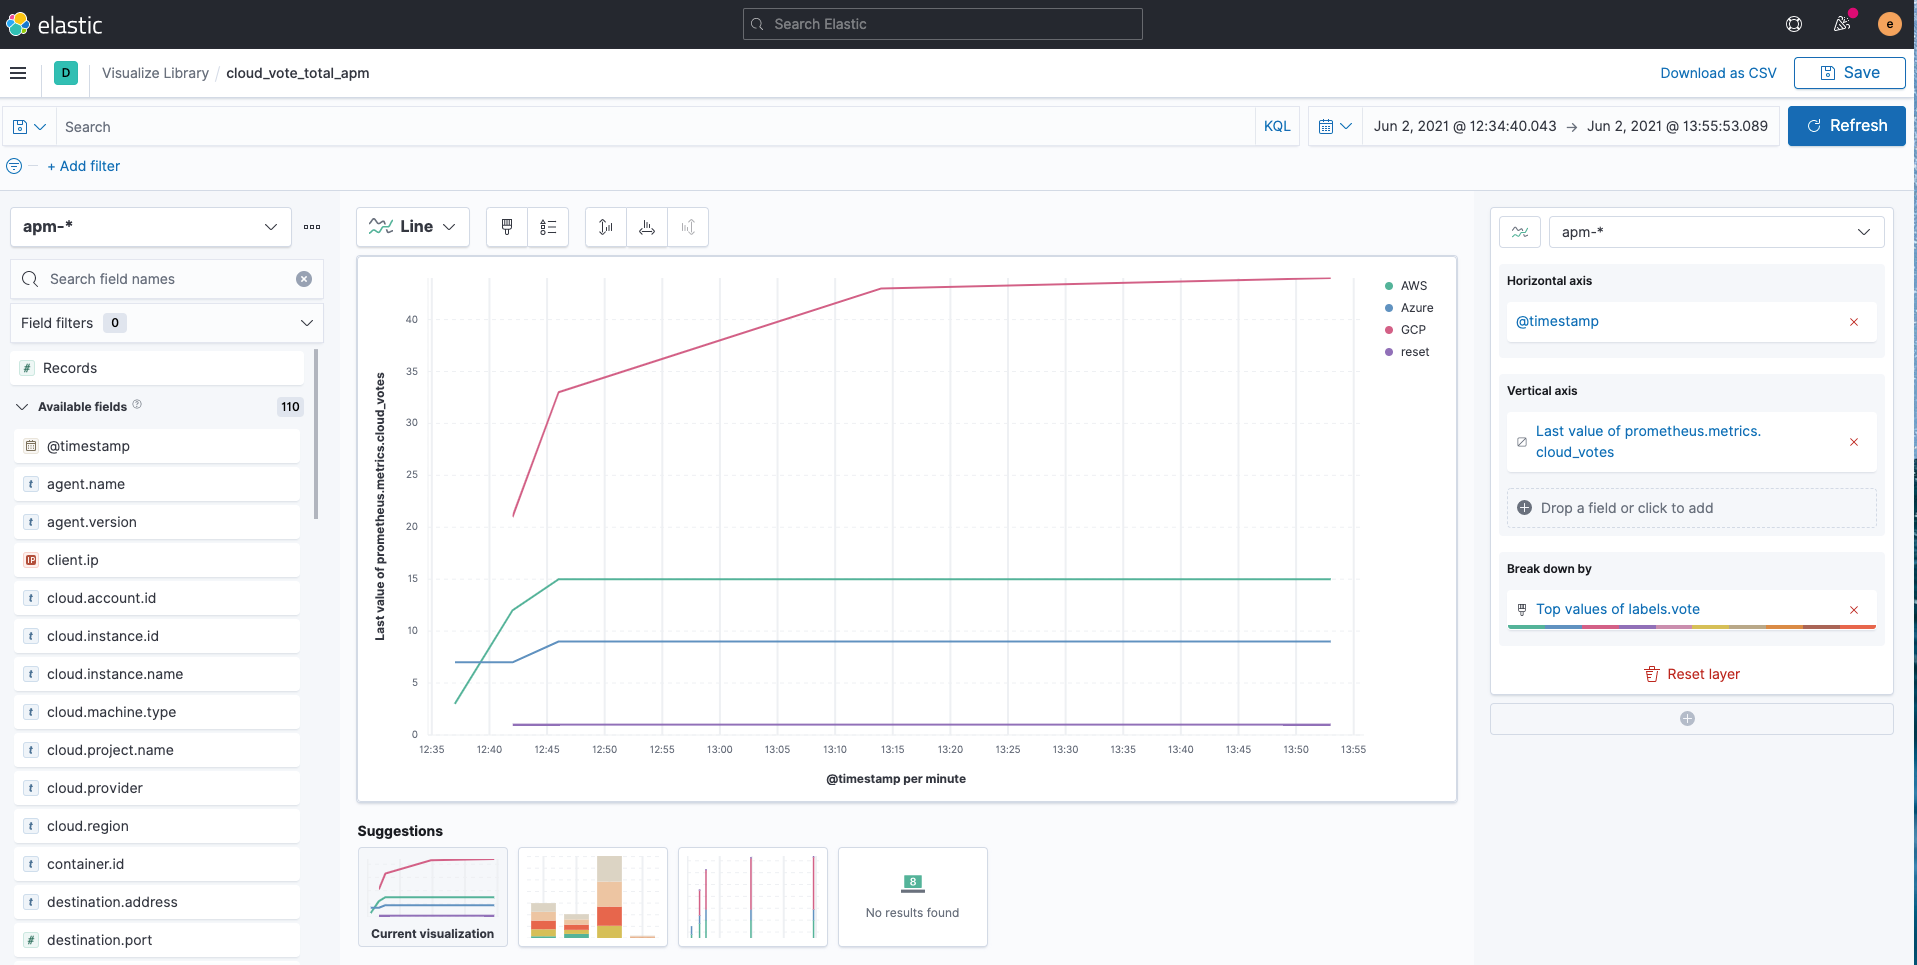
You can easily visualize the apm-* indices with Kibana Lens as follows.
Predefined dashboards
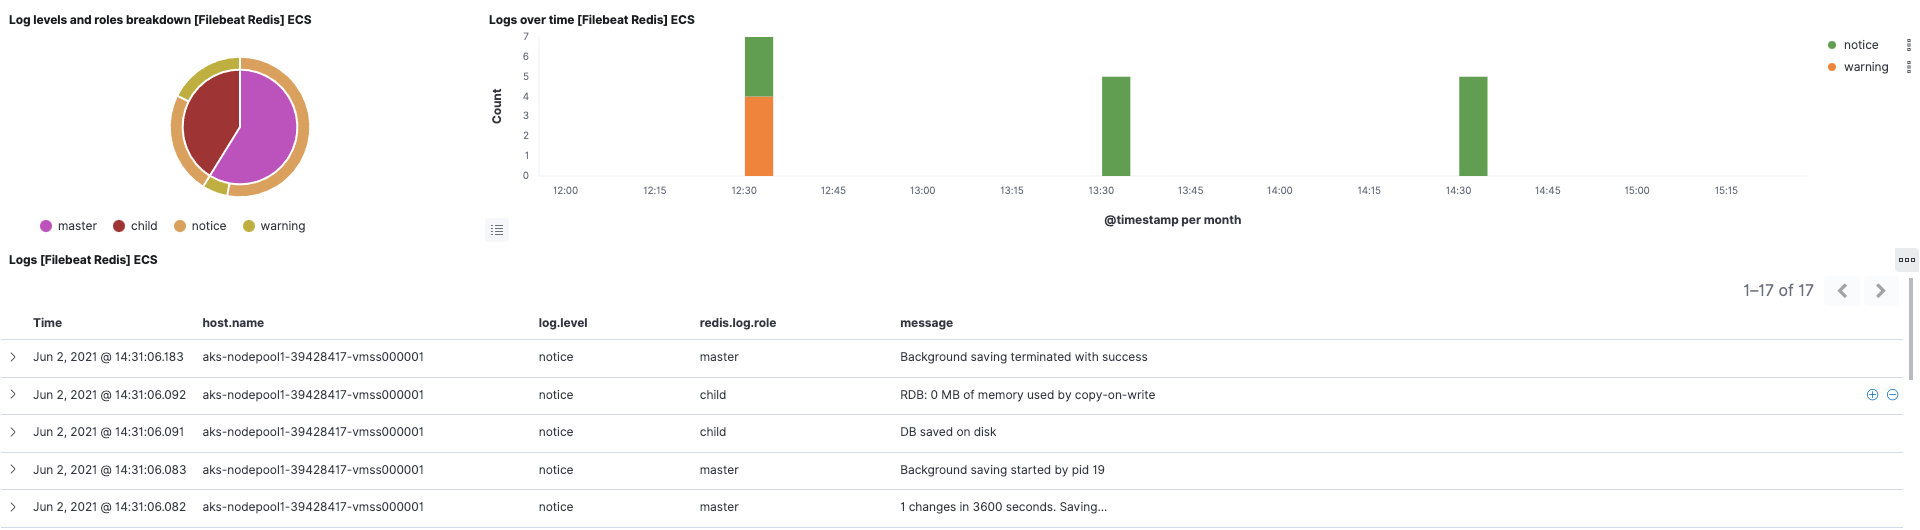
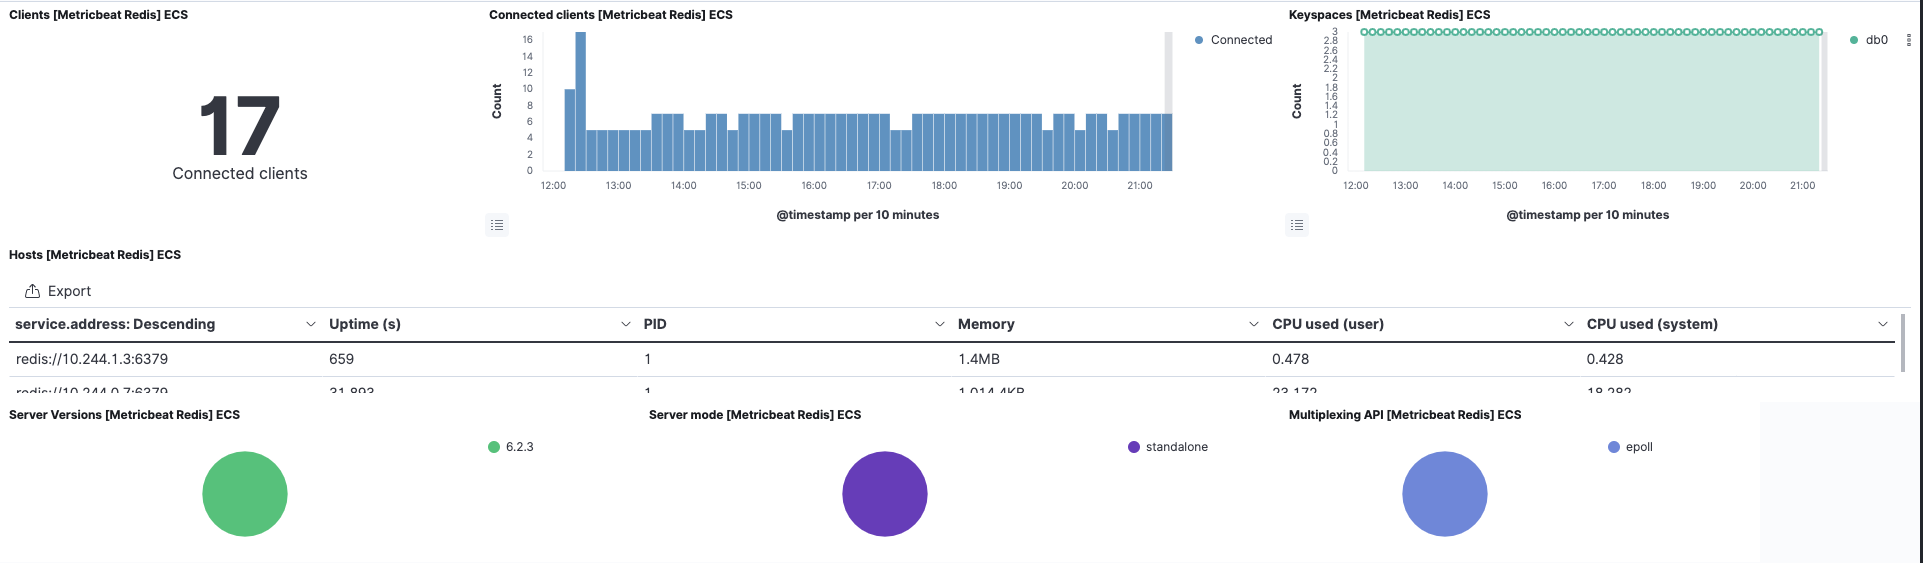
For the cloud-vote-back pod using Redis, we have enabled the redis module for both Filebeat and Metricbeat. This will also pre-create related out-of-the-box dashboards. You can instantly visualize Redis logs and metrics with no additional setup.
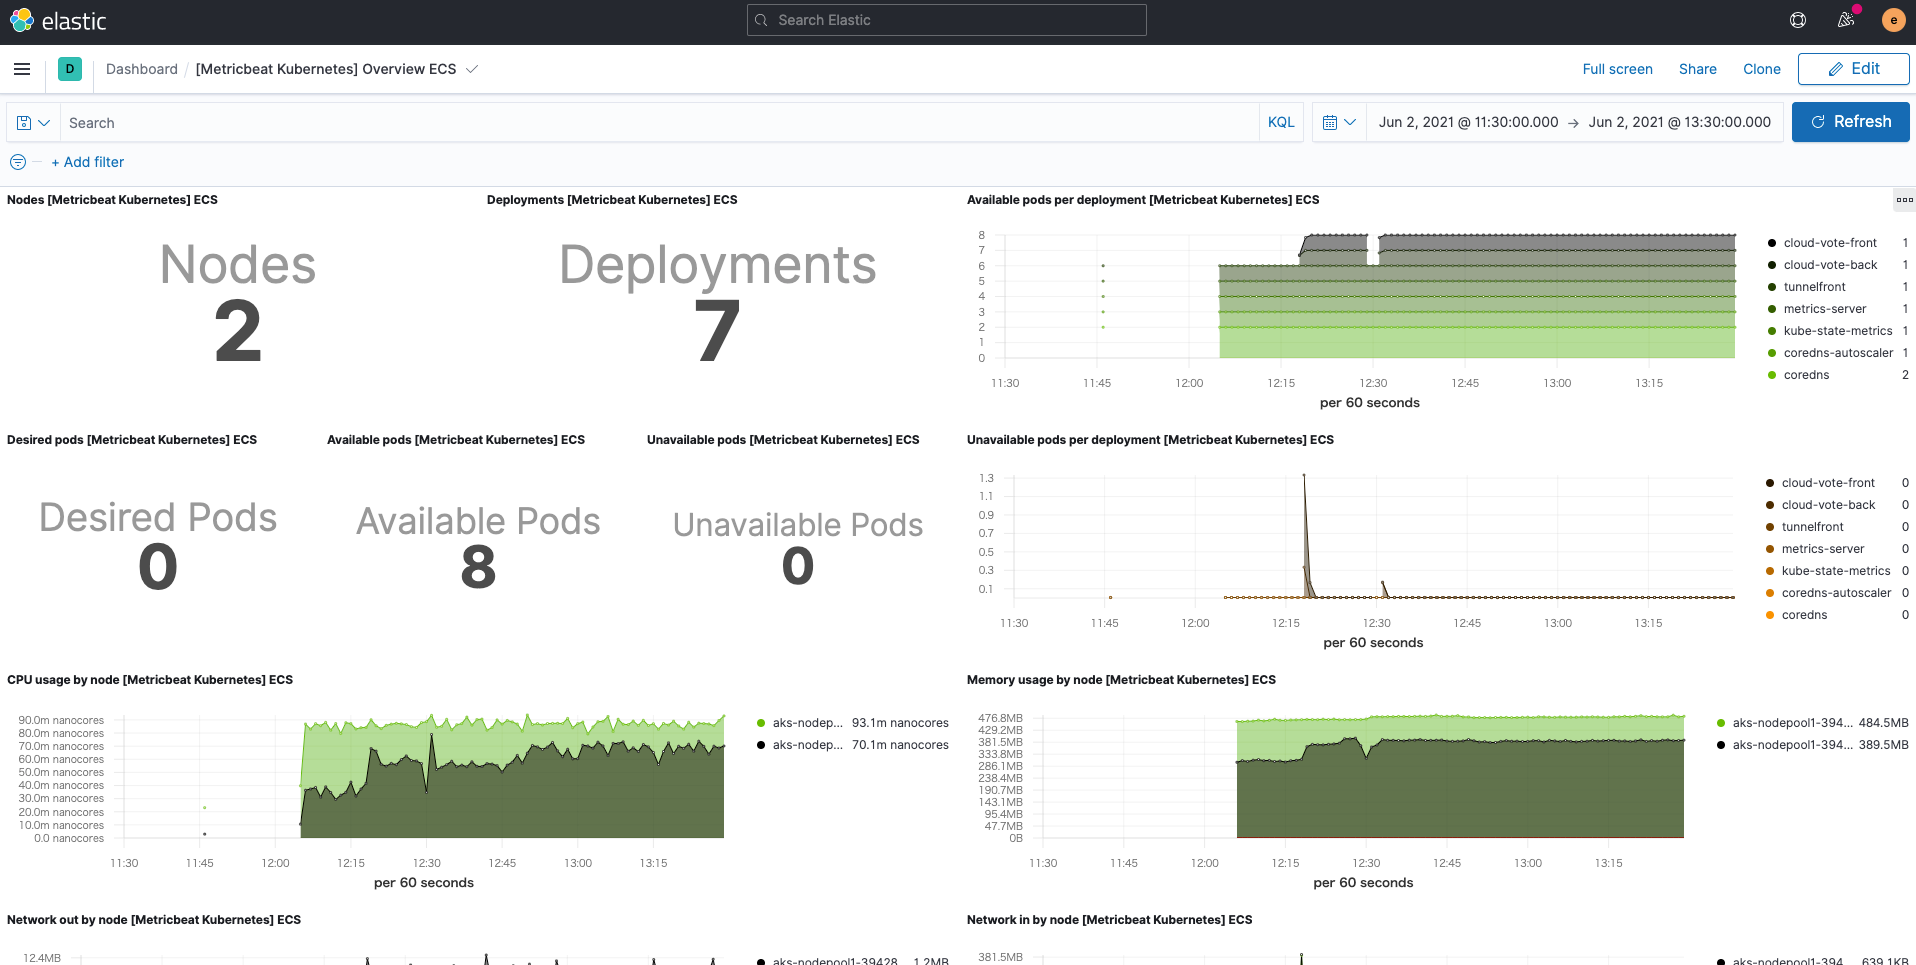
In addition, the Kubernetes dashboard is also ready for use, thanks to Metricbeat's Kubernetes module.
Summary
In this blog, we've seen a more Elastic way to use Filebeat and Metricbeat to populate the Elastic Stack with logs and metrics for monitoring Kubernetes. We've also seen how to use Elastic APM Agent to get Prometheus custom metrics. You can start monitoring your Kubernetes environments today by signing up for a free trial of Elastic Cloud, or by downloading the Elastic Stack and hosting it yourself. Elastic Observability allows for more efficient and effective monitoring. It can also be integrated with Elastic machine learning and Kibana alerting to establish highly automated, actionable, comprehensive observability. If you run into any hurdles or have questions, jump over to our Discuss forums — we're here to help.
In a future follow-up blog post, stay tuned for more ways to use Elastic for monitoring Kubernetes.