Docker and Kubernetes Hints-Based Autodiscover with Beats
Starting with 6.0, we began adding new features to Beats, improving our support for container monitoring. We recently introduced a new feature: Autodiscover in Filebeat and Metricbeat, with support for Docker and Kubernetes. Autodiscover allows you to define a set of configurations that will be dynamically launched by Beats when you want them. This feature is especially useful to monitor containers, due to the their dynamic nature.
The challenge of containers monitoring
With traditional infrastructure, you would normally set up a new host, configure all the services to run on it, and configure the monitoring agent to query them periodically. Configuration management tools help on the task, but things are still pretty static.
With containers architecture everything becomes a moving target. Deployments are dynamic, they grow, shrink and disappear, containers come and go from one node to another. There is no fixed IP to retrieve your metrics from.
We need specific tools to track things down.
Autodiscover
Let's have a look to how it works, this is a sample config:
metricbeat.autodiscover:
  providers:
   - type: docker
     templates:
       - condition.contains:
           docker.container.image: etcd
         config:
          - module: etcd
            metricsets: ["leader", "self", "store"]
            hosts: "${data.host}:2379"

output.elasticsearch:
  hosts: ["localhost:9200"]
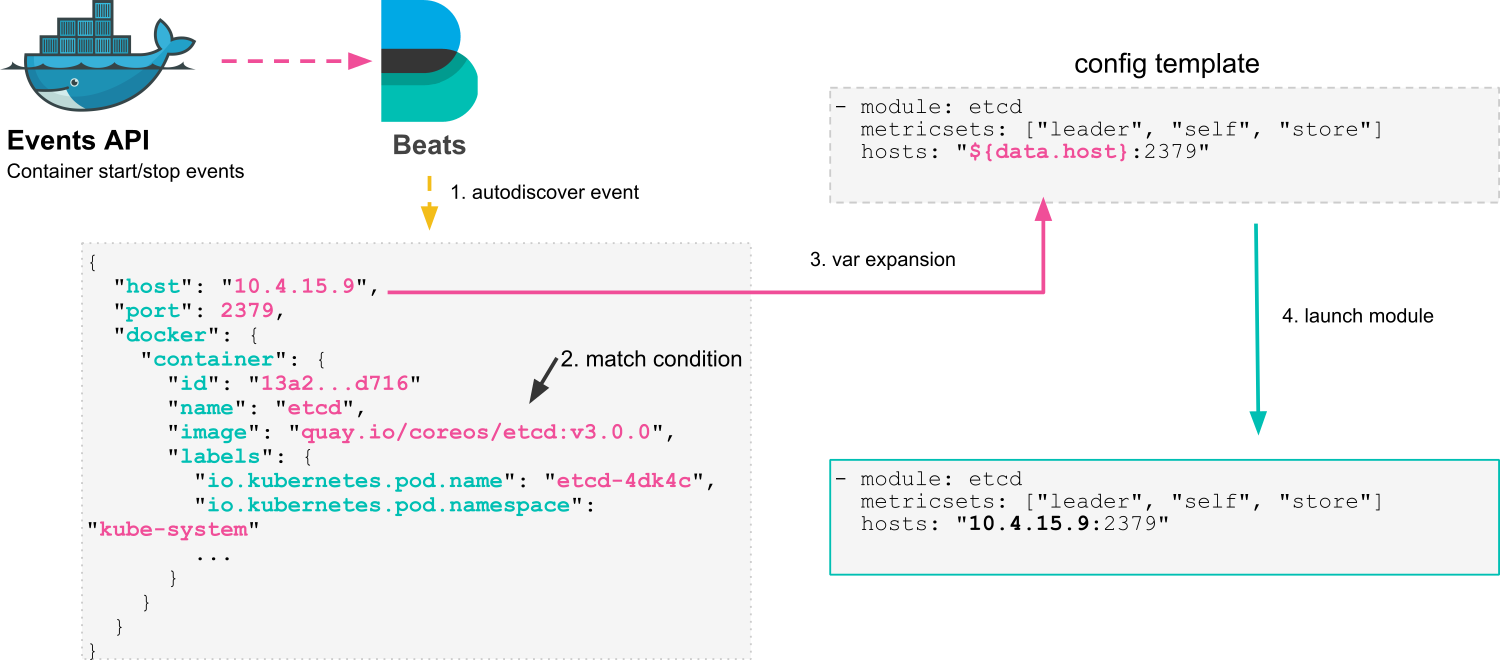
This is configuring Metricbeat to use the docker autodiscover provider. You can define a list of templates to use, tied to the condition that should trigger them. In this case, the condition is matching the container image that contains etcd (we use contains as the image field stores name:tag pairs). When an etcd container is created, Metricbeat will launch the etcd module to monitor it, replacing the ${data.host} variable with the container IP address.
Let's see how all this works in detail:
1. Autodiscover Events
Beats Autodiscover has support for multiple providers, with Kubernetes and Docker currently available. Providers implement a way to watch for events on a specific platform. Once an event happens, the provider issues an Autodiscover event, containing all the info you may need to react to it.
2. Condition Matching
Every event is checked against a list of conditions, using the same config format as processors. If one conditions matches the event, it will spawn the given set of configs for it.
3. Var Expansion
Configuration templates may contain variables, these are substituted by actual values from the event that triggered the condition. This mechanism allows you to define dynamic configs that can depend on the status of a container, like the IP address. But it also allows for more complex configurations, through the use of labels and annotations.
4. Config Start/Stop
Once the final configuration is created, it will be launched by the autodiscover process. Valid configurations include modules in Metricbeat and Filebeat as well as inputs in the latter.
There are both start and stop events, so a configuration launched by autodiscover will be automatically stopped once the container goes away. This doesn't require any special configuration.
A nice added feature when using autodiscover is that all the events coming out of it will automatically get enriched with Docker or Kubernetes metadata, so there is no need to use the adddockermetadata or addkubernetesmetadata processors. This metadata will help when navigating logs and metrics, by allowing you to filter them and focus on what matters.
Introducing Hints
With the release of 6.3 you can now use hints to define how to monitor your containers. Traditionally, you needed to update your Beats settings file to configure the monitoring of a newly deployed application.
Hints based autodiscover inverts the control of monitoring settings, by allowing you to store them next to the application container instead of a central place. This means that the team building & deploying an app is empowered to take responsibility on defining how to monitor it.
This config enables hints based autodiscover for your Kubernetes container logs (this change can be done in our reference Kubernetes manifest for filebeat, for instance):
filebeat.autodiscover:
  providers:
    - type: kubernetes
      hints.enabled: true
That's it, you can use Kubernetes Pod annotations or Docker labels to tell Filebeat and Metricbeat how to treat your container logs. For instance, if you are running a Java application in a Pod, you can add these annotations to it:
annotations:
  co.elastic.logs/multiline.pattern: '^\['
  co.elastic.logs/multiline.negate: 'true'
  co.elastic.logs/multiline.match: after
When the Pod starts, Filebeat will process the annotations and start reading its logs with the given multiline pattern, minded to put Java stack traces together. You can check the documentation for a full list of available hints.
You can also use modules to process logs into structured data, for instance, if you are running an NGINX server, just add this annotations and all its logs will be processed to give you insights about your visits:
annotations:
  co.elastic.logs/module: nginx
  co.elastic.logs/fileset.stdout: access
  co.elastic.logs/fileset.stderr: error
As you can see, each stream of the log output is mapped to a different fileset. You can also map all streams to a single fileset by defining just co.elastic.logs/fileset.
You can also benefit from hints when using Metricbeat, this is how you would configure the same NGINX instance to make Metricbeat fetch metrics from it. As you can see, variable expansion is also available here, ${data.host} is used to take the IP address of the container.
annotations:
  co.elastic.metrics/module: nginx
  co.elastic.metrics/metricsets: stubstatus
  co.elastic.metrics/hosts: '${data.host}:80'
  co.elastic.metrics/period: 10s
Take into account that you can use both sets of hints together, if you are running both Filebeat and Metricbeat.
Wrapping up
Hints-based autodiscover moves the configuration of your monitoring settings next to the applications you want to monitor. This brings the right tools to teams, especially in multi tenant scenarios. It also gives a simple set of instructions to work with, making the experience simple and to the point.
We have only scratched the surface of what you can do with autodiscover. We are eager to get your feedback and know more about how you are using it! Don't hesitate to pass by our Beats forum and tell us about your experience.