Unified observability for your multi-cloud and hybrid ecosystem
As infrastructure spreads across clouds, understanding what's happening gets harder. Elastic unifies monitoring across every cloud service, container, and workload in a single, scalable platform so you can find and fix issues faster.
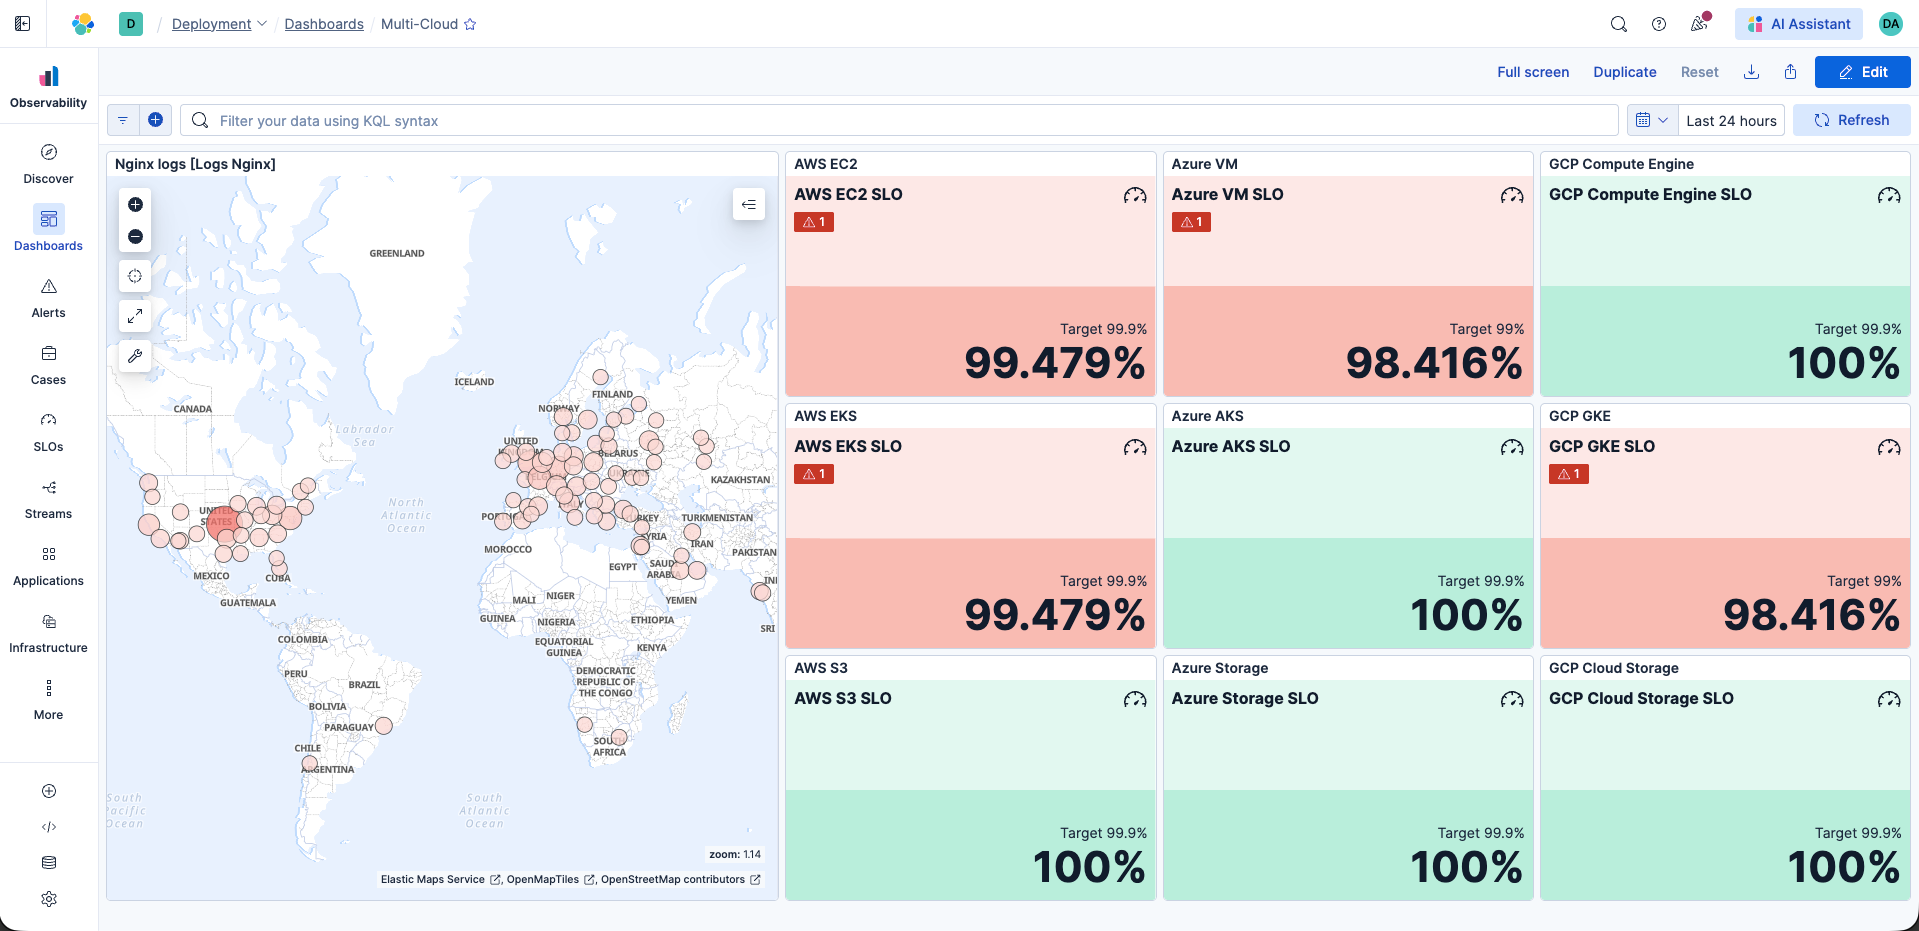
One platform. All clouds.
Monitor, analyze, and resolve issues across hybrid and multi-cloud environments — all from a single platform.


From applications to containers to serverless
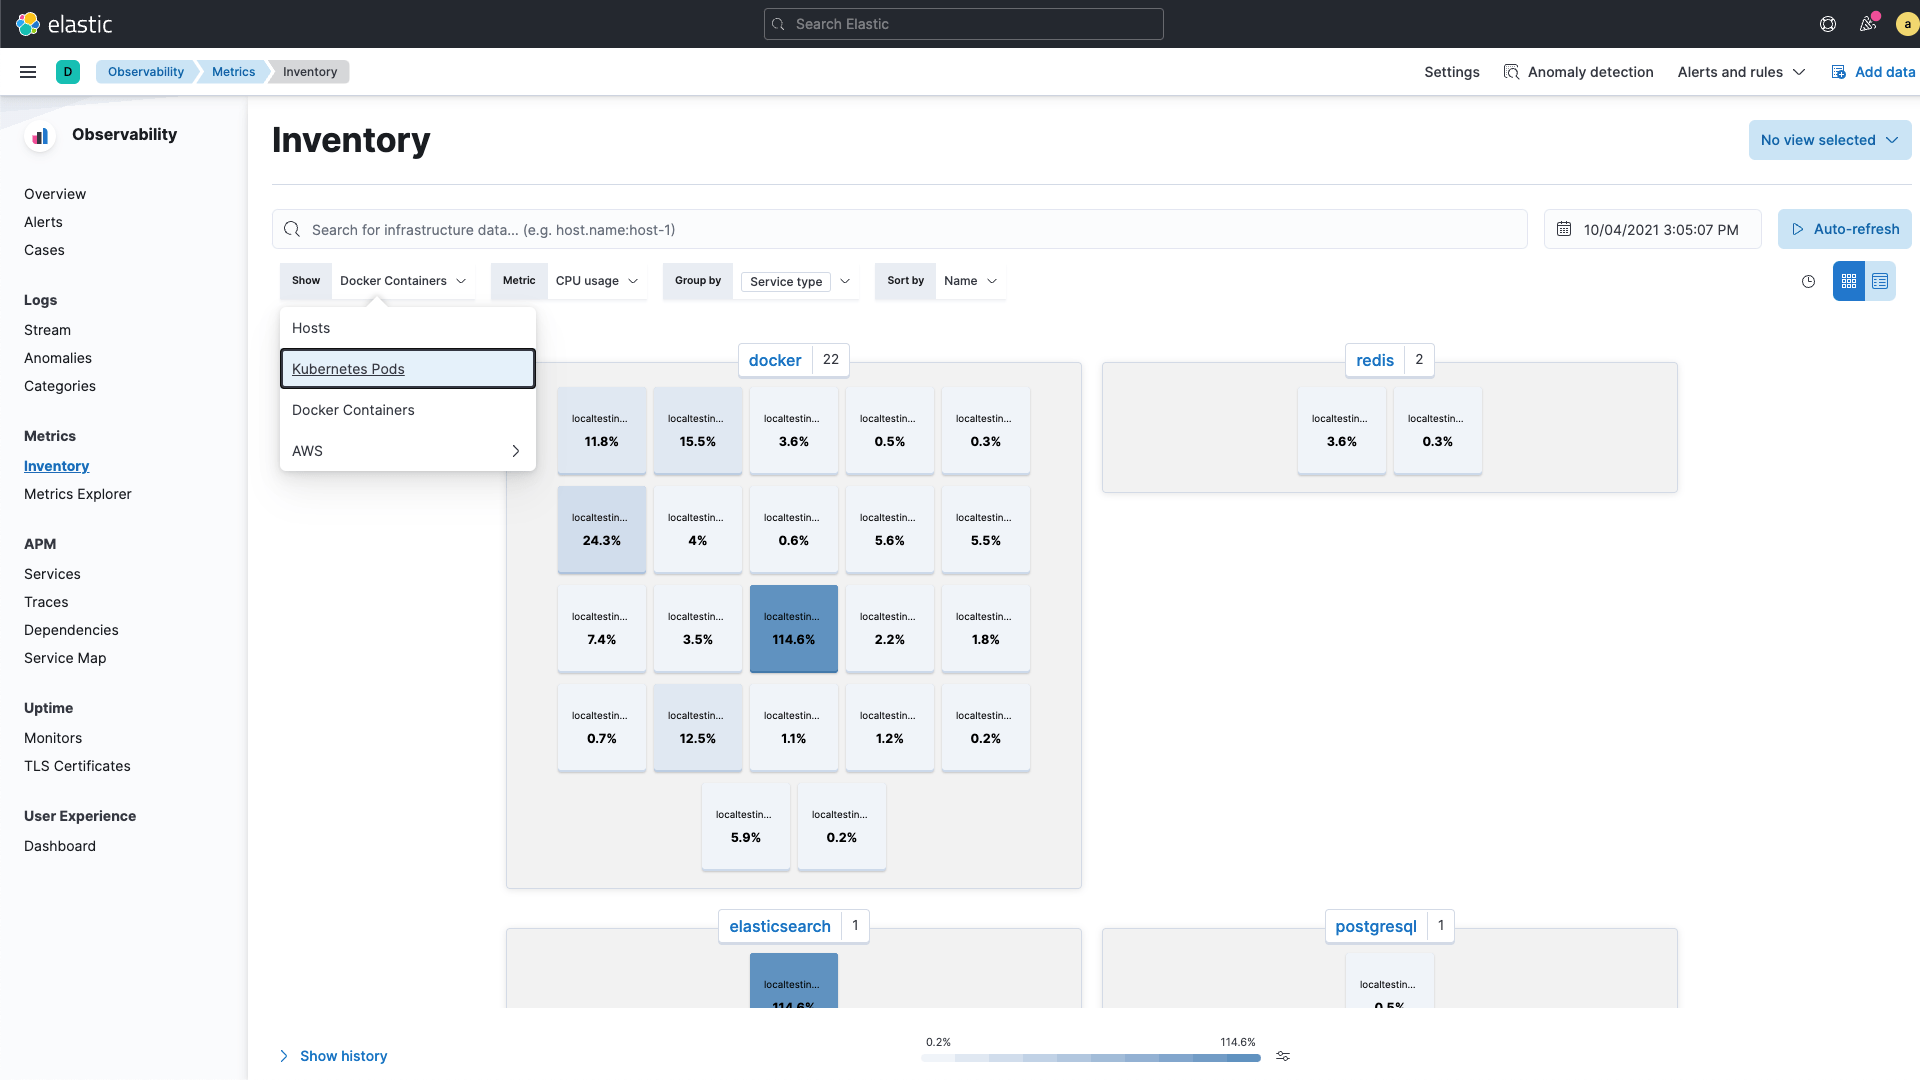
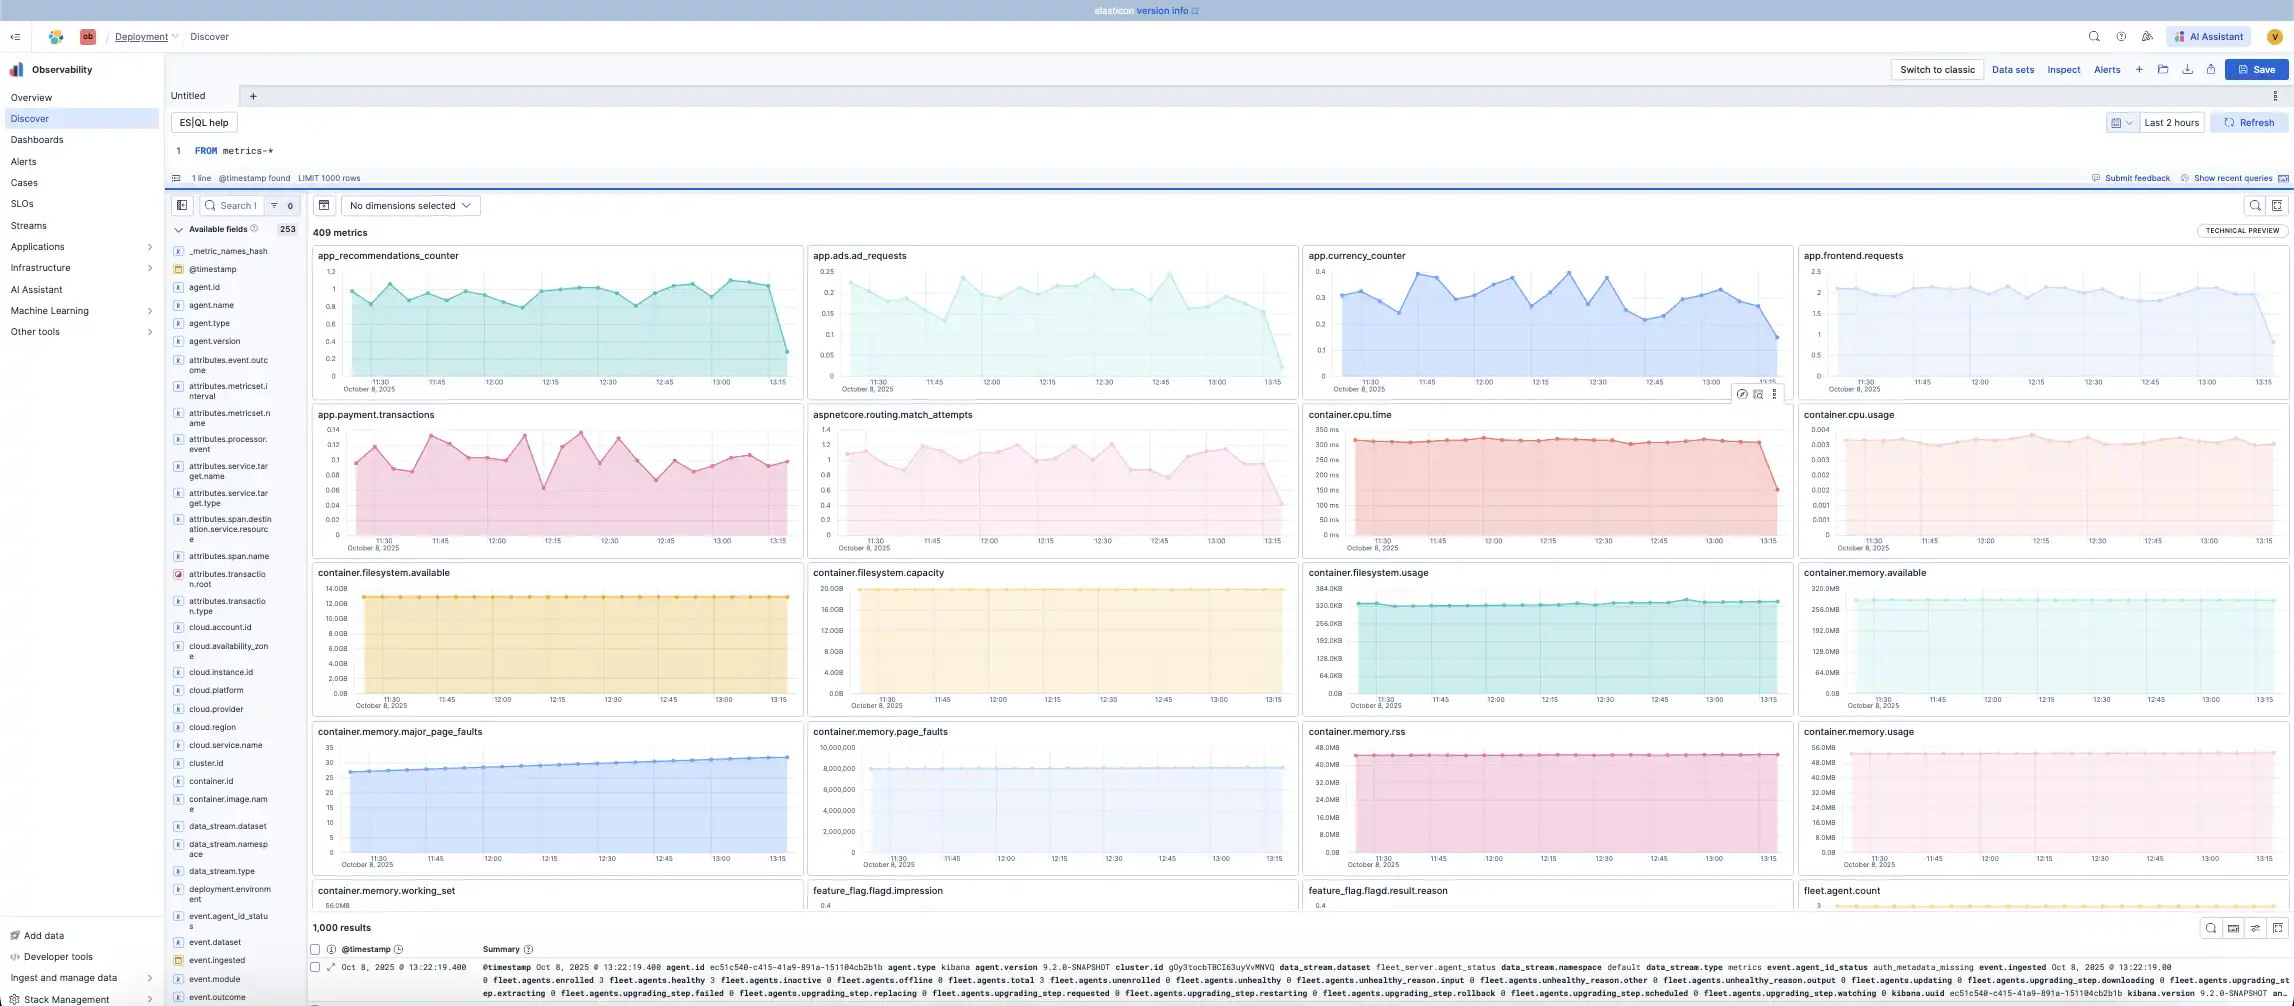
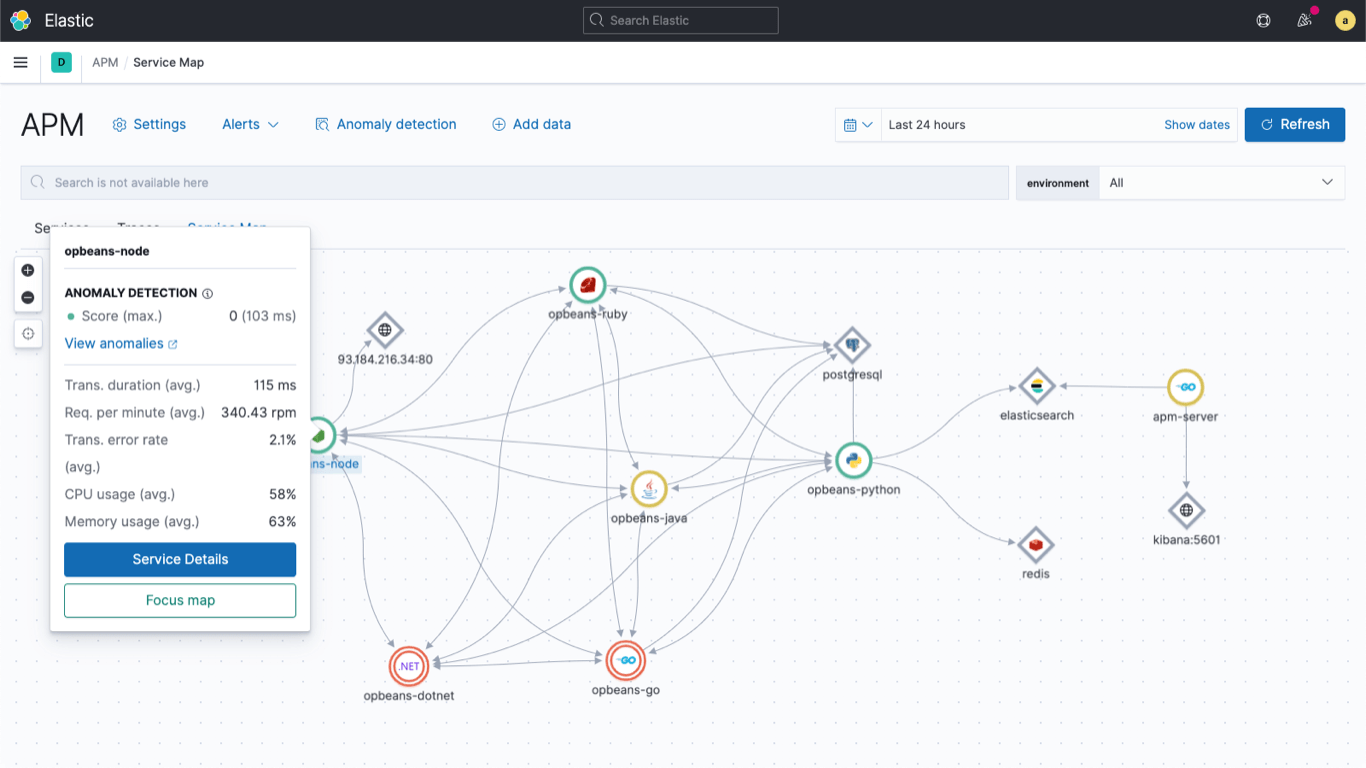
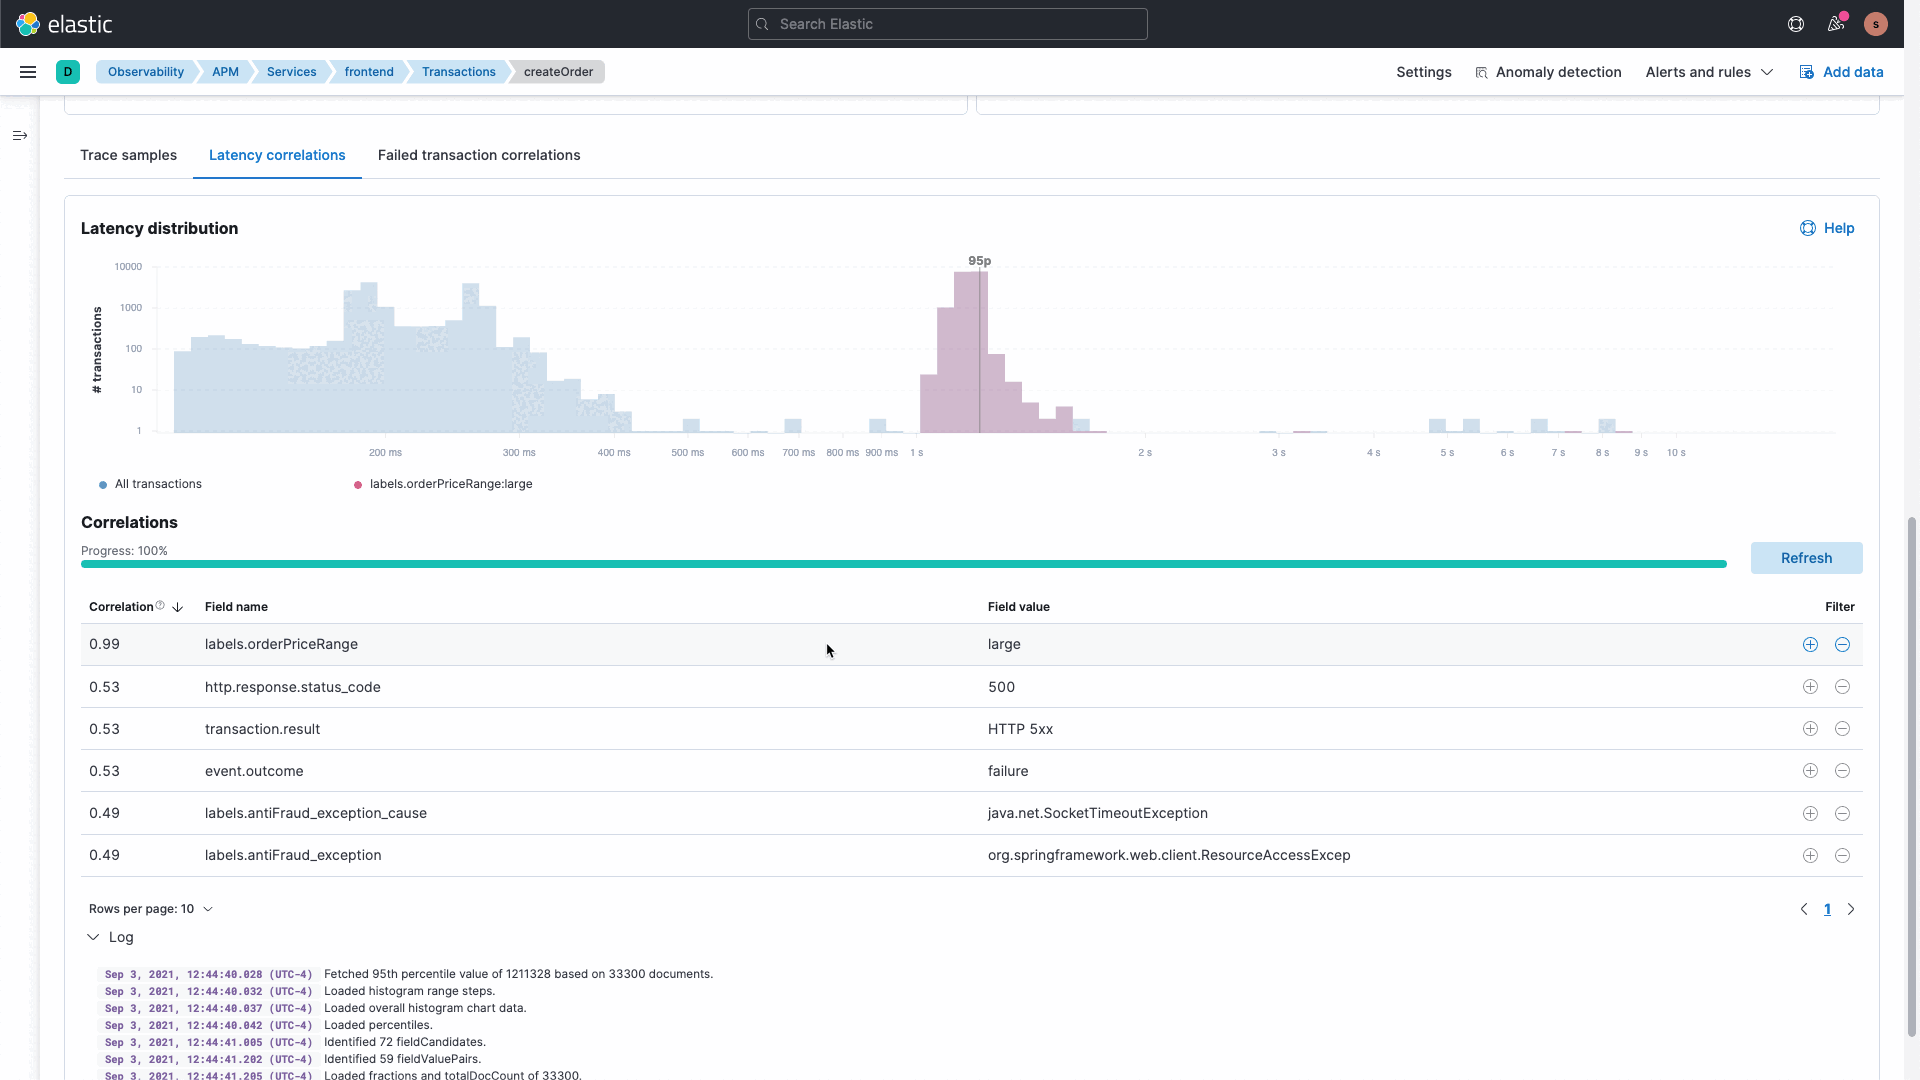
Get immediate visibility across cloud-native infrastructure and applications, including services, hosts, containers, Kubernetes pods, and serverless/FaaS tiers.
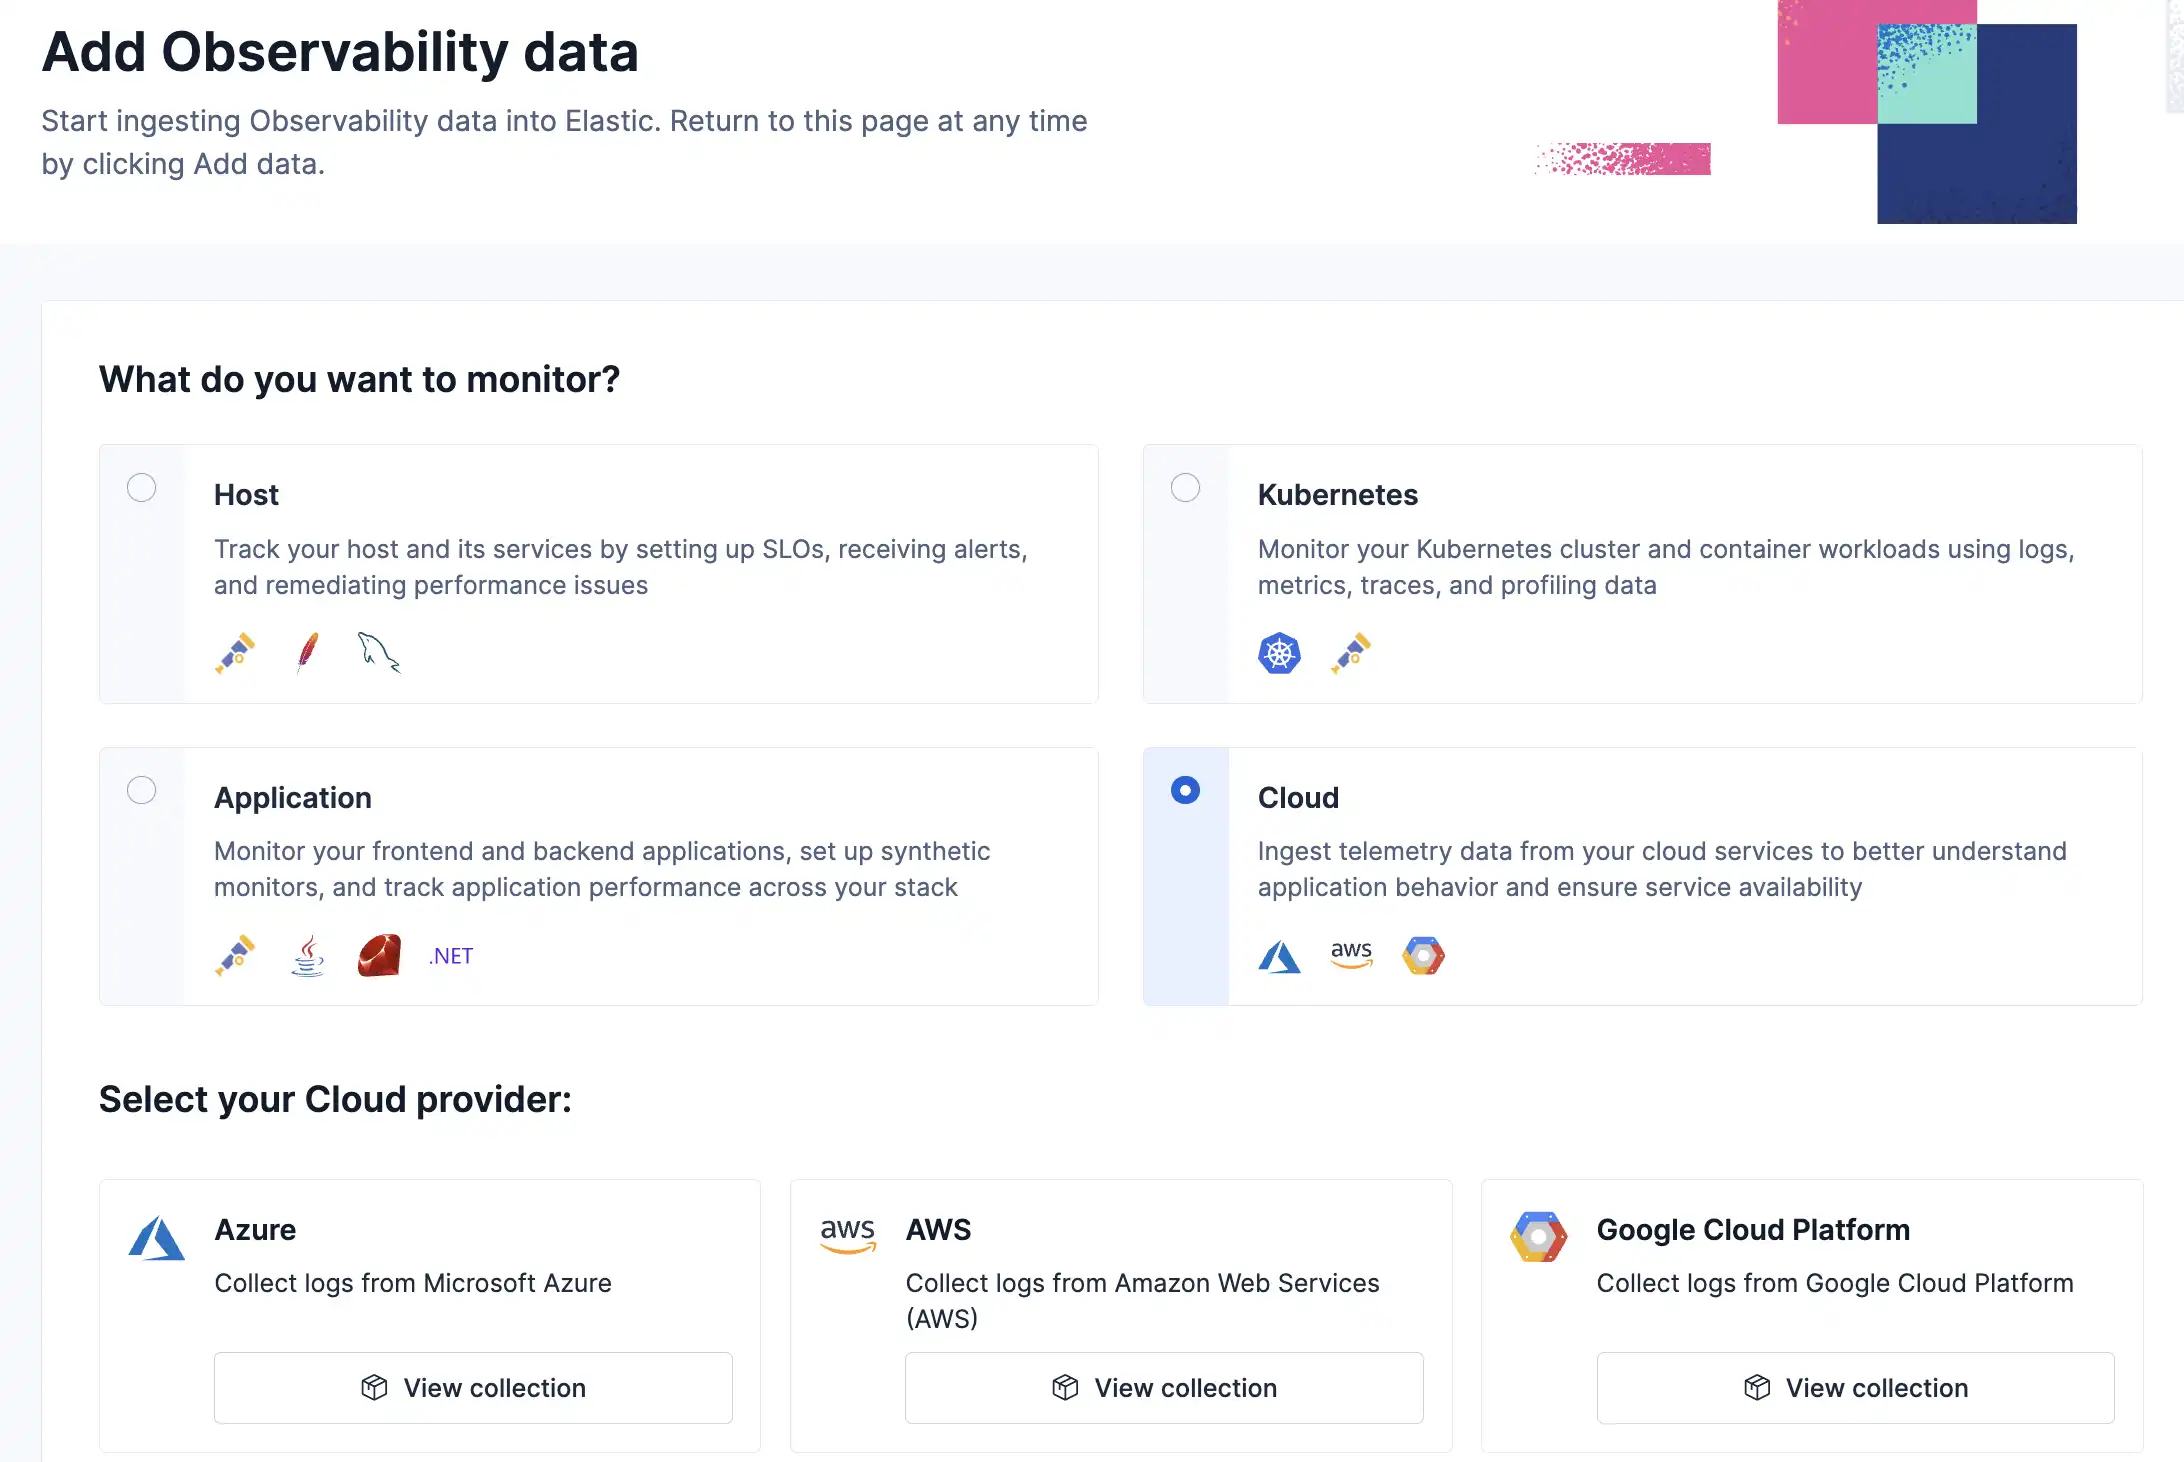
Unify visibility across your on-premises and cloud environments. Ingest telemetry from applications, infrastructure, and more, with 450+ out-of-the-box integrations for popular platforms and cloud services.
CLOUD MIGRATION
Migrate your workloads with confidence
Get full visibility of your entire ecosystem with Elastic’s scalable distributed clusters, efficient datastore, and low-latency performance.


