Discover and monitor your serverless environment
Serverless architectures take on-demand tasks to the next level with event-driven scheduling of workloads. Elastic Observability gives you the same insights into your serverless activities as the rest of your environment. Gather logs and metrics from your serverless invocations and tie them together with traces from your serverless functions.
Take a deep dive into the considerations you should keep in mind when choosing an observability solution.
Download the ebookTrace AWS Lambda functions for comprehensive end-to-end visibility.
Learn moreUse AWS Cloudwatch with Elastic to monitor your environment.
Find out moreGet unified visibility of your serverless applications
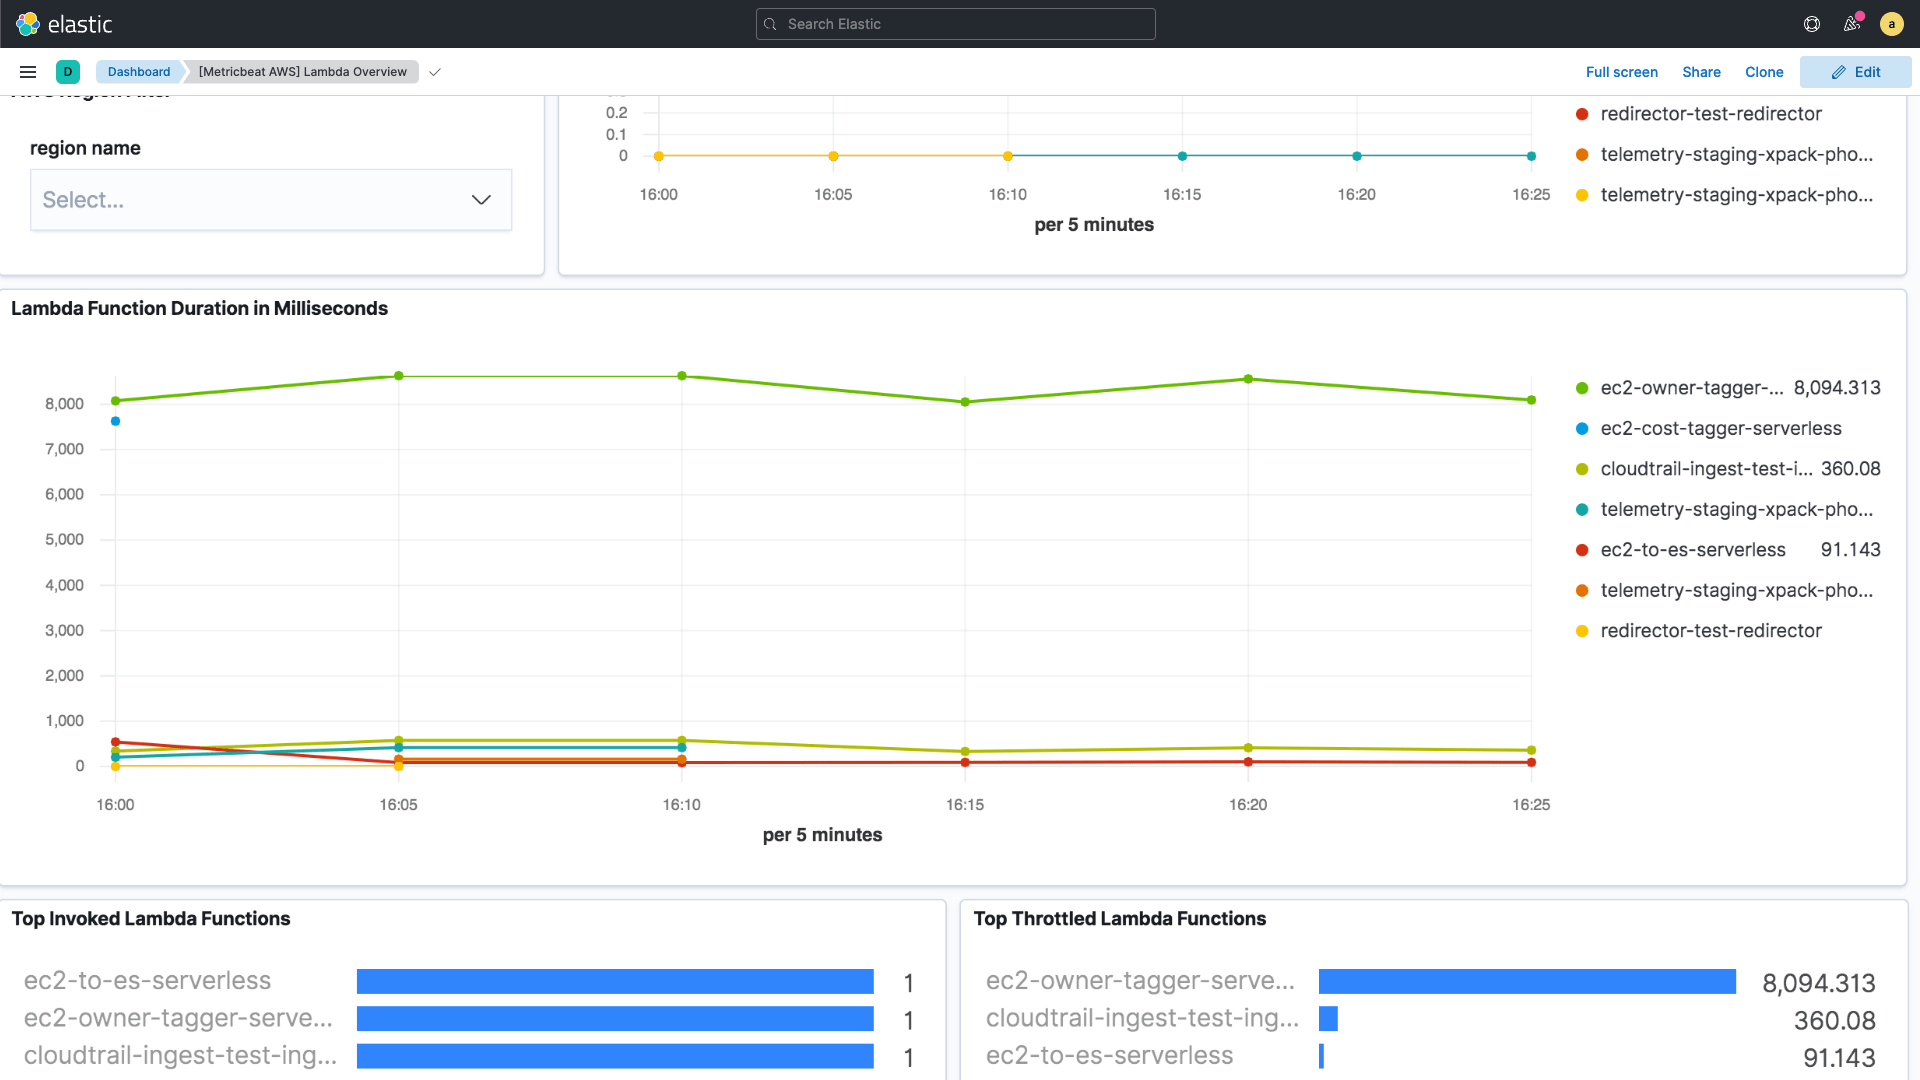
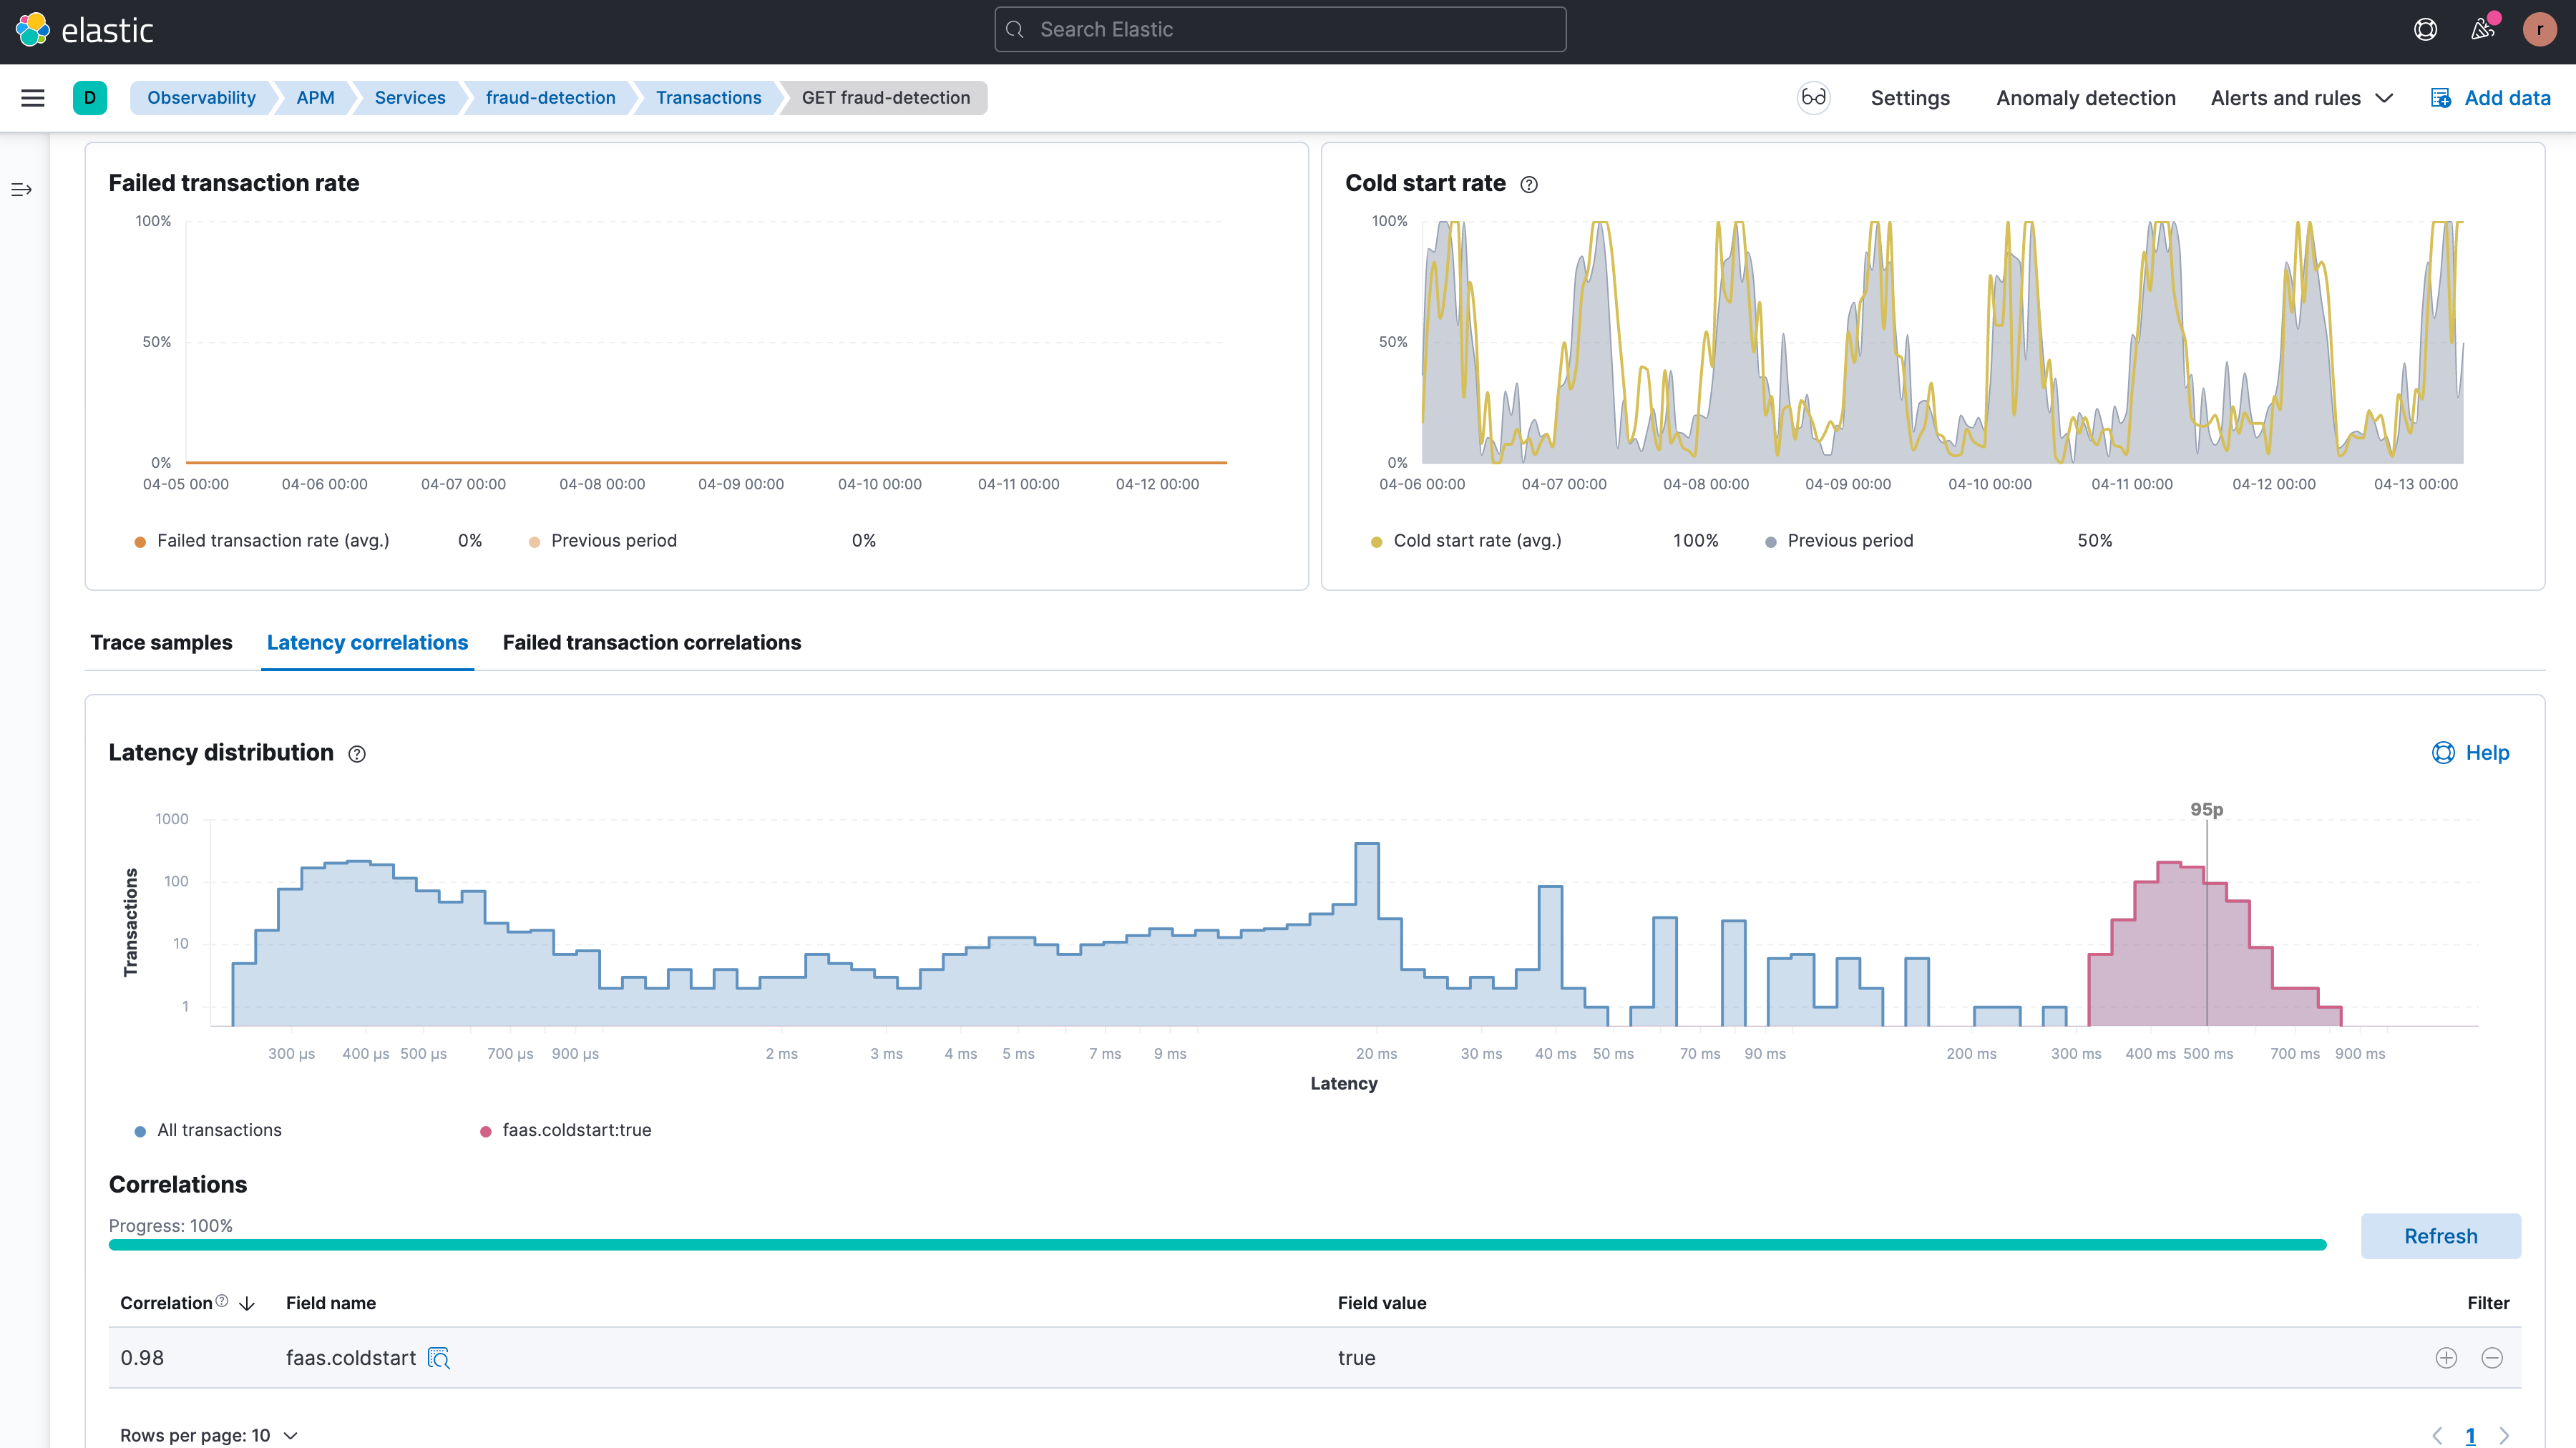
Identify slow-running AWS Lambda functions, cold starts, and failures by collecting data for each invocation. The logs and metrics generated by your serverless environment are integrated with your other telemetry data, delivering unified observability in a single platform.
Tap into your serverless environment
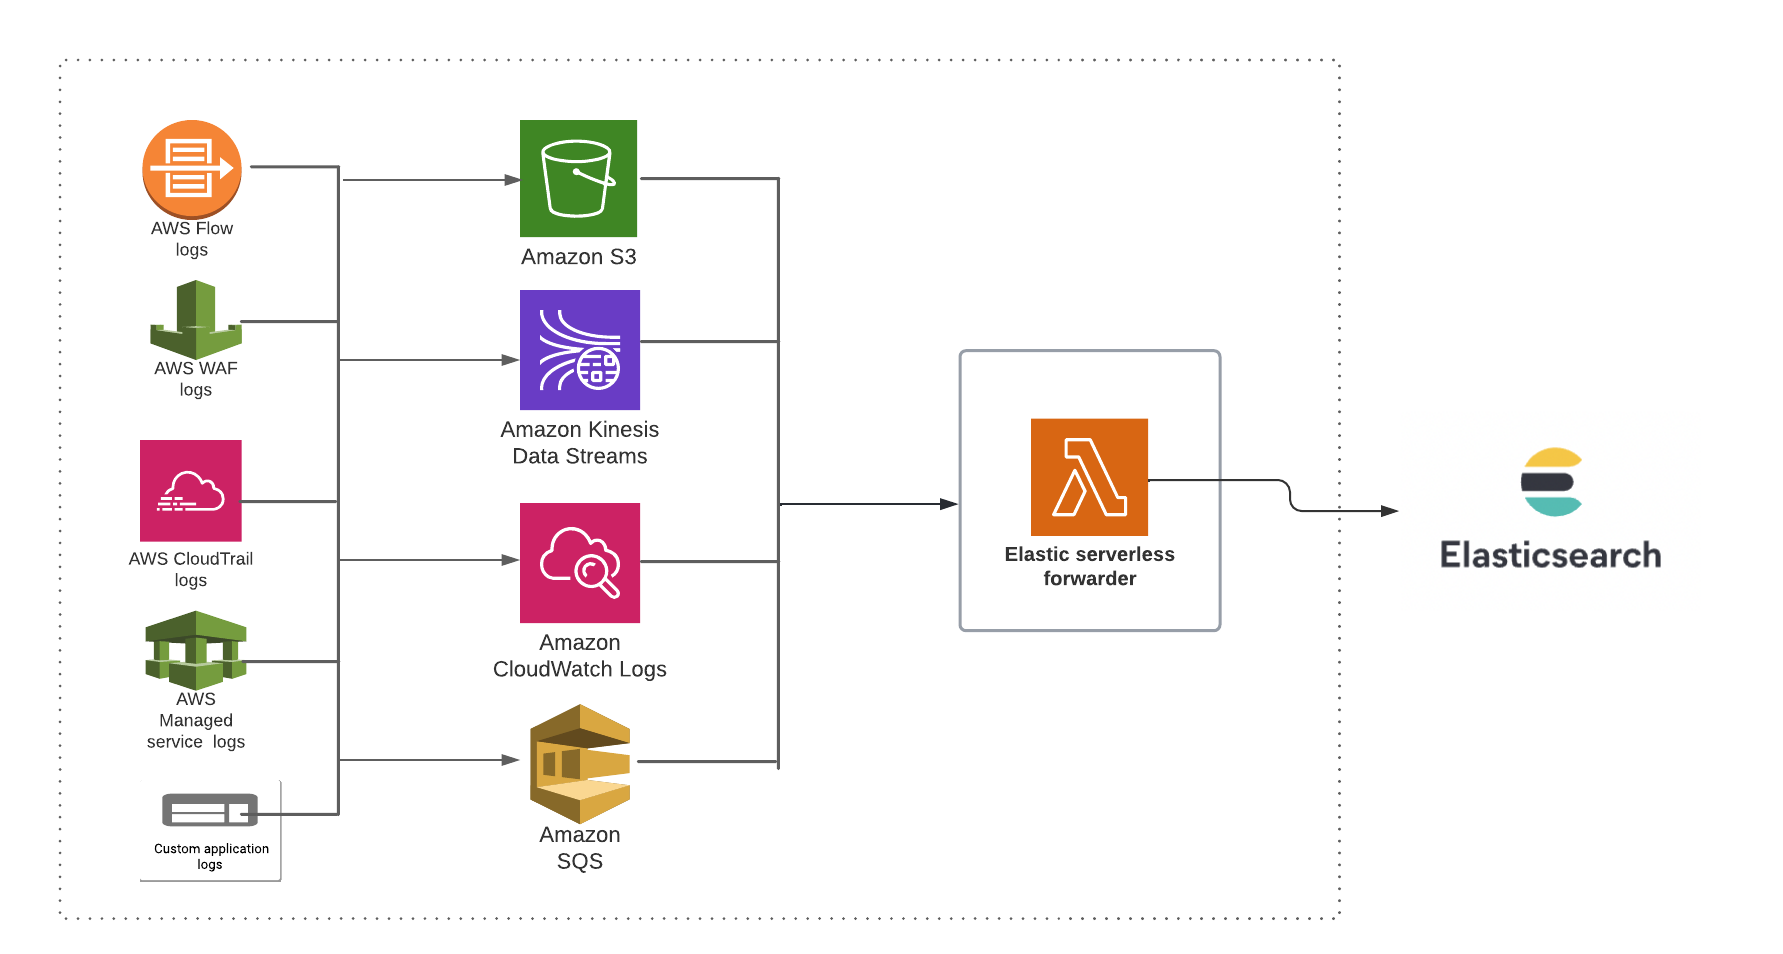
Gather logs and metrics directly from cloud messaging queues and streams to monitor and optimize your cloud deployments, even if your workflow is completely serverless. Implement event-driven processing to analyze and enrich streaming message queue data for easier troubleshooting.
Put your serverless functions on the map
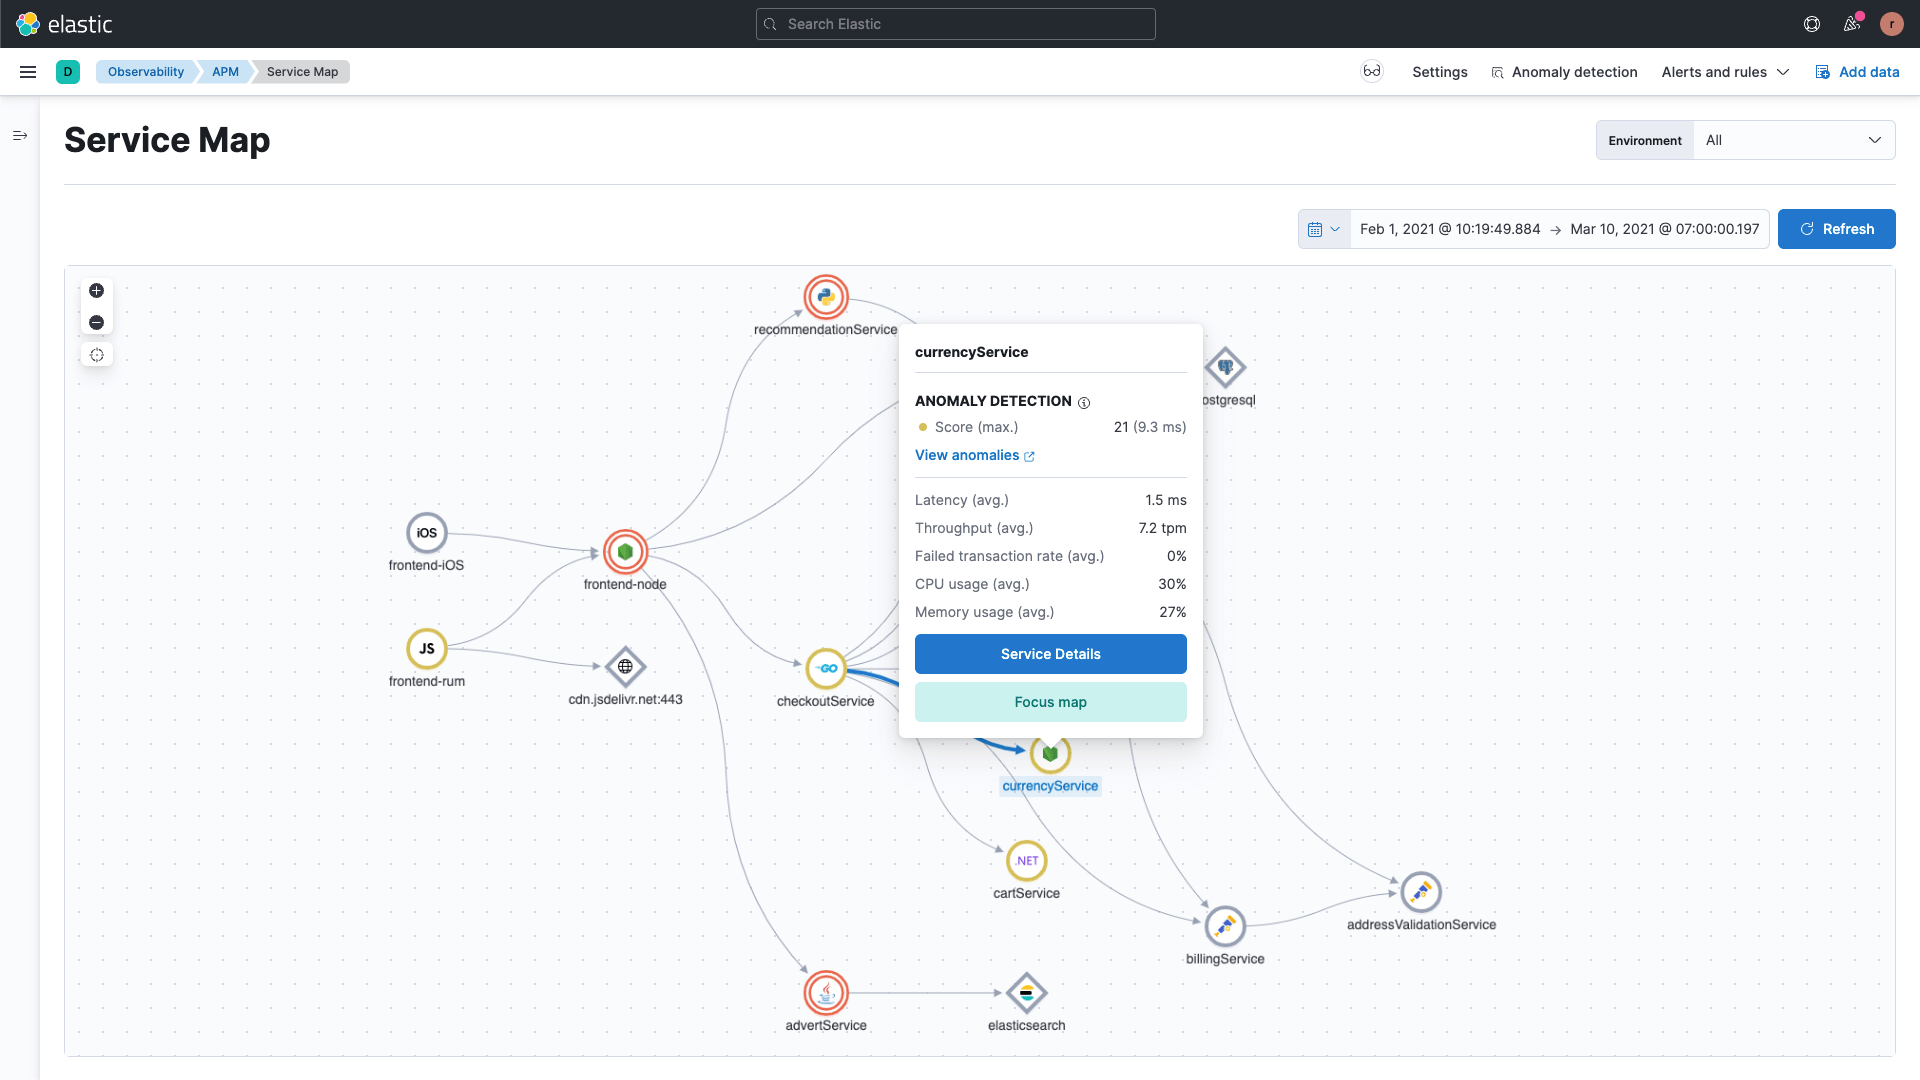
Serverless functions appear right on the service map, along with out-of-the-box, machine learning-powered health indicators. Understand the relationships between your serverless functions and other instrumented services, so you can visualize what is using them and what they are calling.
Drill down for a closer look
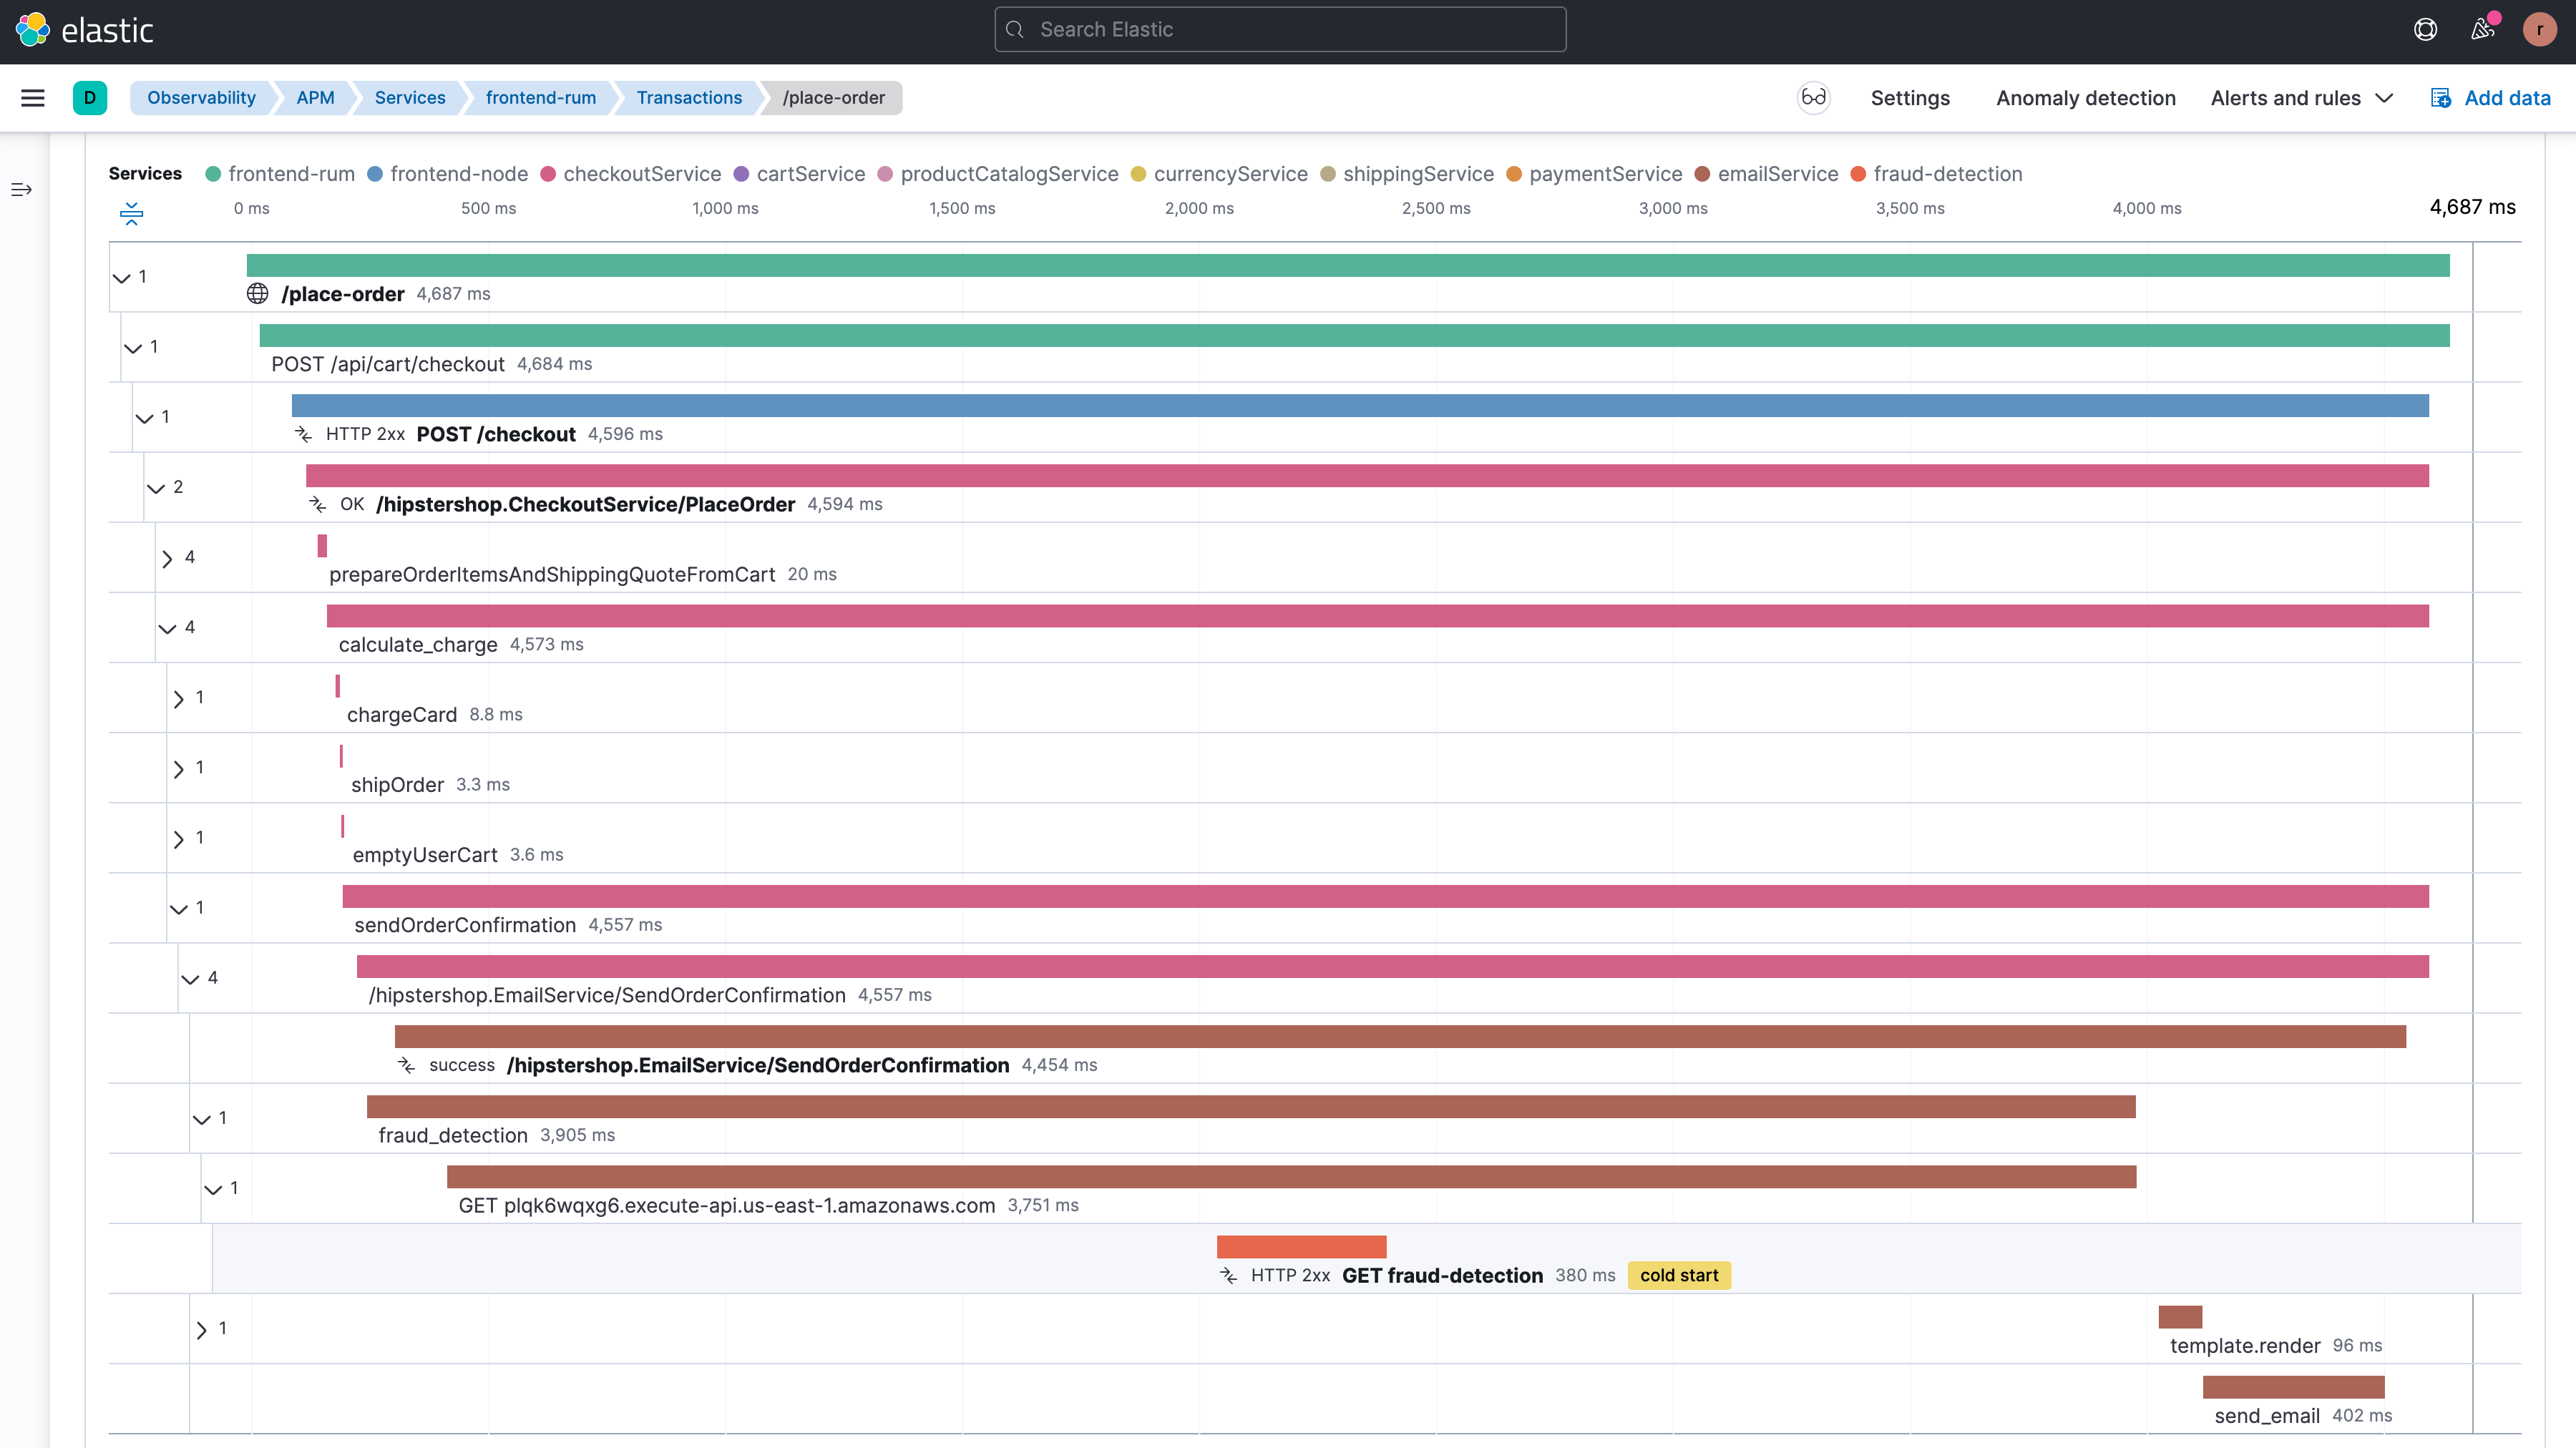
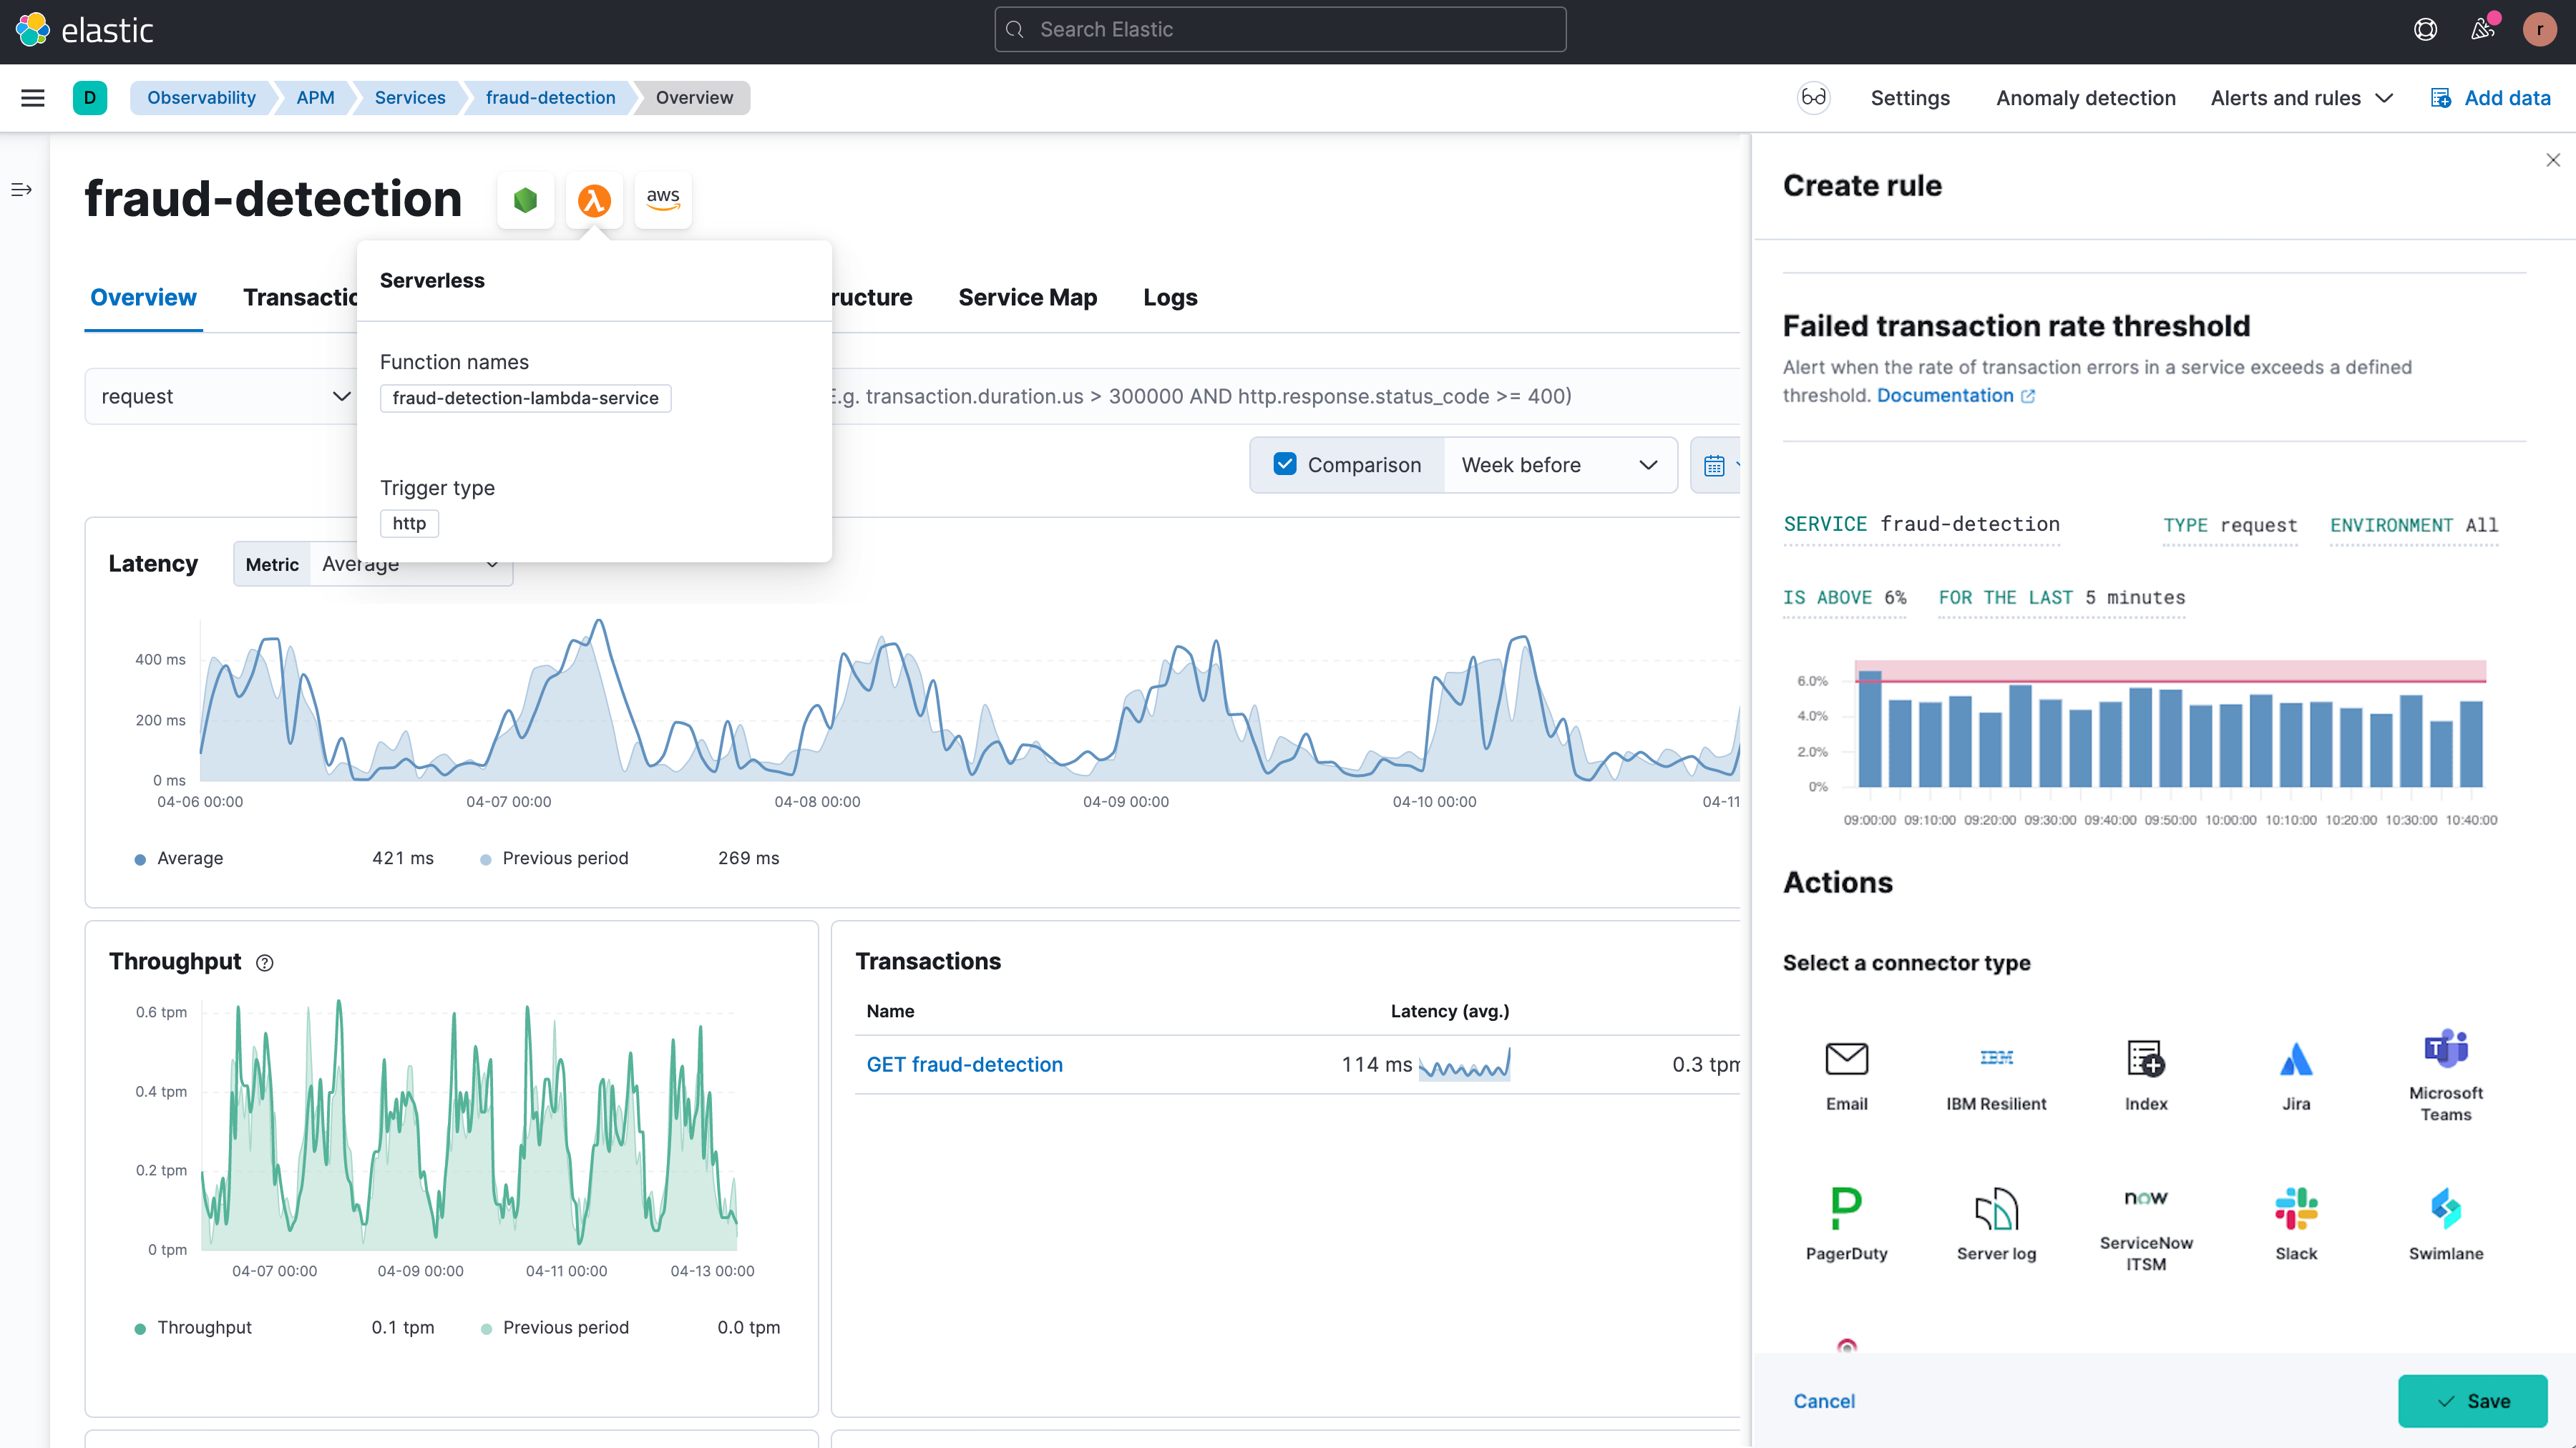
Instrument your serverless functions for tracing to see your serverless calls in context. Identify latency issues and cold starts along with any errors or exceptions, in context with your other services.
Leverage threshold or anomaly-based alerting
Identify and get alerted to issues with your serverless functions the same way as with your containerized code by leveraging the same detection and alerting mechanisms.
Analyze data in the serverless context
Slice, dice and correlate serverless metadata with other observability data. Filter by, compare, and analyze the impact of cold starts to optimize the configuration of your serverless functions and debug application performance issues.
End-to-end visibility for serverless applications
See the full picture of how serverless applications are performing in the cloud with Elastic Observability.