Elastic and AWS Serverless Application Repository (SAR): Speed time to actionable insights with frictionless log ingestion from Amazon S3

 Share on Twitter
Share on Twitter

 Share on LinkedIn
Share on LinkedIn

 Share on Facebook
Share on Facebook

 Share by Email
Share by Email

 Print this page
Print
As companies leverage the Amazon Web Services (AWS) cloud platform and services to drive operational efficiency and bring products to market, logs are often stored in Amazon Simple Storage Service (Amazon S3) then shipped to an external monitoring and analysis solution. Now AWS users can quickly ingest logs stored in Amazon S3 with the new Elastic serverless forwarder, an AWS Lambda application, and view them in the Elastic Stack alongside other logs and metrics for centralized analytics.
Skip lengthy processes like provisioning a VM or installing data shippers — and reduce management overhead by ingesting data directly from AWS to Elastic.
In this blog, we will teach you how to use the Elastic serverless forwarder — that is published in the AWS Serverless Application Repository (SAR ) — to simplify your architecture and send logs to Elastic, so you can monitor and safeguard your multi-cloud and on-premises environments.
Monitor the health and performance of your AWS environment
In an increasingly complex hybrid and multi-cloud ecosystem, it is no surprise observability continues to be a critical business initiative and the number one challenge for DevOps teams, according to research from the Enterprise Management Associates (EMA) group. As many organizations choose various technologies from containers to serverless computing to bring products to market faster and reduce overhead, it is important to note the need for an observability solution that covers all architectures. Teams that deploy a comprehensive observability solution are able to develop 70% faster and maintain increased product velocity with four times the number of features, according to EMA research.
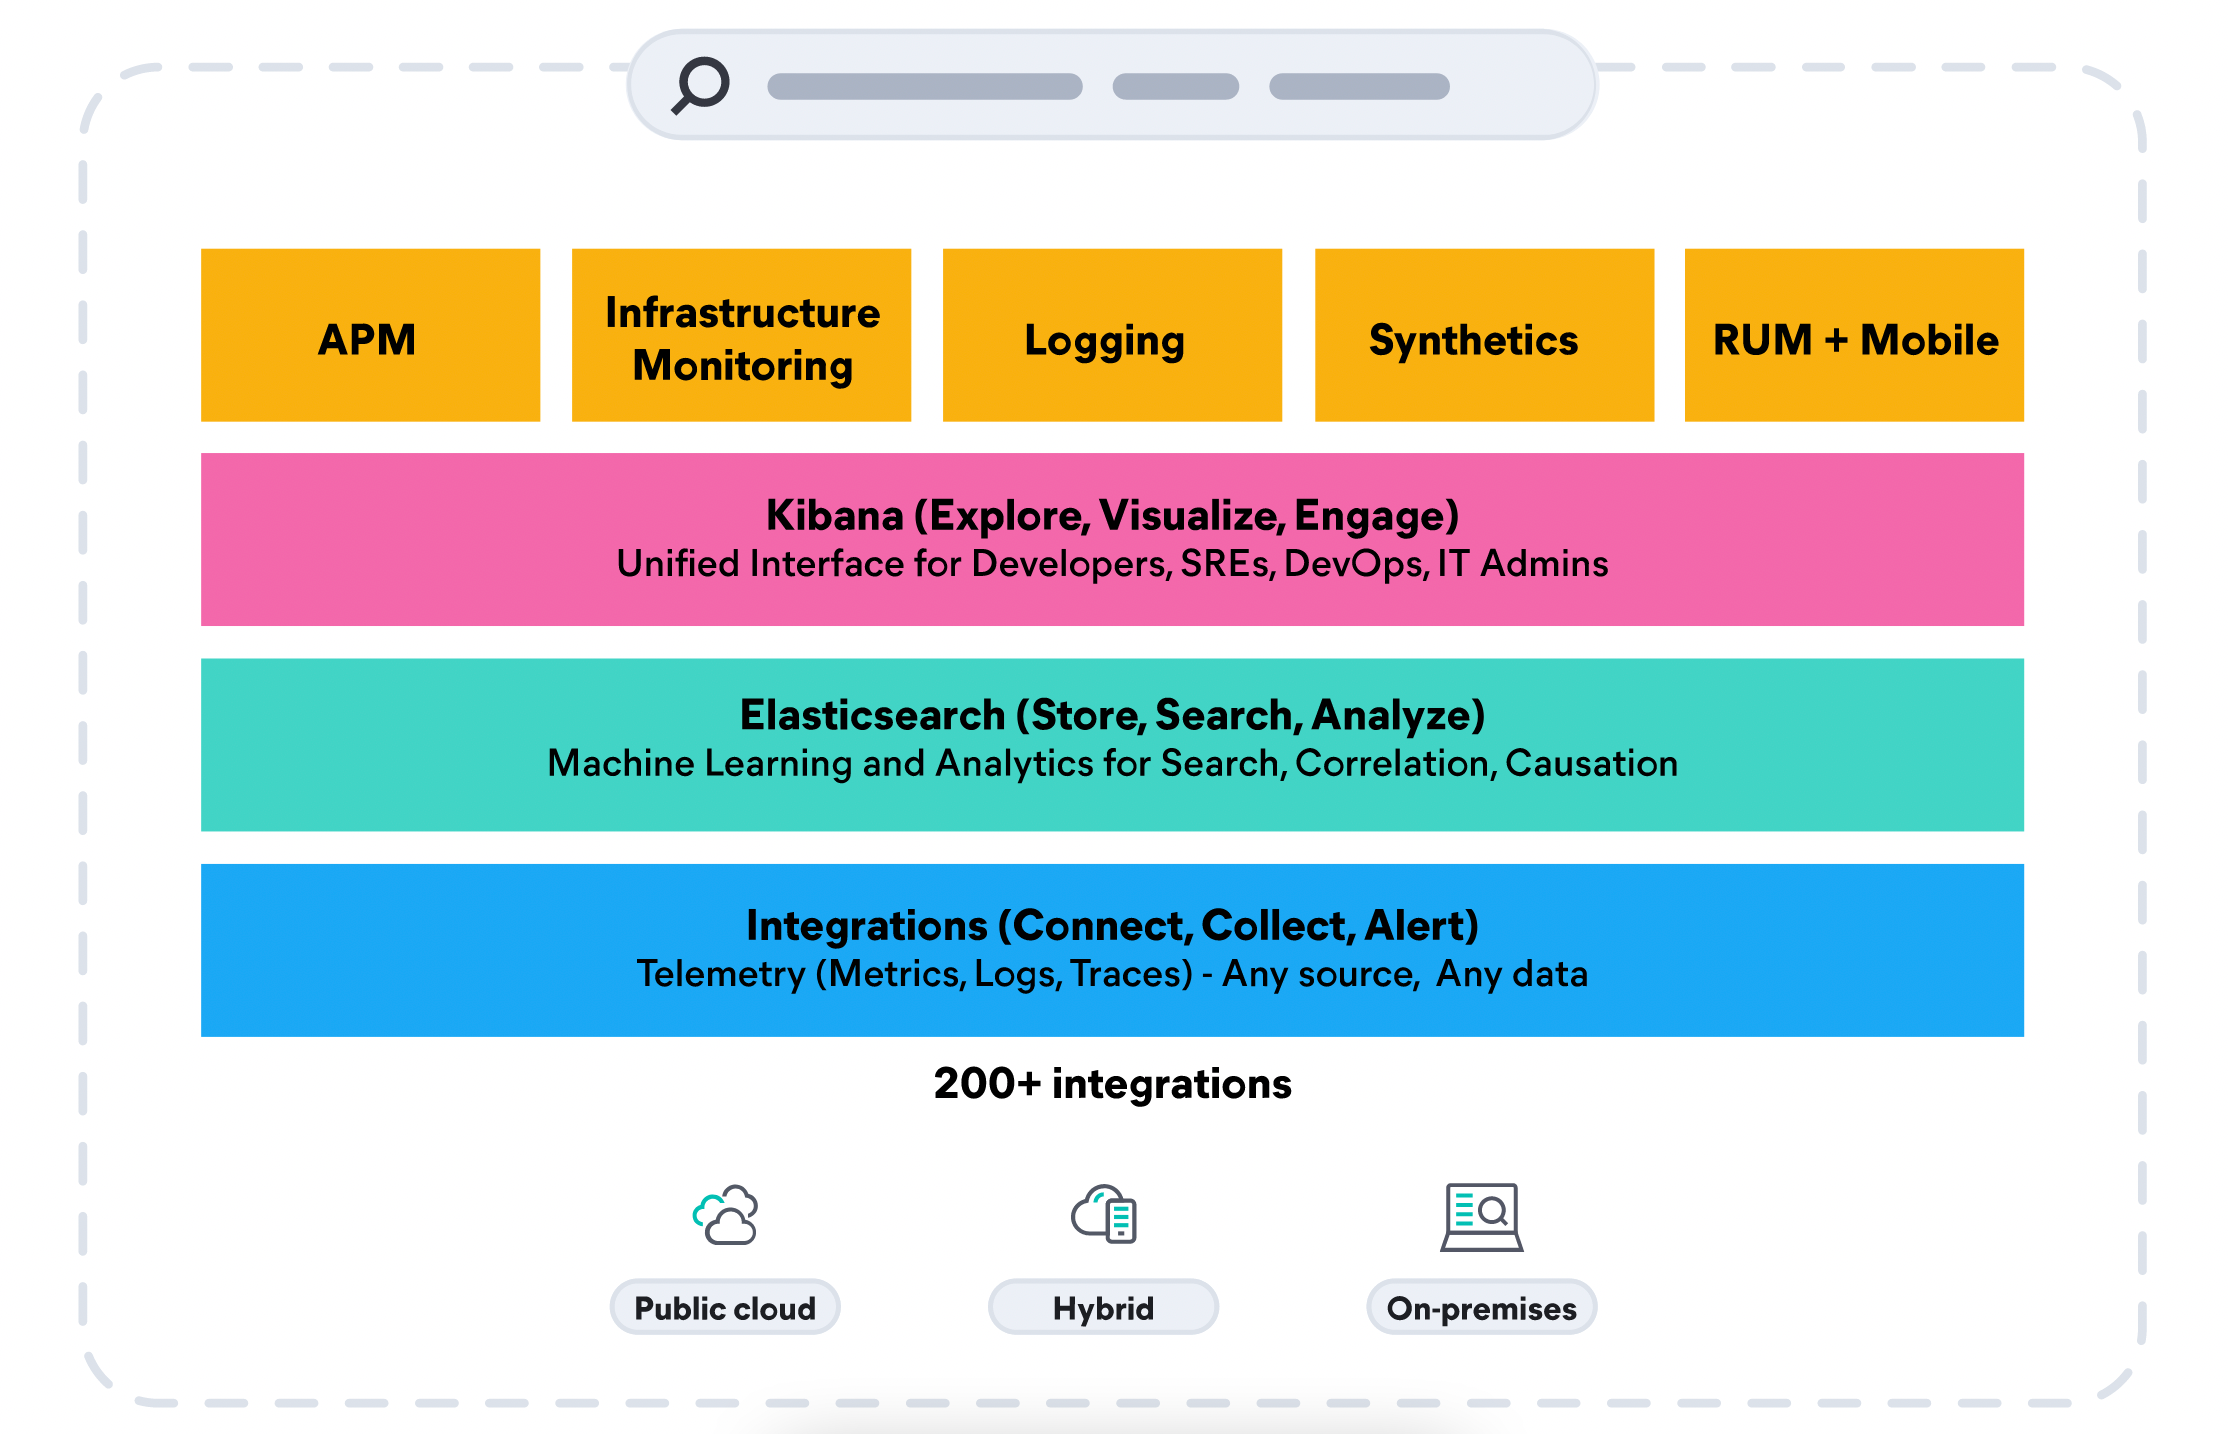
Elastic Observability unifies logs, metrics, and APM traces for a full contextual view across your hybrid AWS environments alongside their on-premises data sets —at scale— in a single stack. Track performance and monitor across a broad range of AWS services including AWS Lambda, Amazon Elastic Compute Cloud (EC2), Amazon Elastic Container Service (ECS), Amazon Elastic Kubernetes Service (EKS), Amazon S3, and more.
Equip security teams to stop threats quickly and at cloud scale
A commissioned Forrester study showed that customers achieved up to 75% cost savings using Elastic Security and Observability solutions together, and was up ten times faster than incumbent solutions. With the Elastic Common Schema and single repository architecture, the same observability data from Amazon S3 and other data sets can also be used for extended detection and response (XDR) to drive mean time to detection towards zero. Elastic Security brings together SIEM and endpoint security, allowing organizations to ingest and retain large volumes of data from diverse sources, store and search data for longer, and augment threat hunting with detections and machine learning. Eliminate data silos, reduce alert fatigue, and ready the organization to quickly stop threats across their environment.
Store data cost-effectively for fast retrieval and future analysis
There is another way to leverage your Amazon S3 for cost efficiency. In addition to ingesting logs stored in S3 to Elastic, Elastic also enables organizations to retain large amounts of historical data in low-cost object storage like Amazon S3 — while keeping it fully active and searchable. Keep AWS and on-premises data — at any granularity, for any length of time — and then scale as the data grows. Data management and tiering is automated through index lifecycle management and autoscaling capabilities, based on the organization’s data performance, resilience, and retention requirements.
Simplify data ingestion
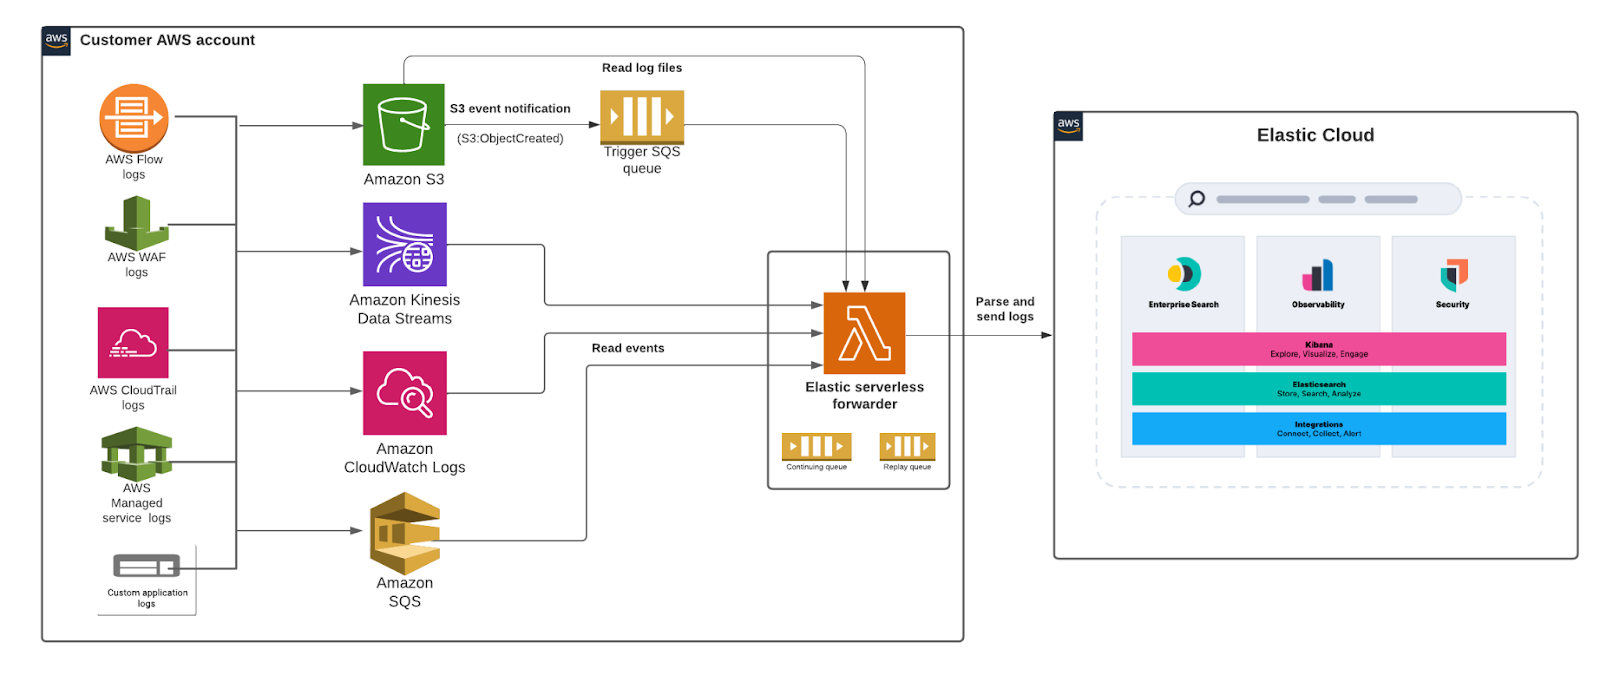
The Elastic serverless forwarder Lambda application supports ingesting logs contained in the Amazon S3 bucket and sends them to Elastic. The SQS queue event notification on Amazon S3 serves as a trigger for the Lambda function. When a new log file gets written to an Amazon S3 bucket and meets the criteria, a notification is generated that triggers the Lambda function.
Users can set up the SQS function trigger on their S3 bucket and provide Elastic connection information to let the logs flow and use the prebuilt dashboards and full analytics features of Kibana to bring logs data to life.
Architecture diagram:
Let’s get started
In this section, we’ll go into a step-by-step tutorial on how to get started with the Elastic serverless forwarder to analyze Amazon Virtual Private Cloud (Amazon VPC) Flow Logs in the Elastic Stack.
For more detailed instructions review the Elastic serverless forwarder documentation.
Ingesting Amazon VPC Flow Logs into Elastic enables you to monitor and analyze network traffic within your Amazon VPC and make more informed decisions by:
- Analyzing the flow log data in Kibana with the ability to quickly search, view, and filter logs
- Assessing security groups rules and uncover security gaps
- Setting alarms that alert you when certain traffic types are detected
- Identifying latency issues and establish baselines to ensure consistent performance
Before you begin
- If you are not already using Elastic, create a deployment using our hosted Elasticsearch Service on Elastic Cloud. The deployment includes an Elasticsearch cluster for storing and searching your data, and Kibana for visualizing and managing your data. For more information, see Spin up the Elastic Stack.
- Enable AWS VPC flow logs to be sent to an S3 bucket. If you don’t have that setup you can easily create an S3 bucket and send VPC flow logs to that bucket. The steps will essentially be:
- Create an S3 bucket (Example: vpc-flow-logs)
- On the EC2 console select specific network interfaces and from Actions menu “create flow log”. Select the destination as the S3 bucket you created in the previous steps. For more details, review the AWS documentation.
- Now, let’s create an SQS simple queue (Example: flow-logs-queue) and set up an appropriate access policy so that S3 event notifications from S3 are sent to the queue. On the S3 bucket (vpc-flow-logs) configure event notifications for all objects “create events” to be sent to the SQS queue (flow-logs-queue). For more details, review the AWS documentation.
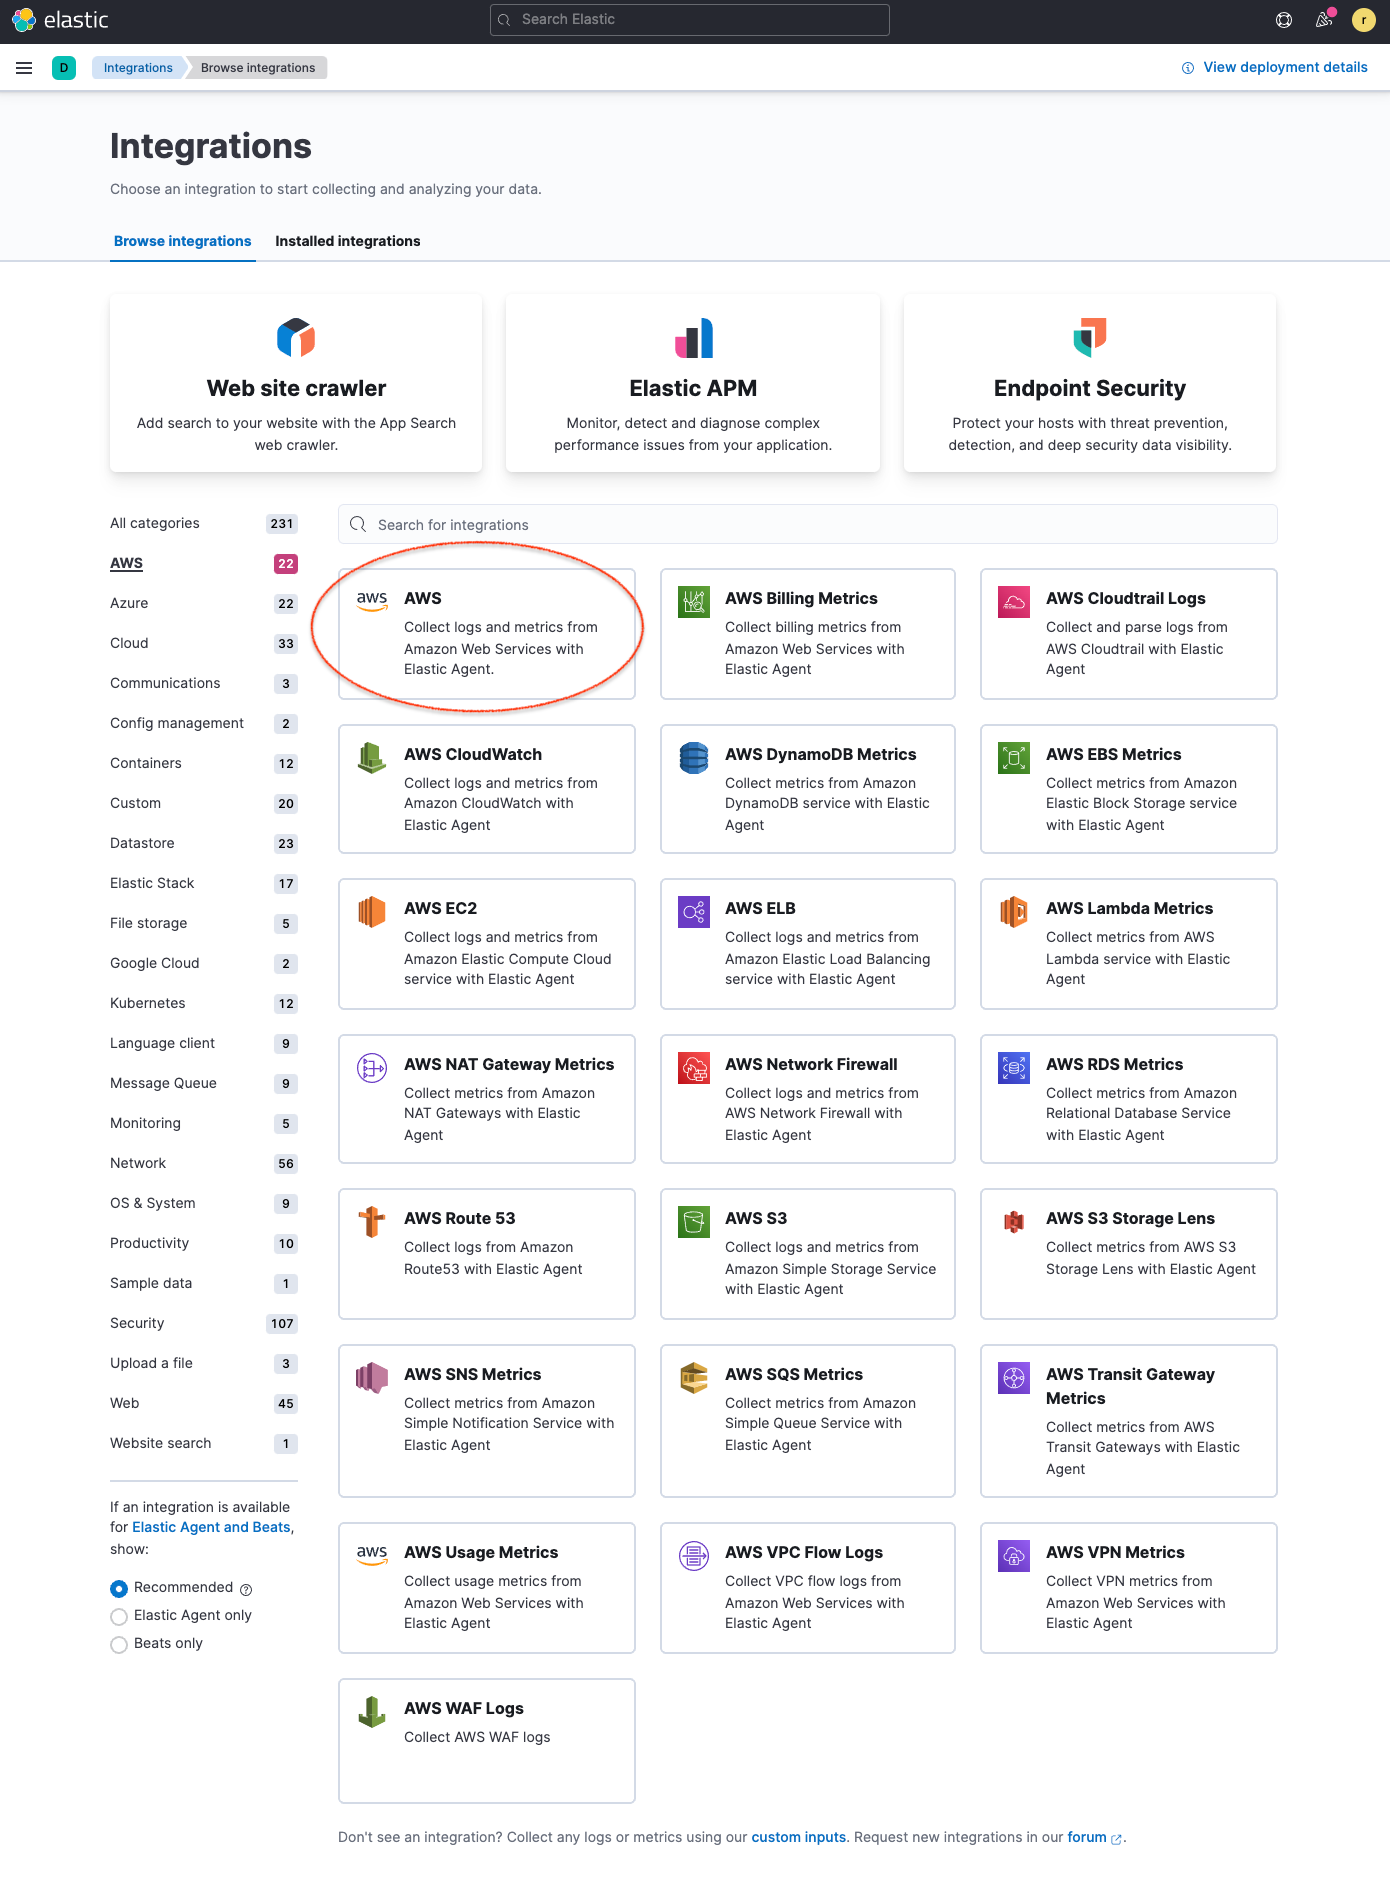
- Next, you’ll start with installing the Elastic AWS integration straight from the Kibana web UI, which contains prebuilt dashboards, ingest node configurations, and other assets that help you get the most value out of the logs you ingest.Go to Integrations in Kibana and search for AWS. Click the AWS integration to see more details, select Settings and click Install AWS assets to install all the AWS integration assets.
5. Next let’s create a new S3 bucket and a configuration file that elastic-serverless-forwarder will use to know the input source and the Elastic connection for destination information.
.png)
Here is a sample configuration file:
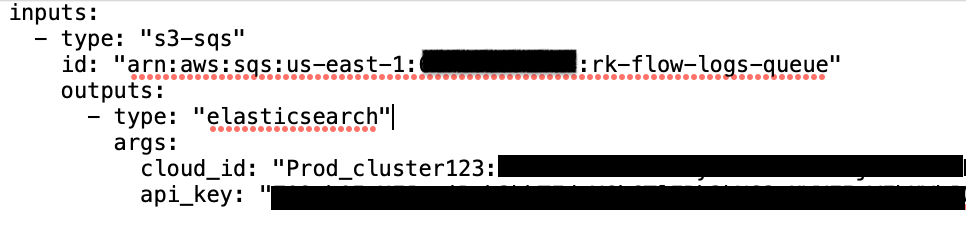
Go to Elastic Cloud and copy Cloud ID from the Elastic cloud console to specify in the parameter “cloud_id”. Navigate to Kibana and create a Base64 encoded API key for authentication and specify in the parameter “api_key”. You should store any sensitive values in AWS Secrets Manager and refer to it from the configuration file.
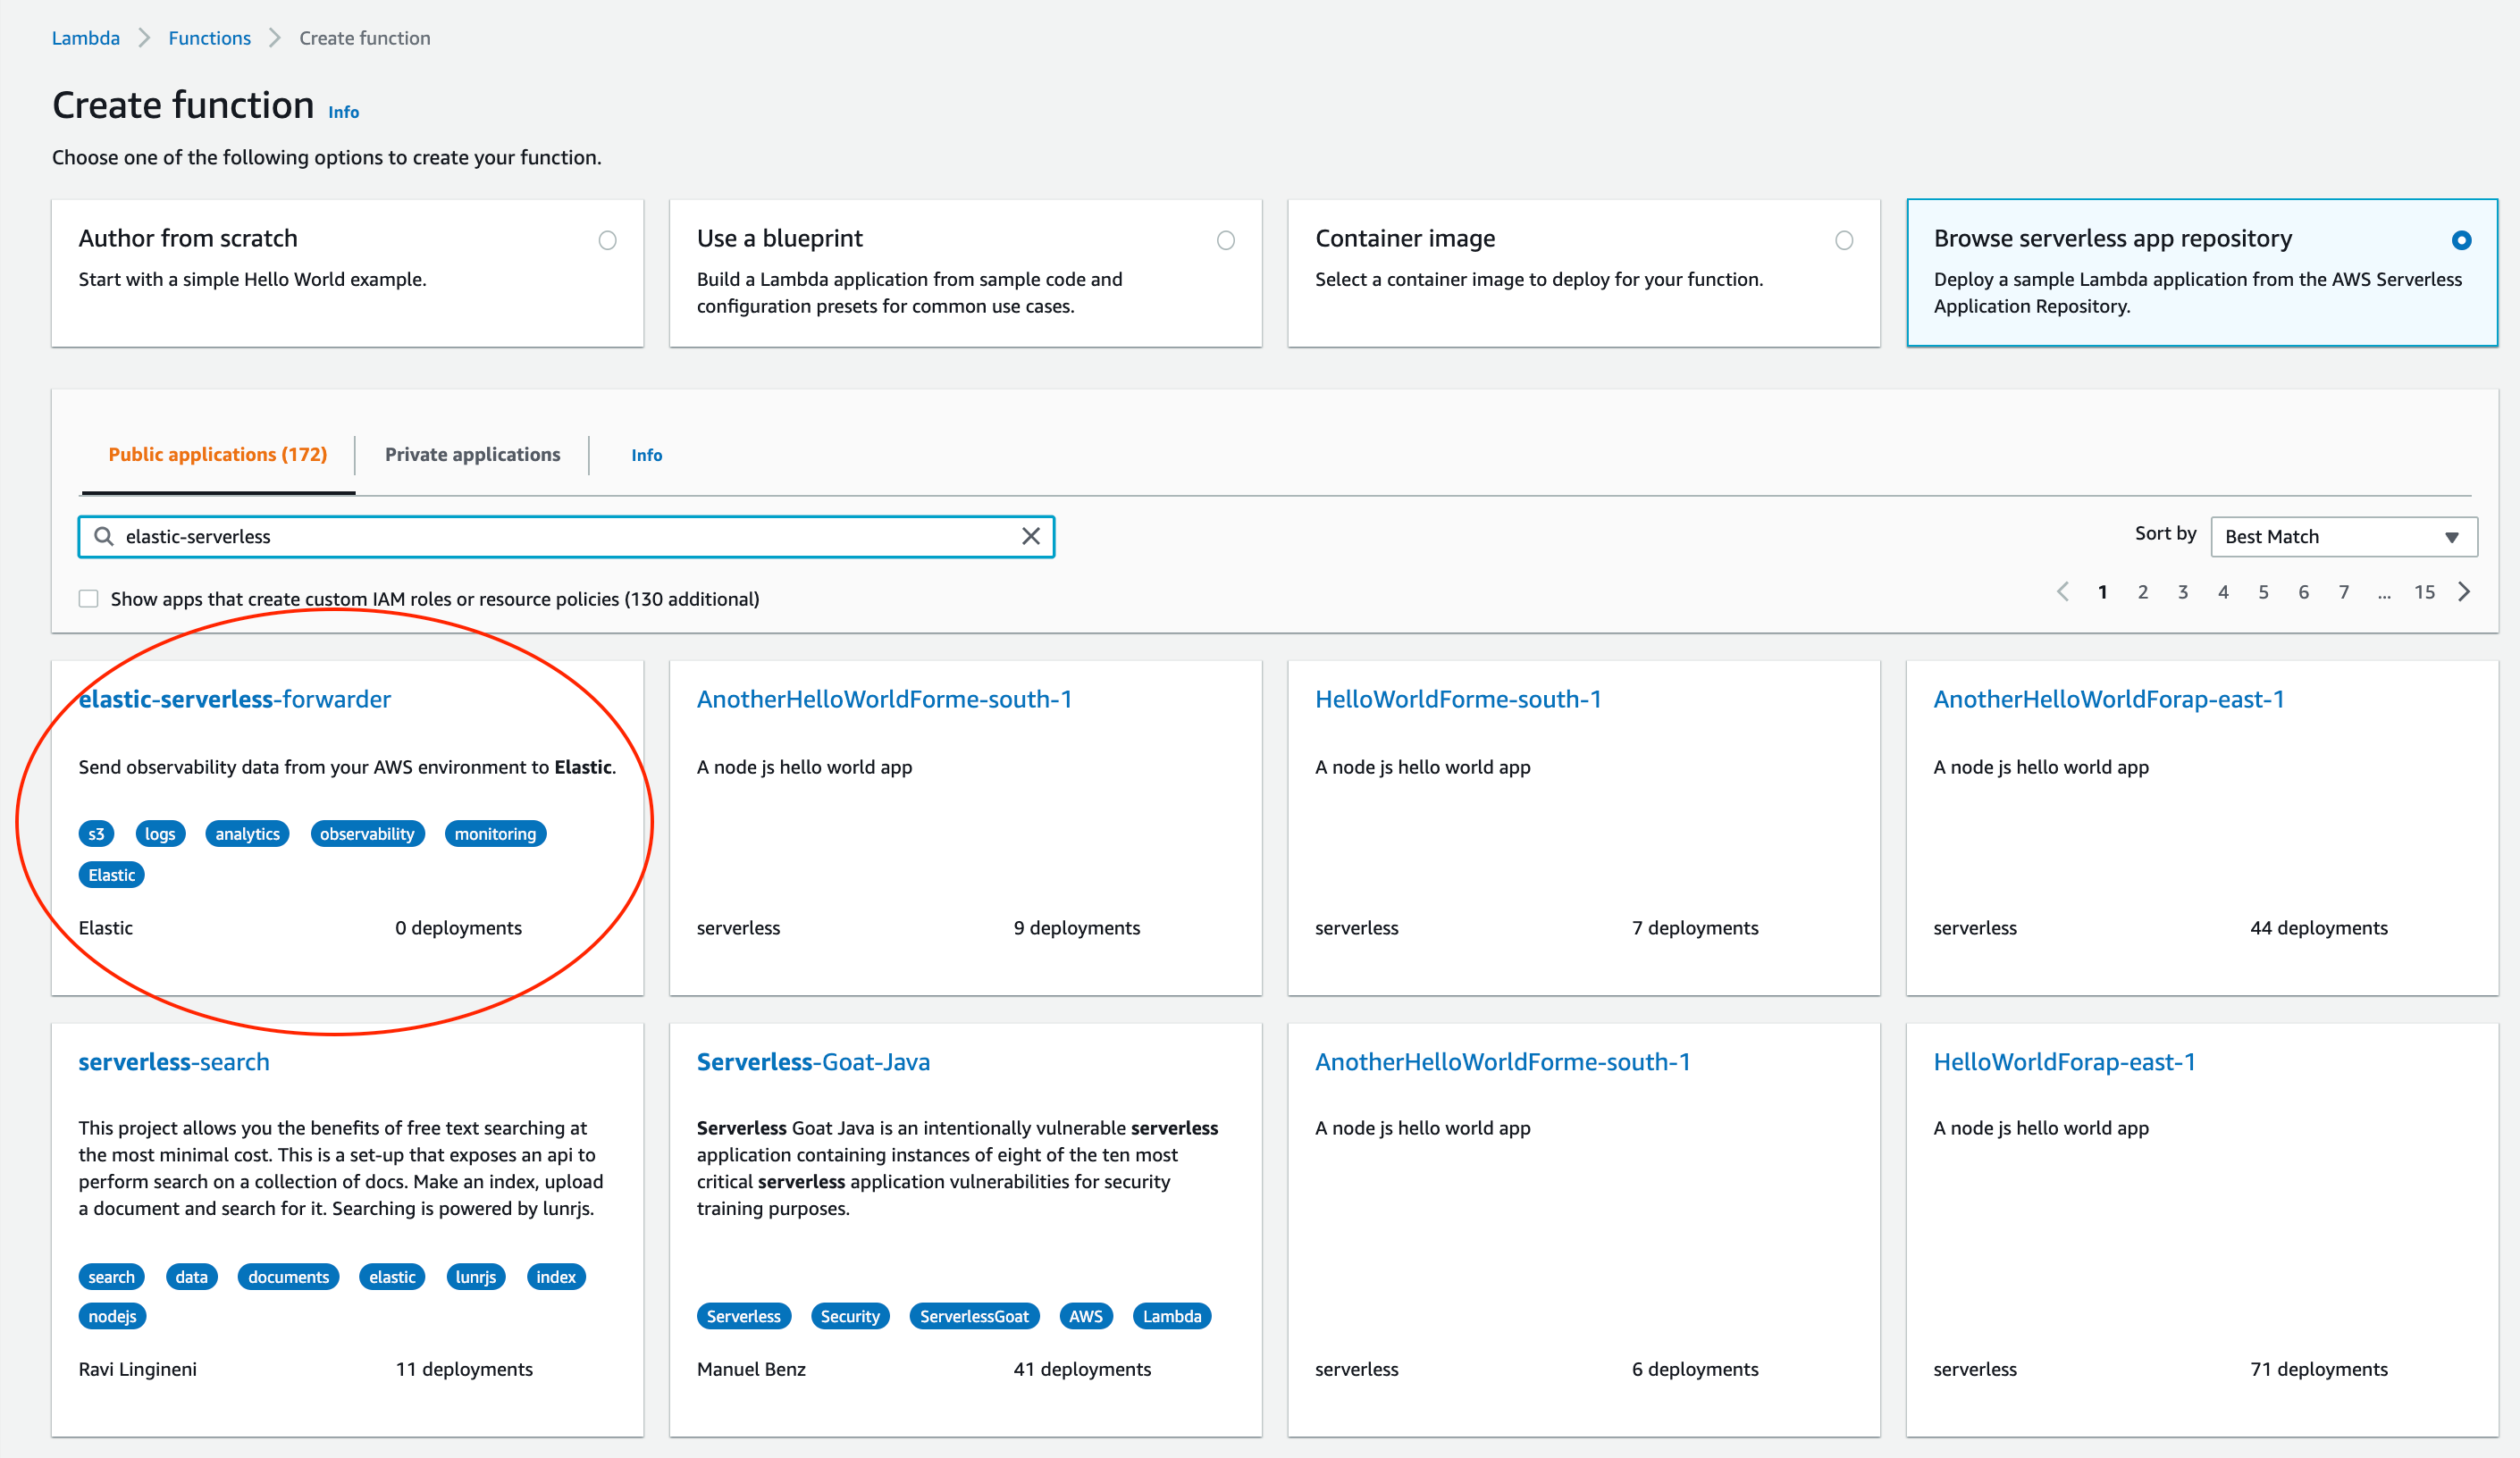
6. Deploy the elastic-serverless-forwarder from AWS SAR and provide appropriate configurations for the Lambda function to start ingesting VPC flow logs into Elastic.
From the Lambda console select Functions->Create a function, select Browse serverless app repository and search for elastic-serverless-forwarder, Select the application.
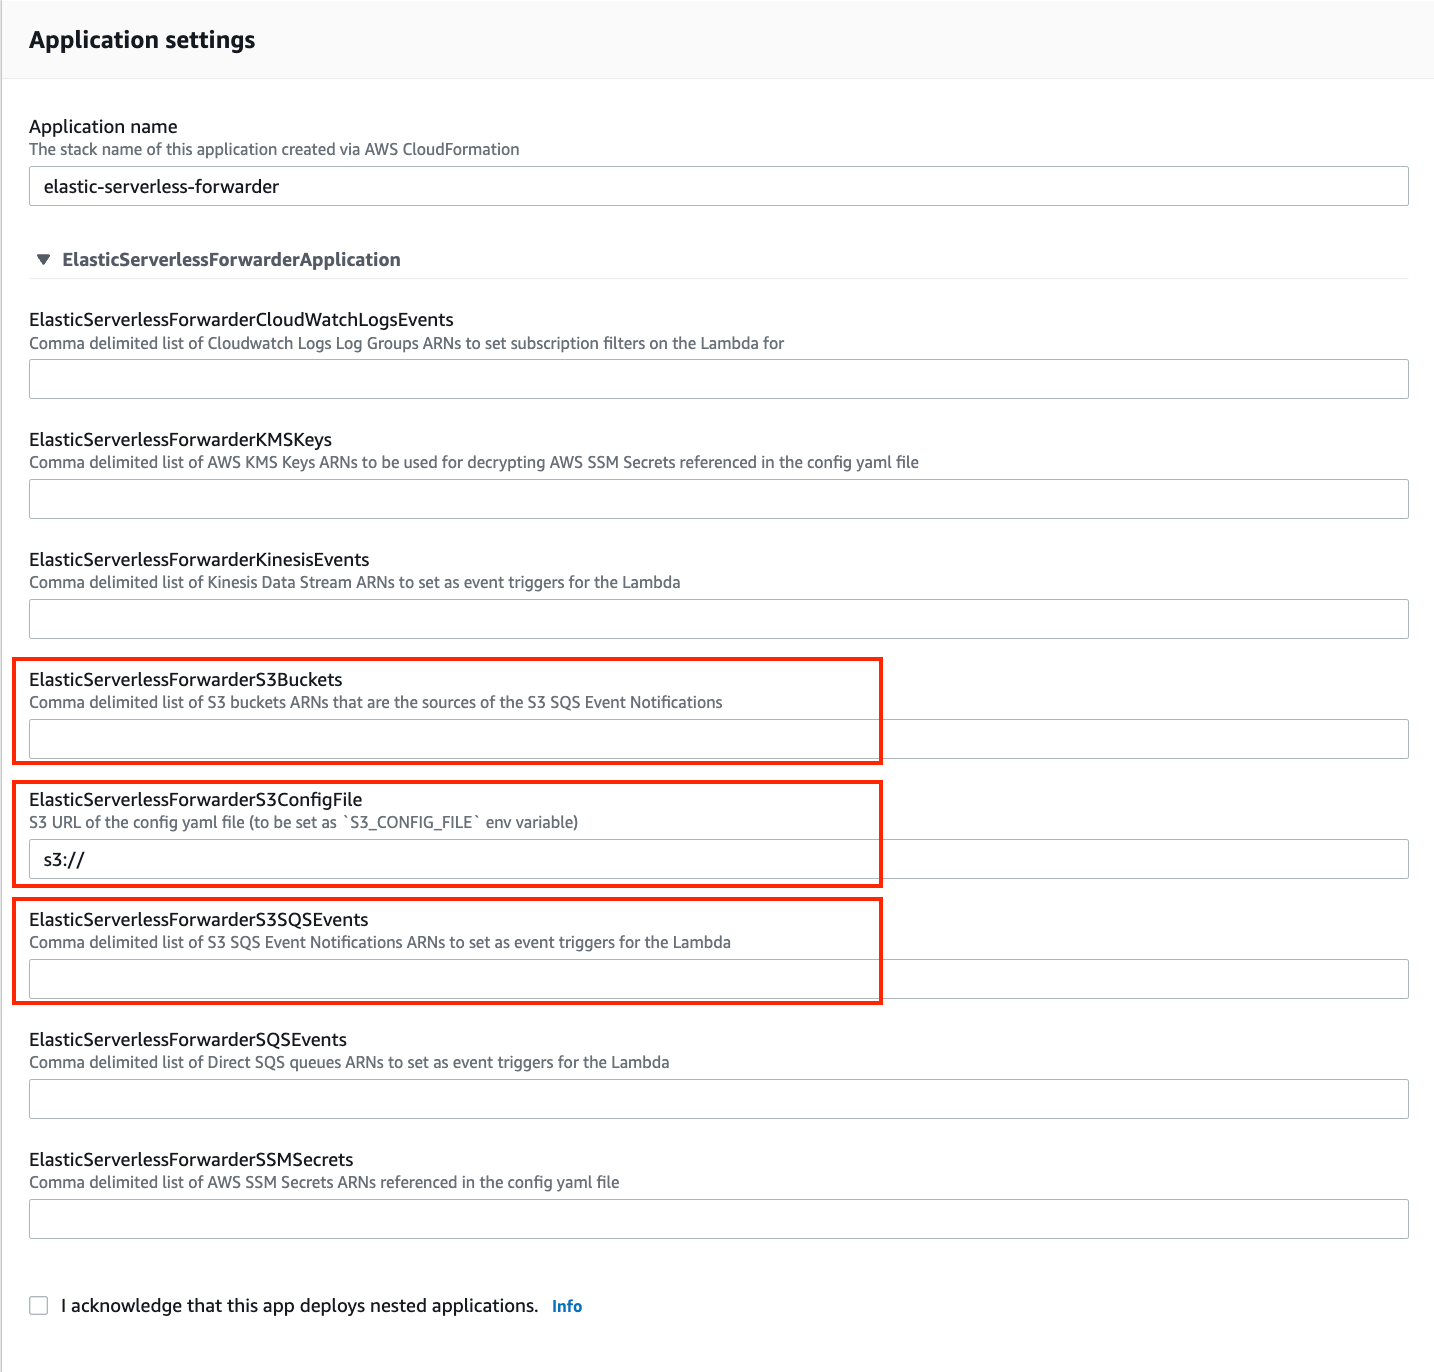
Once in the Review, configure and deploypage of the application, fill the following fields:
- Specify the S3 Bucket in ElasticServerlessForwarderS3Buckets where the VPC Flow Logs are being sent. The value is the ARN of the S3 Bucket you created on step 2.
- Specify the configuration file path in ElasticServerlessForwarderS3ConfigFile. The value is the S3 url in the format "s3://bucket-name/config-file-name" pointing to the configuration file (sarconfig.yaml) that you created in step 5.
- Specify the S3 SQS Notifications queue used as the trigger of the Lambda function in ElasticServerlessForwarderS3SQSEvents. The value is the ARN of the SQS Queue you created on step 3.
The above values are used by the Lambda deployment to create minimal IAM policies and set up the environment variables for the Lambda function to execute properly.
The deployed Lambda will read the VPC flow log files as they get written to the S3 bucket and send it to Elastic.
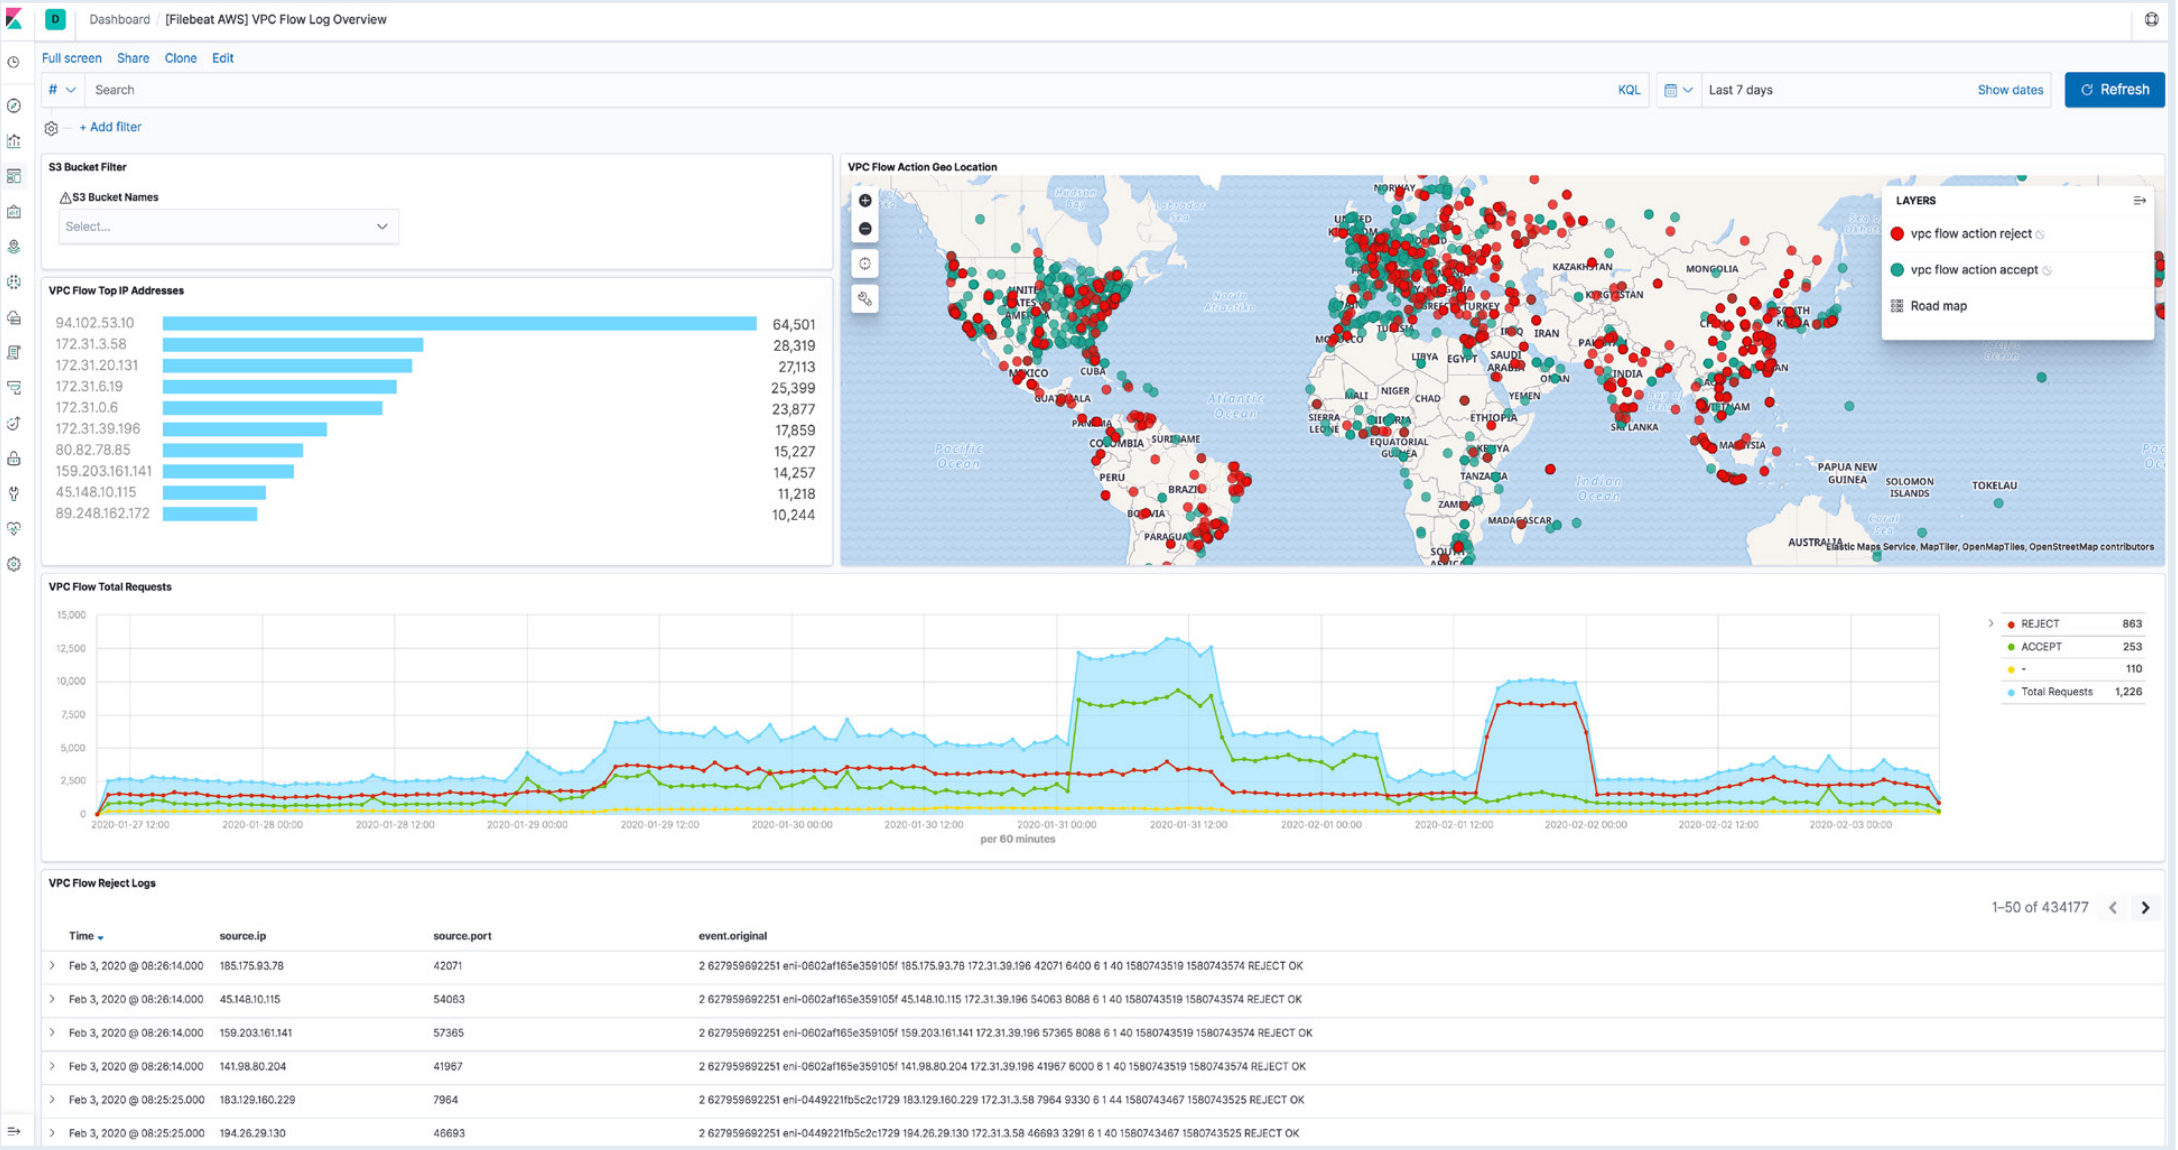
7. Navigate to Kibana to see your logs parsed and visualized in the [Logs AWS] VPC Flow Log Overview dashboard.
Wrapping up
Elastic is constantly delivering frictionless customer experiences, allowing anytime, anywhere access — and this streamlined integration with AWS is the latest example of that. For more information visit the elastic-serverless-forwarder documentation or download the Elastic Observability guide for AWS.
Start a free trial today
Start your own 7-day free trial by signing up via AWS Marketplace and quickly spin up a deployment in minutes on any of the Elastic Cloud regions on AWS around the world. Your AWS Marketplace purchase of Elastic will be included in your monthly consolidated billing statement and will draw against your committed spend with AWS.
The release and timing of any features or functionality described in this post remain at Elastic's sole discretion. Any features or functionality not currently available may not be delivered on time or at all.
Share
- Share on Twitter
Share on Twitter
- Share on LinkedIn
Share on LinkedIn
- Share on Facebook
Share on Facebook
- Share by Email
Share by Email
- Print this page
Print