KubeCon 2019: Elastic Doubles Down on Observability and Orchestration for Kubernetes
As users adopt Kubernetes, Elastic products move fast to support their evolving needs. Whether you are trying to run Elasticsearch workloads to Kubernetes or want to gain better visibility into container workloads running across different environments, we are doubling down on building cloud native tools to support these efforts.
This blog covers recent advancements to support Kubernetes initiatives:
- Elastic Observability for Kubernetes, including integration with Prometheus and Jaeger
- Elastic Cloud for Kubernetes (ECK) — the best way to run and orchestrate Elasticsearch on Kubernetes
- Elastic Security for Kubernetes, including Elastic SIEM and Endpoint
For additional details on these topics, read on, or see a walkthrough in the Kubernetes and Elastic: From operation to observability webinar.
Elastic Observability for Kubernetes
For over two years, Elastic has invested in engineering the best monitoring experience for containerized environments with a particular focus on Kubernetes. Our efforts are aimed to address common challenges we’ve seen with observing Kubernetes workloads:
- Separate data silos for logs, metrics, and APM
- Poor options for bridging visibility in hybrid environments
- Pricing models incompatible with increasingly dynamic environments
When adopting cloud native initiatives, organizations still end up with separate data silos for logs, metrics, and APM data. Challenges correlating across these data silos are even more pronounced in increasingly dynamic environments. Elastic’s answer to this challenge is an open and flexible data layer for logs, metrics, and traces, where each data type is just another index in Elasticsearch, tied together using Elastic Common Schema. Under the covers, we optimize storage and retention per data type, but we don't limit what you can ultimately do with the data (such as perform high cardinality queries on top of container labels). Kibana provides a single user interface for curated observability workflows as well as ad hoc data visualizations of this data.
Users adopting cloud native tools embark on a journey, often committing to a multi-year transformation of their business and operations. During this time, teams responsible for observability across enterprise applications must find ways to unify visibility across hybrid environments, comprised of traditional on-prem workloads, public cloud workloads, and workloads orchestrated by Kubernetes. Traditional approaches force users to centralize all telemetry in a single place, which is both fragile and costly. Elastic’s answer is to keep the telemetry local to the workloads by offering flexible deployment models across on-prem deployments, private and public cloud providers, then unifying visibility across environments using the cross-cluster search feature of Elasticsearch.
The final challenge teams struggle with is the cost of observability initiatives, based on traditional pricing models that charge per-ingest on logging workloads, per-host on metrics workloads, and per-agent on APM workloads. These pricing models are punitive, especially in the context of increasingly modular and dynamic Kubernetes workloads. Elastic’s resource-based pricing model scales with resources you use to store and search telemetry. We put the user in control, removing artificial barriers to adoption. If granular observability data is valuable, store it and search it for as long as you like. If the data stops being valuable, roll it up or archive it, using index lifecycle management policies. You can apply these policies per-tenant, so you do not need to have a “one size fits all” answer for your applications.
Recent product announcements for Kubernetes Observability
Elastic has been investing heavily in helping users monitor logs, metrics, and application traces in Kubernetes. This includes out-of-the-box monitoring solutions for core Kubernetes primitives such as kube-state-metrics, controller manager, and kube-proxy, as well as CNCF landscape projects — CNCF graduated (CoreDNS and Envoy) and CNCF incubating (NATS and etcd) alike. Additionally, Elastic APM supports OpenTracing, and we are in close collaboration with OpenTelemetry working group aimed to further evolve open standards-based approaches to instrumenting applications.
At KubeCon North American 2019, we are excited to share several new advancements in Elastic Observability:
- Elastic Metrics for Prometheus
- Elastic APM for Jaeger
- Elastic Uptime for Kubernetes
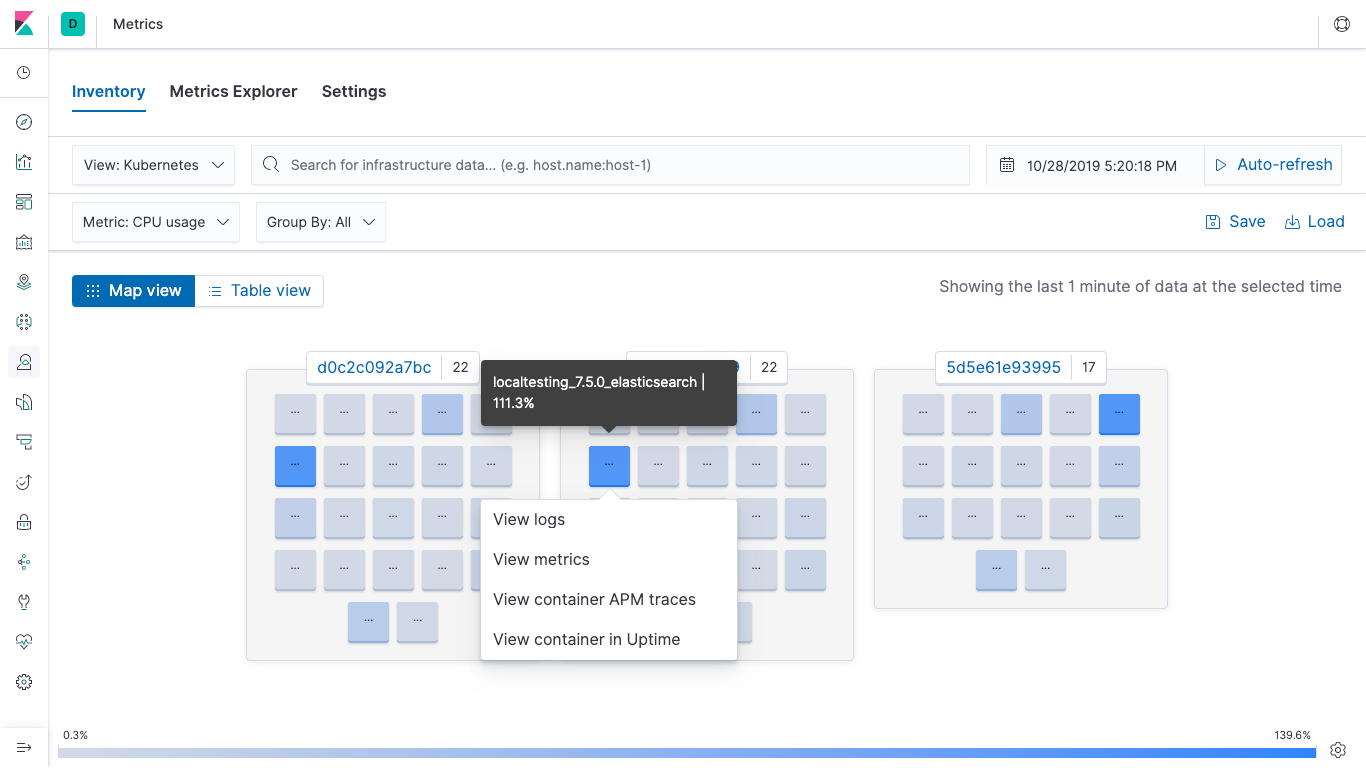
Elastic users have many options to ingest data from Kubernetes environments, including both Elastic native tools and cloud native tools. For many years, users have had their pick of using either FIlebeat or Fluentd for ingesting logs into Elasticsearch. Earlier this year, we announced Elastic Metrics for Prometheus, which allows users to directly query metrics from Prometheus exporters and servers and combine them with logs and traces in Elasticsearch. Throughout the year, we continued to evolve this integration based on feedback from many users, including customers like eBay and Nine Entertainment, which run Elastic for their Kubernetes observability needs at scale.
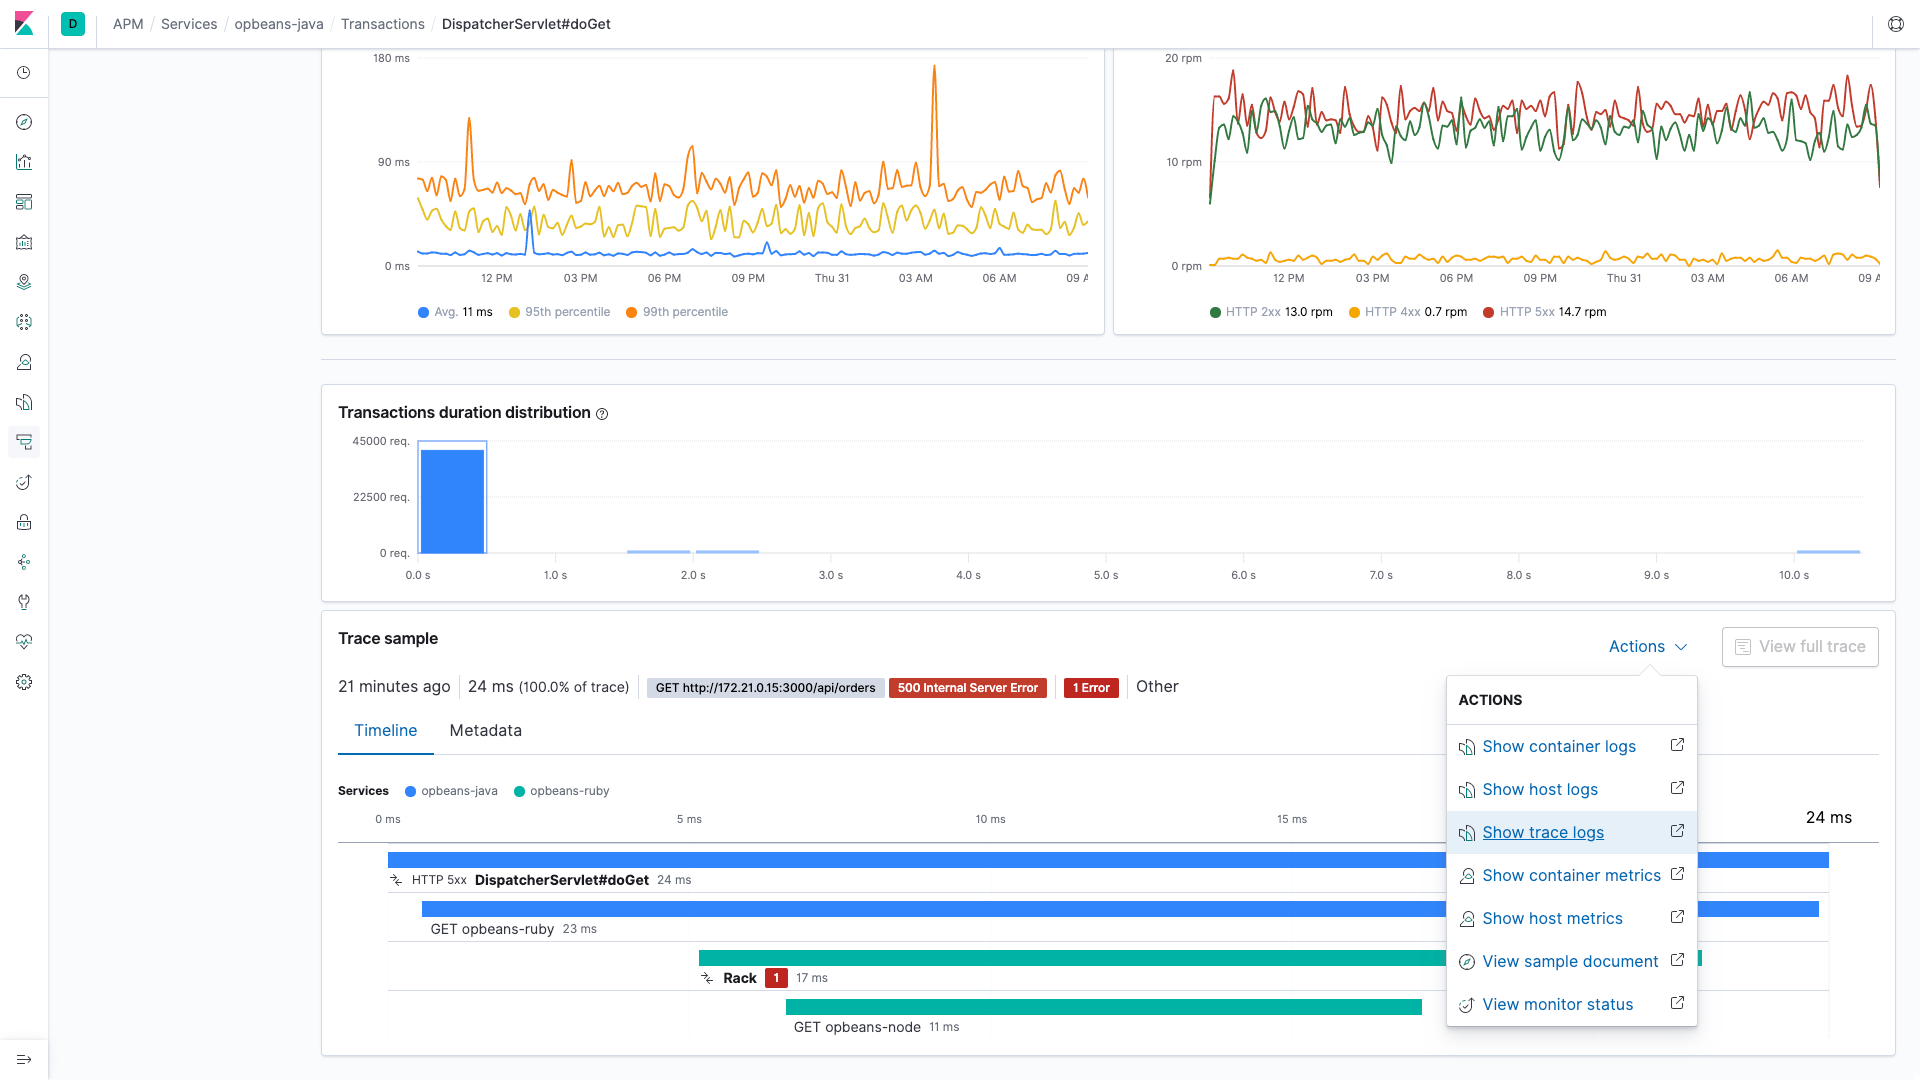
When it comes to Jaeger, Elasticsearch is already a popular backend store for Jaeger traces. This year, we are happy to announce that with the Jaeger graduation announcement, we are announcing an initiative around tighter integration between Jaeger and Elastic APM. The goal of this integration is to enable users adopting Jaeger to ingest Jaeger traces into Elasticsearch in a schema compatible with Elastic APM, allowing them to visualize Jaeger traces directly in the Elastic APM UI.
Finally, cloud-native environments and endpoints aren't static — containers are created, scaled, moved, and destroyed. Elastic Uptime, combined with the recent addition of Docker and Kubernetes hints-based autodiscovery in Heartbeat allows users to effectively monitor network and web endpoints and service APIs for availability and correctness and combine these synthetic checks with real user data behind a single pane of glass.
From observing to operating and orchestrating
Observability is only part of Elastic's Kubernetes story. Elastic joined CNCF last year and introduced Elasticsearch Helm Charts to simplify the experience of deploying Elasticsearch on Kubernetes. We continued these efforts with the release of Elastic Cloud on Kubernetes (ECK), the official Elasticsearch Operator. ECK gives users full-lifecycle control when running and managing Elasticsearch on Kubernetes, including orchestration for upgrades and high-availability.
As Michael Lorant, Principal Systems Engineer at Nine Publishing pointed out in his Elastic{ON} presentation, orchestrating complex technology stacks is hard. You have to weigh in the right mix of price versus performance, while balancing simplicity and automation. ECK brings this simplicity and power to a reality and is available for download today.
To hear more about Elastic’s innovation in orchestrating complex solutions in Kubernetes, you can attend the KubeCon talk, "Writing a Kubernetes Operator: the Hard Parts", presented by Sebastien Guilloux, a Senior Software Engineer at Elastic, on Wednesday, November 20, 2019 at 3:20pm.
The best part of Elastic Cloud for Kubernetes is that every ECK deployment of Elasticsearch includes full access to Elastic’s complete suite of Basic (and free) features. This includes our curated observability applications in Kibana — purpose-built applications for viewing Logs, Metrics, and APM traces, along with the Uptime app — but also includes core Elastic security features, such as authentication, role-based access control, encrypted communications between nodes and agents, API key management, and Kibana Spaces.
To protect and (ob)serve
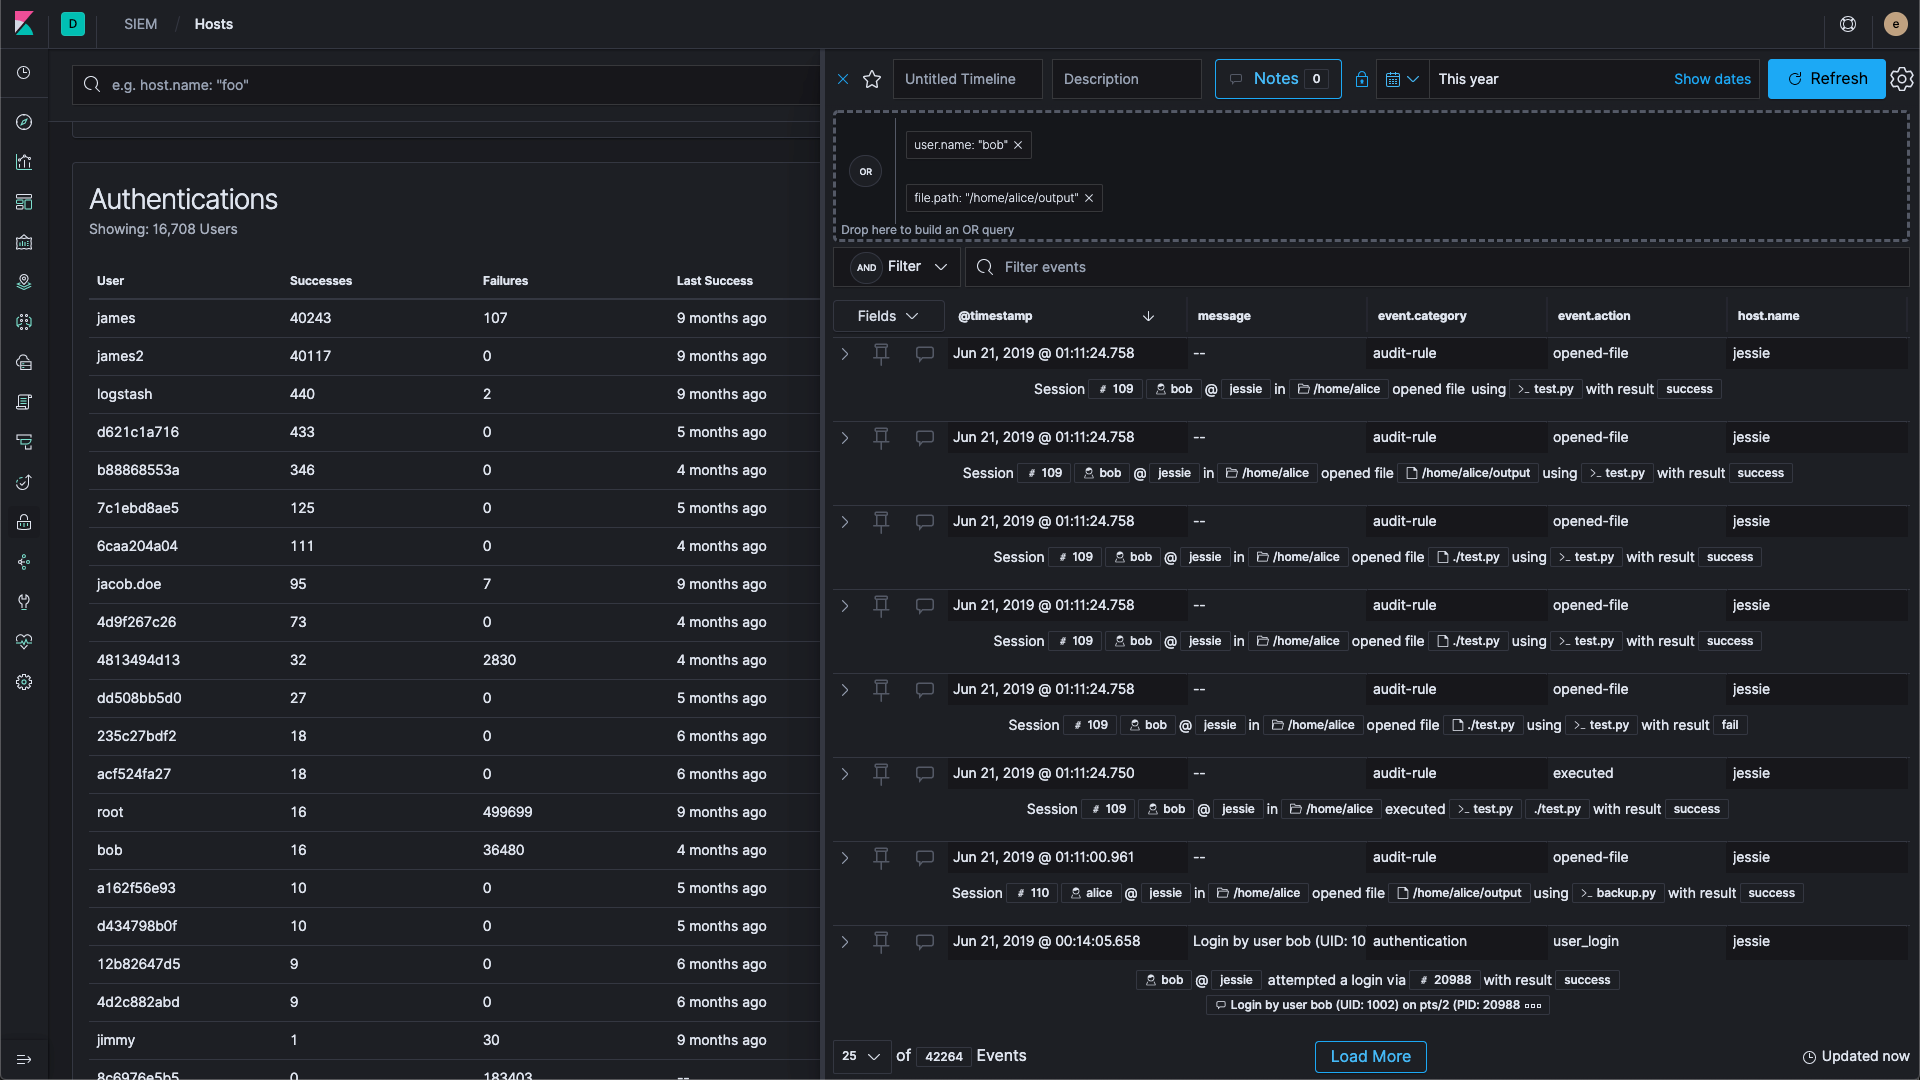
The line between security monitoring and application monitoring isn't one of the "double-yellow" variety — more like the "dotted-white" kind, with each side free to cross back and forth. Data from application traces might be used to identify malicious actors attempting SQL injection, and Endpoint Security might be leveraged to identify slowdowns with internal apps. While you are collecting these logs, metrics, and traces, Elastic lets you use them to protect. Elastic SIEM also supports logs generated by envoy proxy, an edge and service proxy designed for cloud native applications.
Combining Kubernetes logs, metrics, and traces with Elastic Endpoint Security goes beyond traditional observability. While you observe, why not protect? With the average threat dwell time exceeding 100 days, shipping, scaling, and storing data efficiently in Elasticsearch makes searching through all of this disparate security-related data practical, easy, and fast.
In Observability with the Elastic Stack, Tanya Bragin, Senior Director of Product Management here at Elastic, notes, "Observability is not something that a vendor delivers in a box — it is an attribute of a system you build, much like usability, high availability, and stability". Vendors don't know which data is going to be important to you in the long run, which is why Elastic products follow a simple, unified pricing model that we’ve had since the beginning. We apply this model to all use cases, including in the contexts of SIEM and Endpoint data, putting you in control of transforming your security operations.
Get started
You can get started with Elasticsearch on Kubernetes today using Elastic Cloud on Kubernetes (ECK), and you always have access to the latest version of the Elastic Stack when using the Elasticsearch Service, where you can sign up for a free trial to create your first cluster, or you can download it as part of the default distribution of the Elastic Stack.