Benchmark-driven optimizations — How we pushed scalability to the next level in Elasticsearch 8

 Share on Twitter
Share on Twitter

 Share on LinkedIn
Share on LinkedIn

 Share on Facebook
Share on Facebook

 Share by Email
Share by Email

 Print this page
Print
At Elastic, we strive to stay on top of the needs of our customers and solutions. One of the most common questions we receive is how to manage not only ever-increasing data volumes, but also higher shard counts. This is a complex problem that requires keeping resource usage (memory, CPU, and disk) under control while ensuring optimal performance.
We’ve already talked about scalability improvements for Elasticsearch 7.16, but for Elasticsearch 8 we have taken the effort to the next level!
In this article, we will talk about the steps we took and the methodology we developed to ensure that the improvements in areas like indexing, cluster state size, field caps latency, and snapshots result in an overall better experience with Elasticsearch 8.
Nightly benchmarks
Historically at Elastic, we’ve relied on benchmarks with various workloads that run every night against the latest build of Elasticsearch to guard against unintended performance regressions. If there are differences in the results across consecutive days, we bisect the commits and pinpoint/analyze the one that caused the change.
Over the years, we’ve expanded benchmark coverage and, starting with many shards, pivoted away from bare metal environments (suitable for workloads that require minimal platform variability aiming to uncover differences even in the range of milliseconds) to cloud based environments more suitable for macro-benchmarks using complex Elasticsearch architectures.
We’ve developed specific benchmarks for many-shards use cases early on during the development cycle to help us detect regressions (or improvements!) potentially caused by commits across the entire Elasticsearch codebase.
Indexing performance
The first many-shards specific nightly benchmark that we developed focused on tracking indexing throughput. As you’d expect, we use Rally for benchmarking Elasticsearch and created a variant of the elastic/logs workload called many-shards-quantitative to benchmark the following:
- Indexing throughput, while creating and indexing 50000 Auditbeat type indices. The throughput metrics quantify the rate at which Elasticsearch is able to create indices.
- Indexing throughput with parallel queries: we are indexing logging data, representative of Elastic’s observability solutions, with queries being executed against the logging indices in parallel [2].
- Latency of the field capabilities API (using 2 clients).
The actual hardware used can be seen in [3].
The nightly results for each of the above tasks are visualized in a public page under Distributed/Logging (Many Shards).
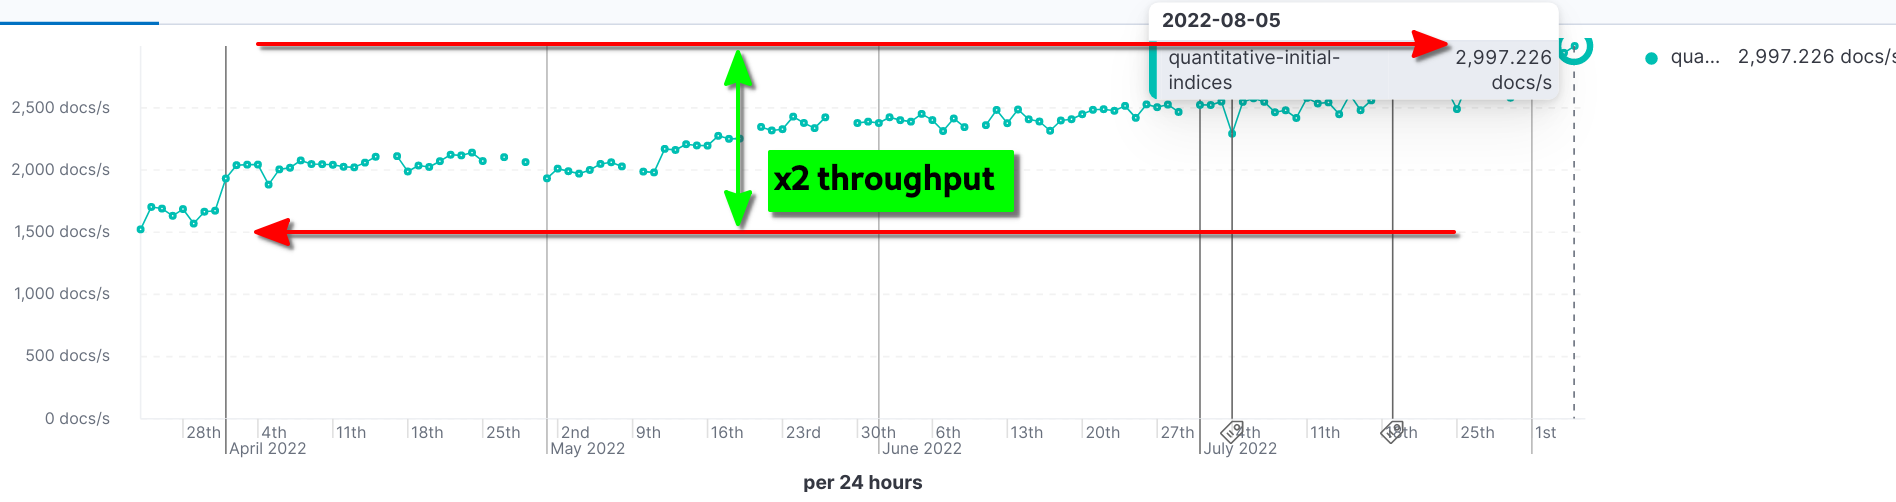
For example, we can see the incremental improvements for task 1 that almost doubled the throughput from Elasticsearch 8.2.0 to 8.5.0 [4]:
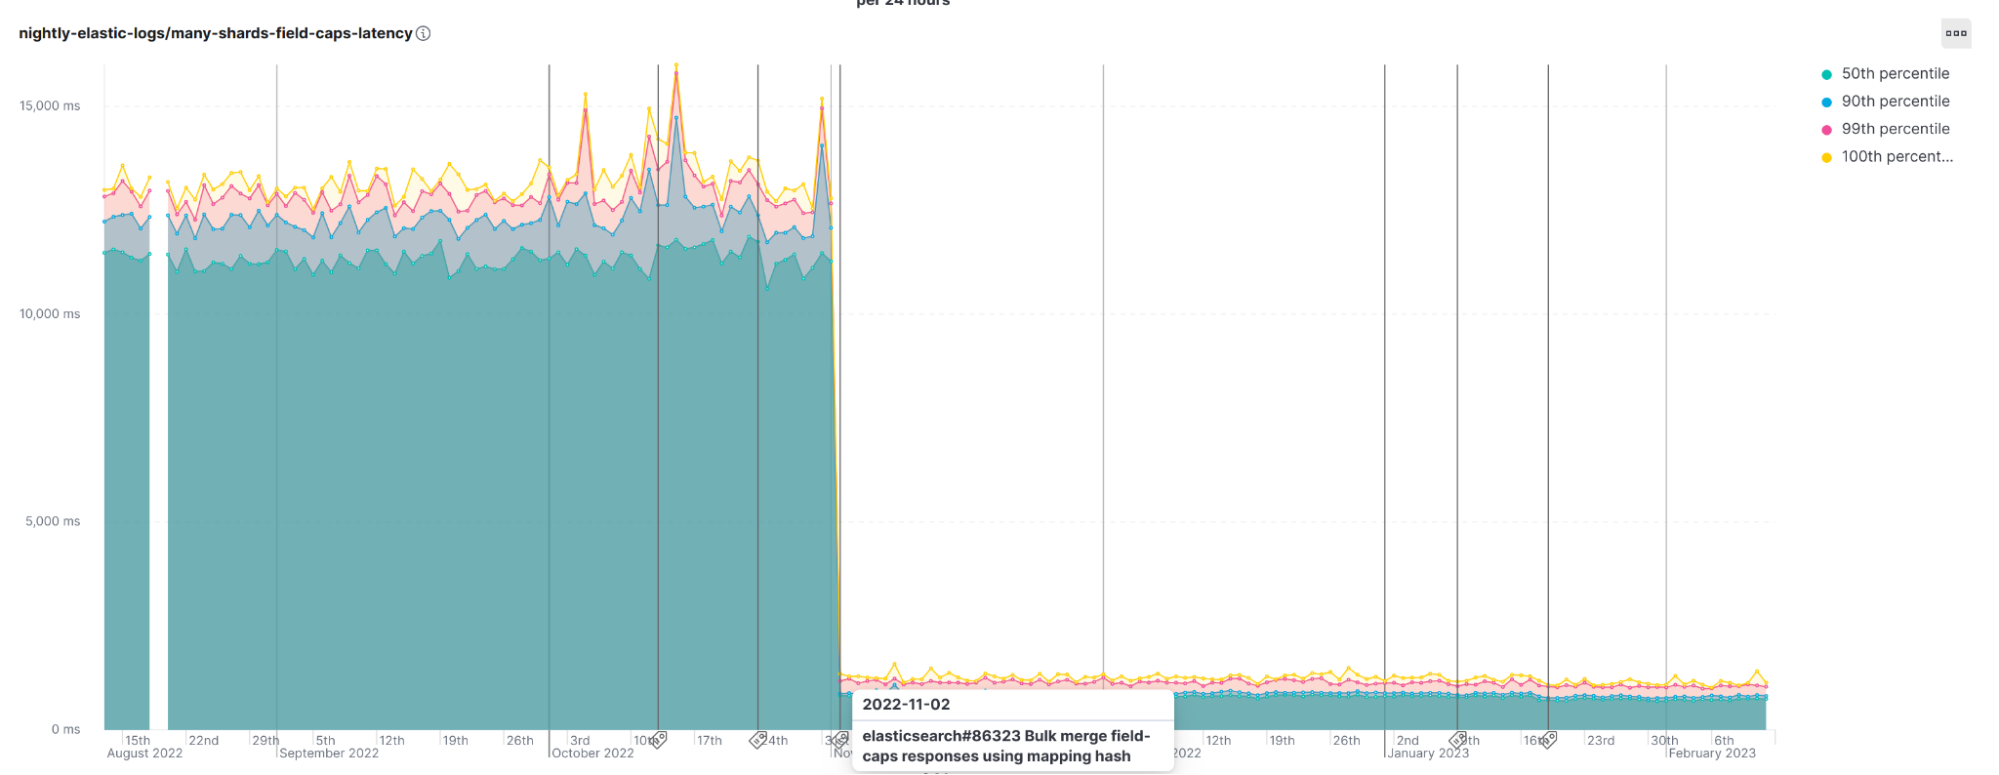
We can also see the positive impact that using a mapping hash had in Elasticsearch 8.6.0 with the field-caps api, an almost 10s (92%) drop in latency:
Snapshot performance
The second benchmark we developed was aimed at tracking performance and stability improvements related to snapshots in use cases with a high shard count.
This benchmark is also a variant of the elastic/logs workload called many-shards-snapshots and contains the following tasks:
- Creates and indexes into 25000 indices (1 primary/0 replicas); each index receives 100 auditbeat-like documents.
- Issues 100 sequential create snapshot requests (non blocking, using wait_for_completion=false).
- Waits until all snapshots from 2. have completed.
This benchmark runs on Google Cloud and uses a GCS bucket (in the same region) for storing the snapshots. You can find more details about the environment in [5].
The nightly benchmark page contains three visualizations:
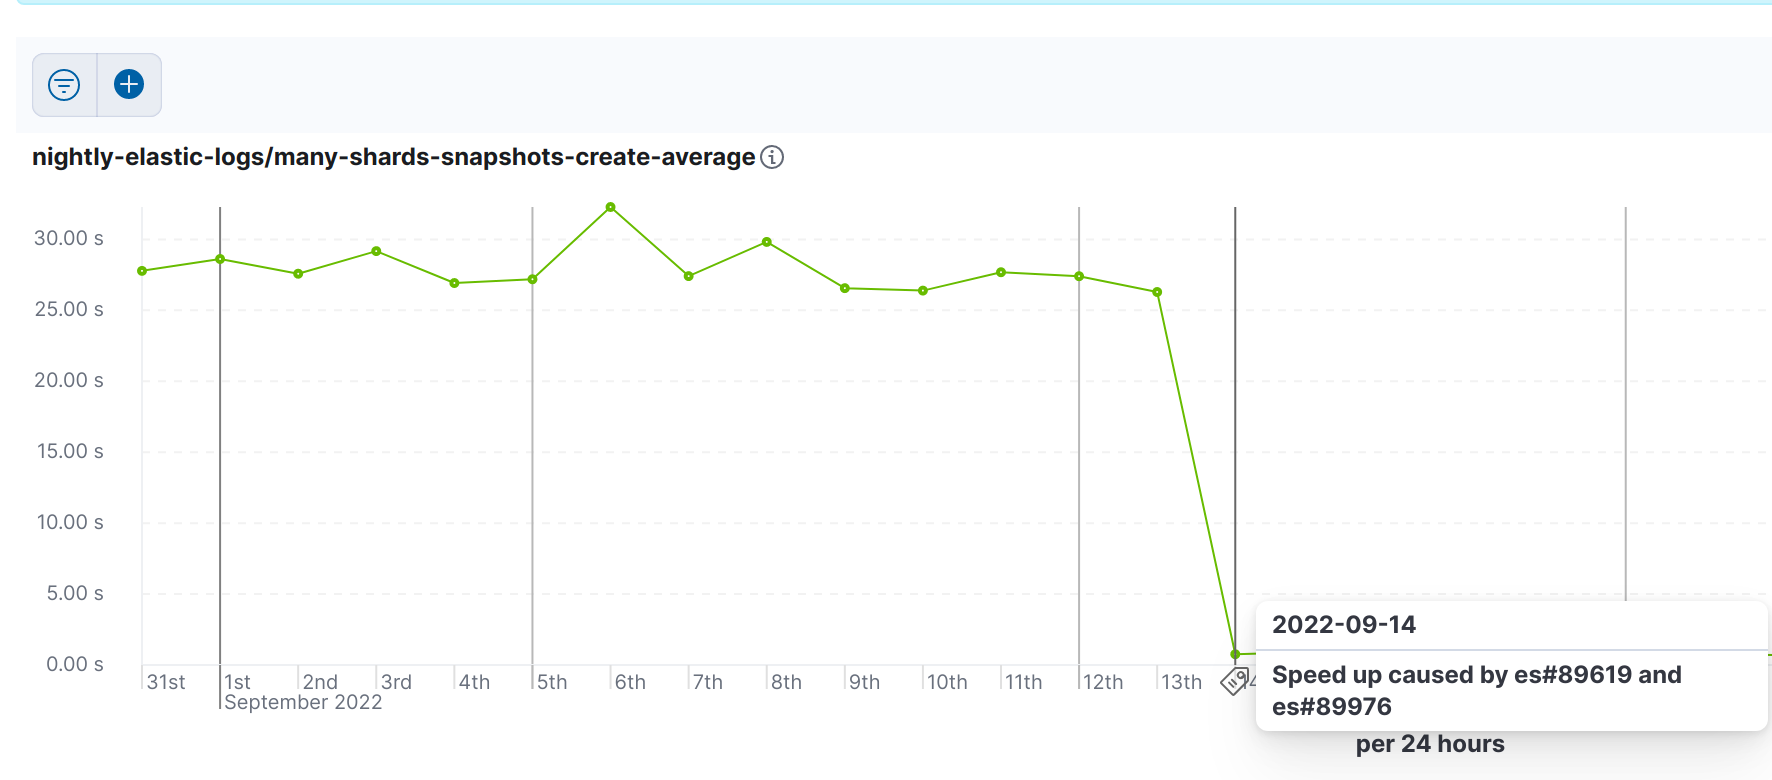
- many-shards-snapshots-create-average: the average service_time of the operations executed in 2; lower is better.
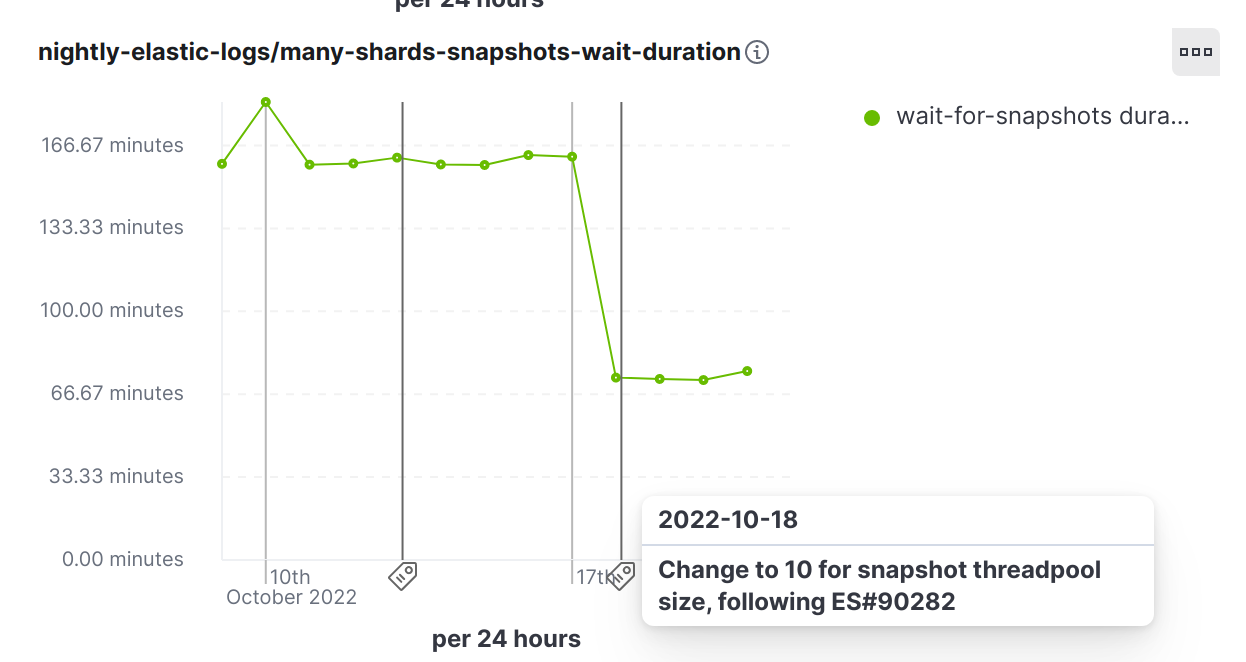
- many-shards-snapshots-wait-duration: the time taken to complete all snapshots (step 3); lower is better.
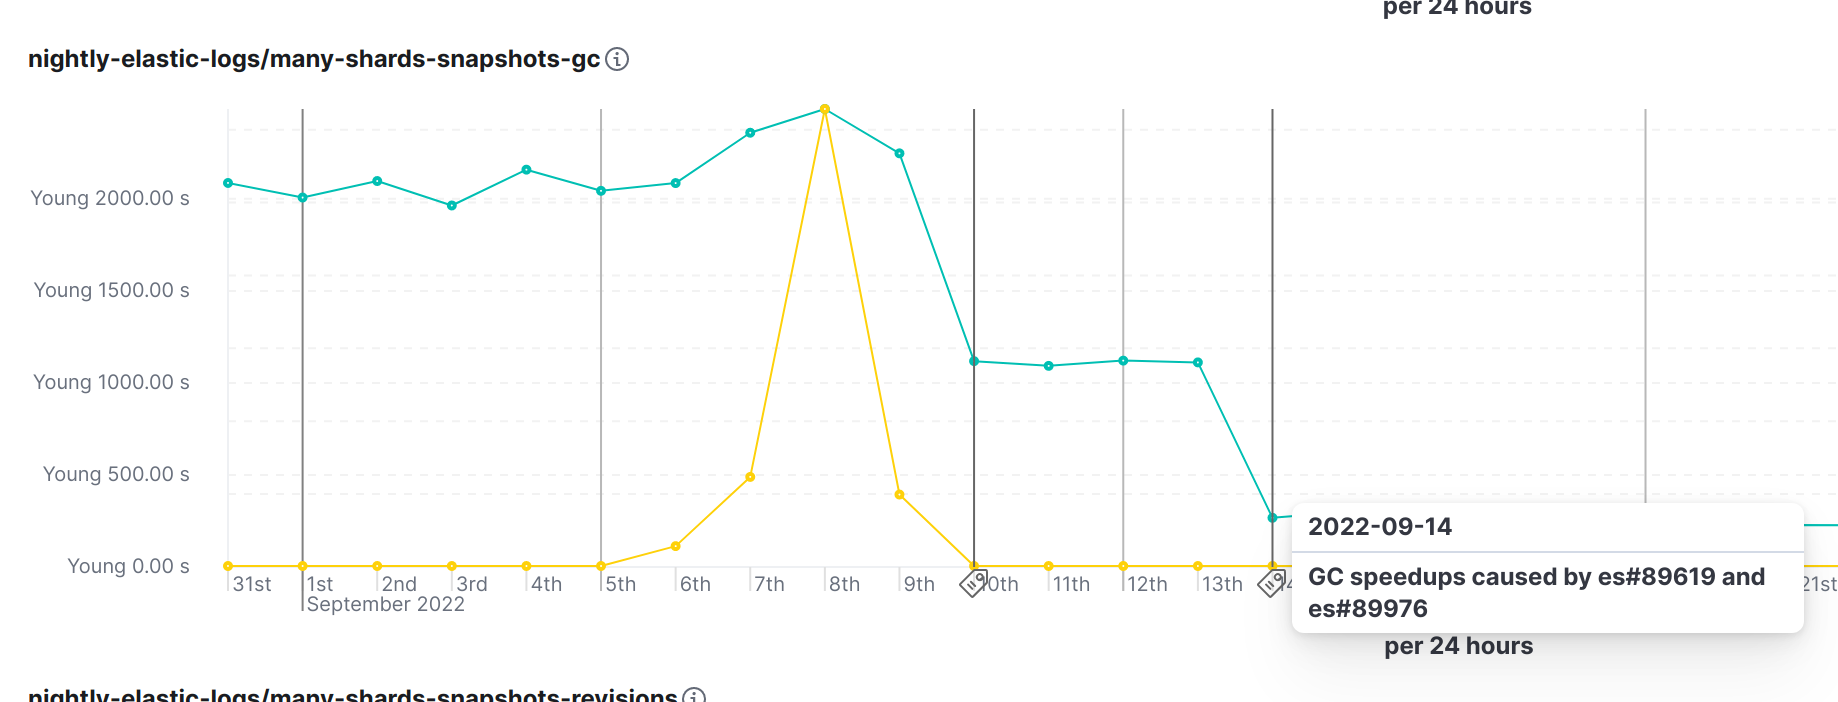
- many-shards-snapshots-gc: a chart of the total time[6] spent in Garbage Collections of young and old generation by the JVM; lower is better.
For example, we started with an average of 29s for task 1 and after two improvements that first appeared in Elasticsearch 8.5.0 it dropped to 0.7s — this is a 97% improvement in the total time taken!
This speed up is related to the significant reduction in GC activity. Prior to these improvements, Elasticsearch was sending the full state of all snapshots and their shards to all cluster nodes, whenever any single snapshot saw any change. This was never a problem with the cluster sizes we used to support, but it is a considerable issue with clusters holding tens of thousands of shards. The solution was to only send the changes to the snapshot state to the nodes. This performs orders of magnitude better than the old behavior, which uses copies of the entire cluster state for every new snapshot [7] shown below:
Following the above improvements, we could then double the default size of the snapshot pool to 10 for Elasticsearch 8.6.0 [8] resulting in an almost 50% improvement of the time it takes to snapshot a large number of read-only shards repeatedly, which is a very common scenario for large clusters in the real world:
Snapshot performance benchmark: an improvement that was a regression in disguise!
After setting up the many-shards-snapshots nightly benchmark, one day we noticed a 61% drop (i.e., a major improvement!) in the time needed to complete creating snapshots:
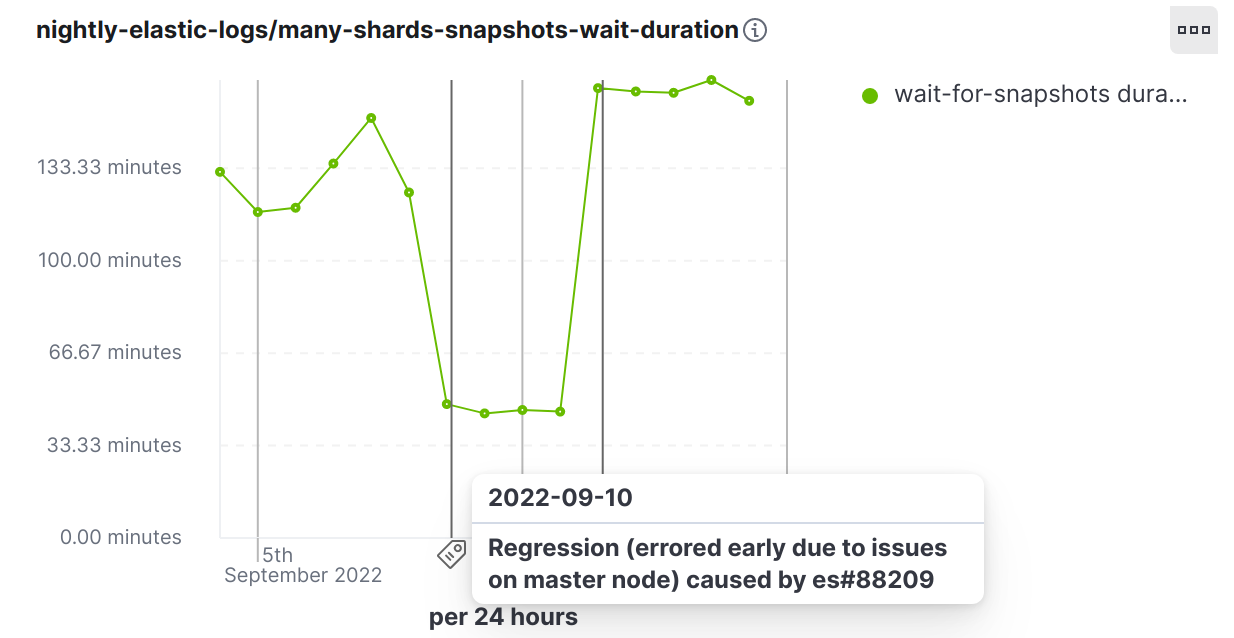
We have a habit of investigating both negative and positive changes, so we dug into it. Quickly it became clear that the opposite was true and that an Elasticsearch commit increased memory consumption on the master node making it unresponsive (eventually dying with an out of memory exception).
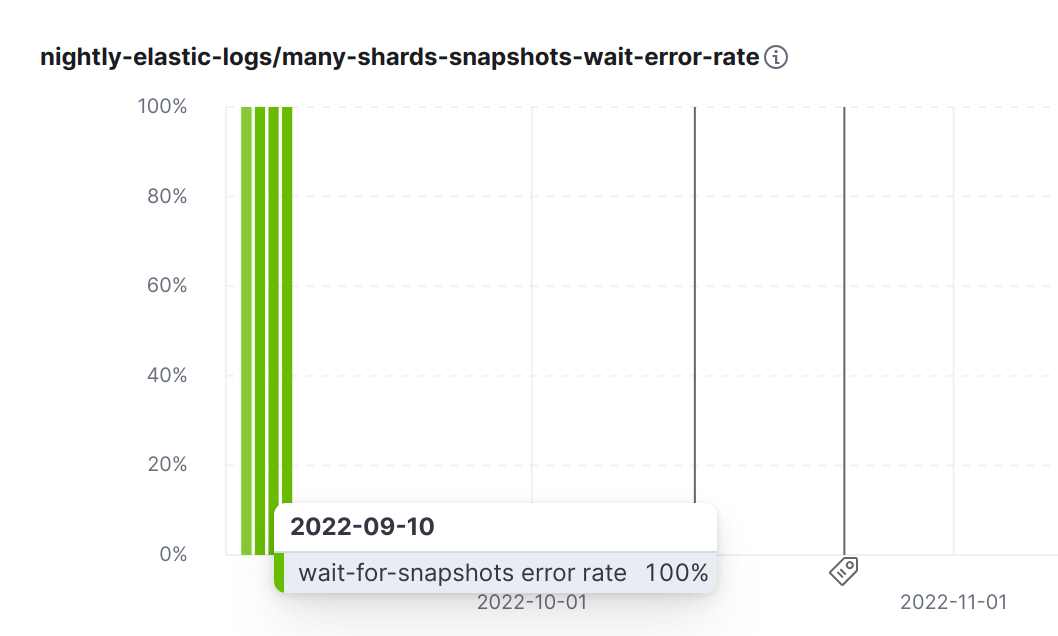
Eventually we added a visualization to track errors too:
Conclusion
Performance is at the heart of everything we do at Elastic. We run a large and rigorous set of benchmarks every night to validate all the improvements and catch unwanted regressions before they land in a released version of Elasticsearch. Using these benchmarks, we have been able to validate and release major improvements in Elasticsearch 8 for high shard count use cases.
Elasticsearch 8 contains several improvements to deal with high shard counts. Existing Elastic Cloud customers can already access them directly from the Elastic Cloud console. If you’re new to Elastic Cloud, take a look at our Quick Start guides (bite-sized training videos to get you started quickly) or our free fundamentals training courses. You can always get started for free with a free 14-day trial of Elastic Cloud. Or download the self-managed version of the Elastic Stack for free.
Appendix
[1] Specifically, 24 clients are bulk indexing 100 documents per index, across 50000 indices, as fast as they can (link to relevant section in elastic/logs challenge).
[2] Indexing uses a 10x higher bulk size compared to [1], i.e., 1000, 24 clients (link to relevant section in elastic/logs challenge).
[3] many-shards-quantitative environment:
Node Type | Backing Instances (AWS ec2, eu-west-1) |
Elasticsearch | |
Master | 3 x c6gd.8xlarge |
| Hot | 6 x m6gd.4xlarge Heap: 29GB |
| Loaddriver (Rally) | 1 x im4gn.4xlarge |
[4] Period of improvement: starting commit (included in ES 8.1.2) -> end commit (included in ES 8.5.0)
[5] many-shards-snapshots environment:
Note: All instances pin the CPU model to Intel Ice Lake to reduce result variance
Node Type | Backing Instances (Google Cloud, europe-west1) |
Elasticsearch | |
Master | 3 x custom n2 (8vCPUs, 8GB RAM, 1x375GiB local nvme scratch disk) |
| Hot | 6 x custom n2 (8vCPUs, 64GB RAM, 1x375GiB local nvme scratch disk) Heap: 29GB |
| Loaddriver (Rally) | 1 x custom n2 (8vCPUs, 64GB RAM, 4x375GiB local nvme scratch disk) |
[6] GC time: from the time that Elasticsearch starts until it gets stopped
[7] Snapshot improvements in Elasticsearch 8.5.0:
- es#89619: Make SnapshotsInProgress Diffable
- es#89976: Restrict the priority of ShardSnapshotTask to the same snapshot only
[8] Snapshot improvements in Elasticsearch 8.6.0:
- es#90282: Increase snapshot pool max size to 10
Share
- Share on Twitter
Share on Twitter
- Share on LinkedIn
Share on LinkedIn
- Share on Facebook
Share on Facebook
- Share by Email
Share by Email
- Print this page
Print