Beats 7.3.0 released
We’re pleased to announce the general availability of the Beats 7.3.0 release. This is the latest stable release and is now available for download!
This release is all about further growing the data source ecosystem!
Automate Functionbeat with CloudFormation
Functionbeat deploys on your serverless environment to collect events generated by cloud services and ship them over to Elasticsearch. The Functionbeat 7.3.0 release introduces the ability to export a CloudFormation template for integration with automation systems. Previously, Functionbeat was only available for manual command line deployment, but with this new functionality, users can now more easily automate Functionbeat deployments through their own CloudFormation stacks. We invite you to try out this new export feature and let us know what you think!
CloudFormation templates can be exported with the function subcommand under the export command:
$ ./functionbeat export function <FUNCTION_NAME>
Google Cloud integrations
Filebeat 7.3.0 introduces a new Google Cloud module that monitors Virtual Private Cloud (VPC) flow logs from Google Cloud through Stackdriver. It ships data to Elasticsearch in ECS format so it’s immediately available for analysis in the SIEM app (or with Maps, on a Canvas workpad … you name it).
Along with the module, Filebeat also introduces a new Google Pub/Sub input for consuming from Google Pub/Sub topics. This input can be leveraged for centralized ingestion of all your events from Google Cloud for real-time analytics with the Elastic Stack.
Databases for days
Databases are often the most critical part of a user-facing application. If they’re down or struggling, users are likely to notice the impact very quickly, so it’s important to understand how your database is performing. With the 7.3.0 release, we’re introducing support for three new databases in Metricbeat along with a new database source in Filebeat.
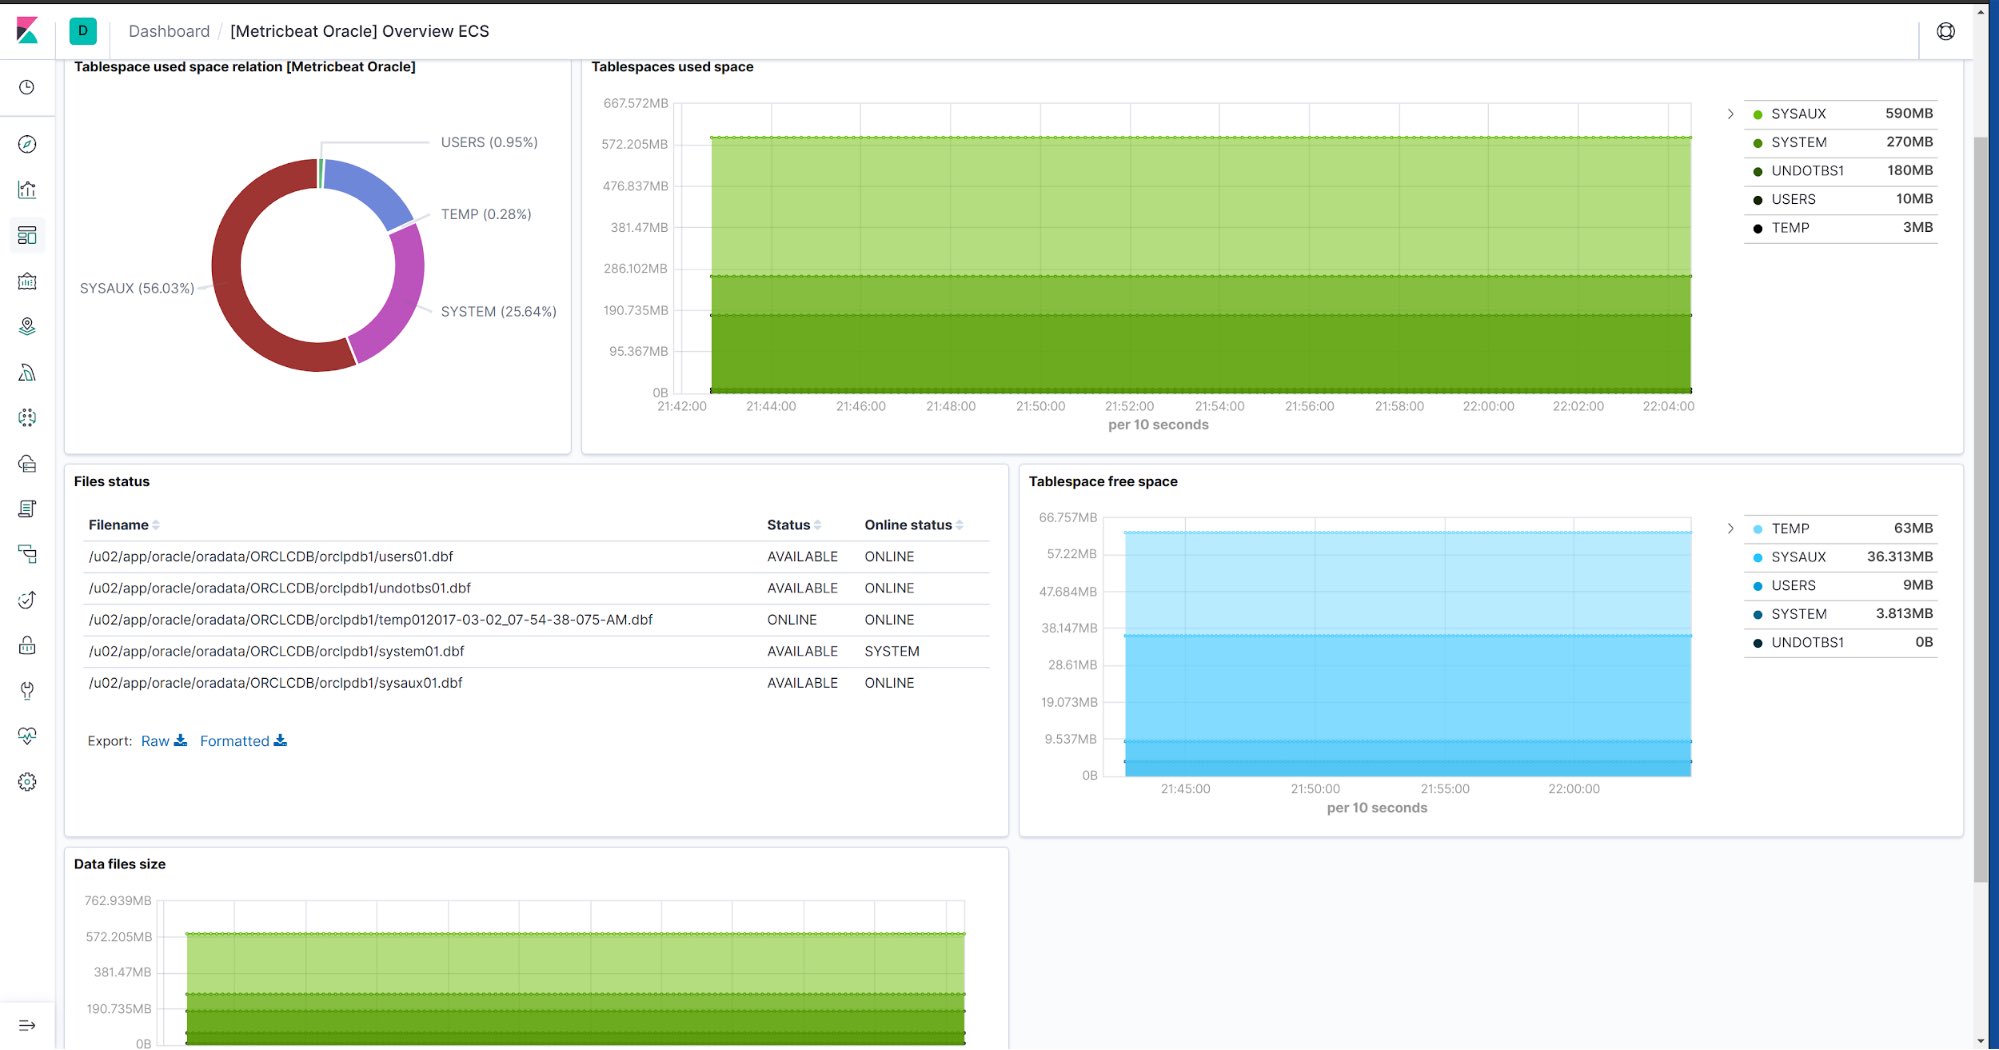
Oracle Database
The new Metricbeat Oracle module provides the tablespace metricset, which includes information about data files and temp files, grouped by tablespace. This module includes information on used and free space, the status of the data files, as well as the status of the tablespace itself.
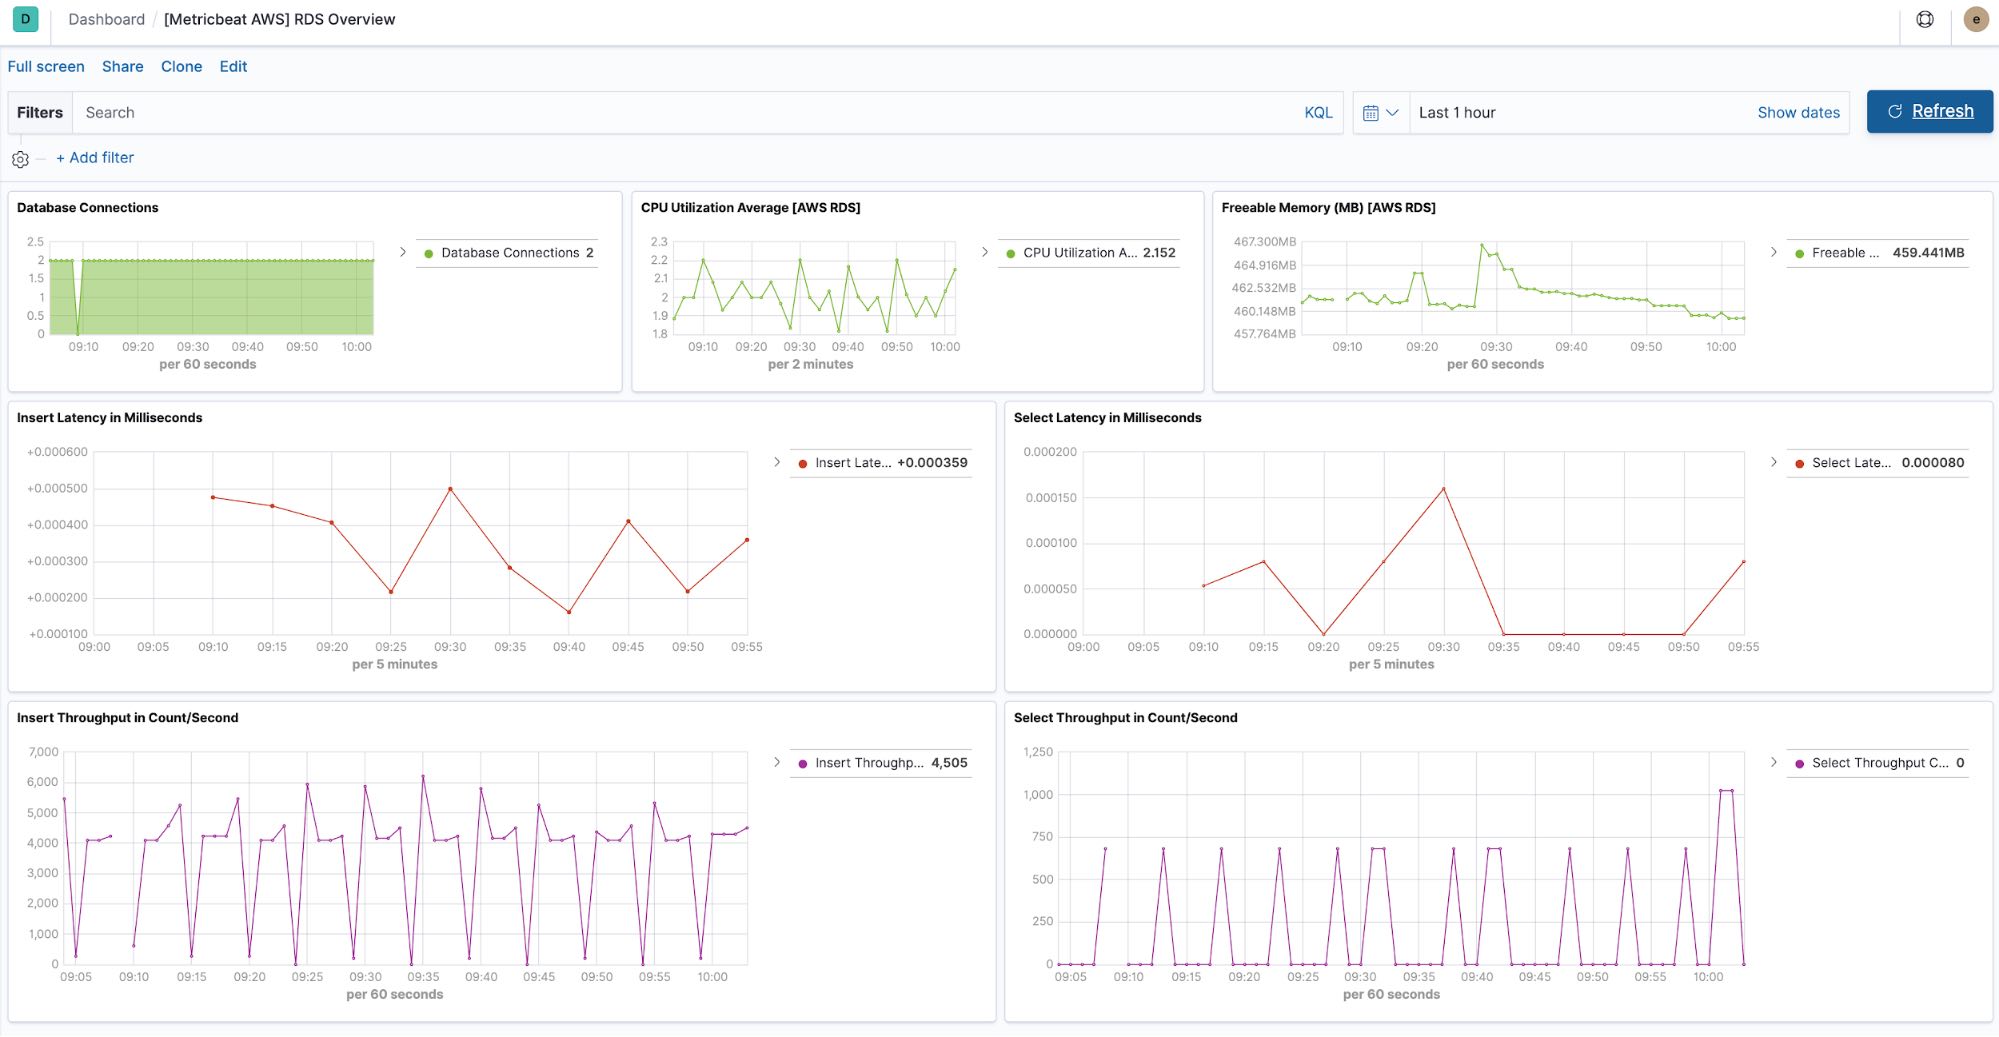
Amazon RDS
If you’re using Amazon Relational Database Service (RDS), you can now collect a rich set of metrics about your deployment, from CPU and memory usage, to disk and network throughput and latency. See all the details in the new RDS metricset, now available in the Metricbeat AWS module.
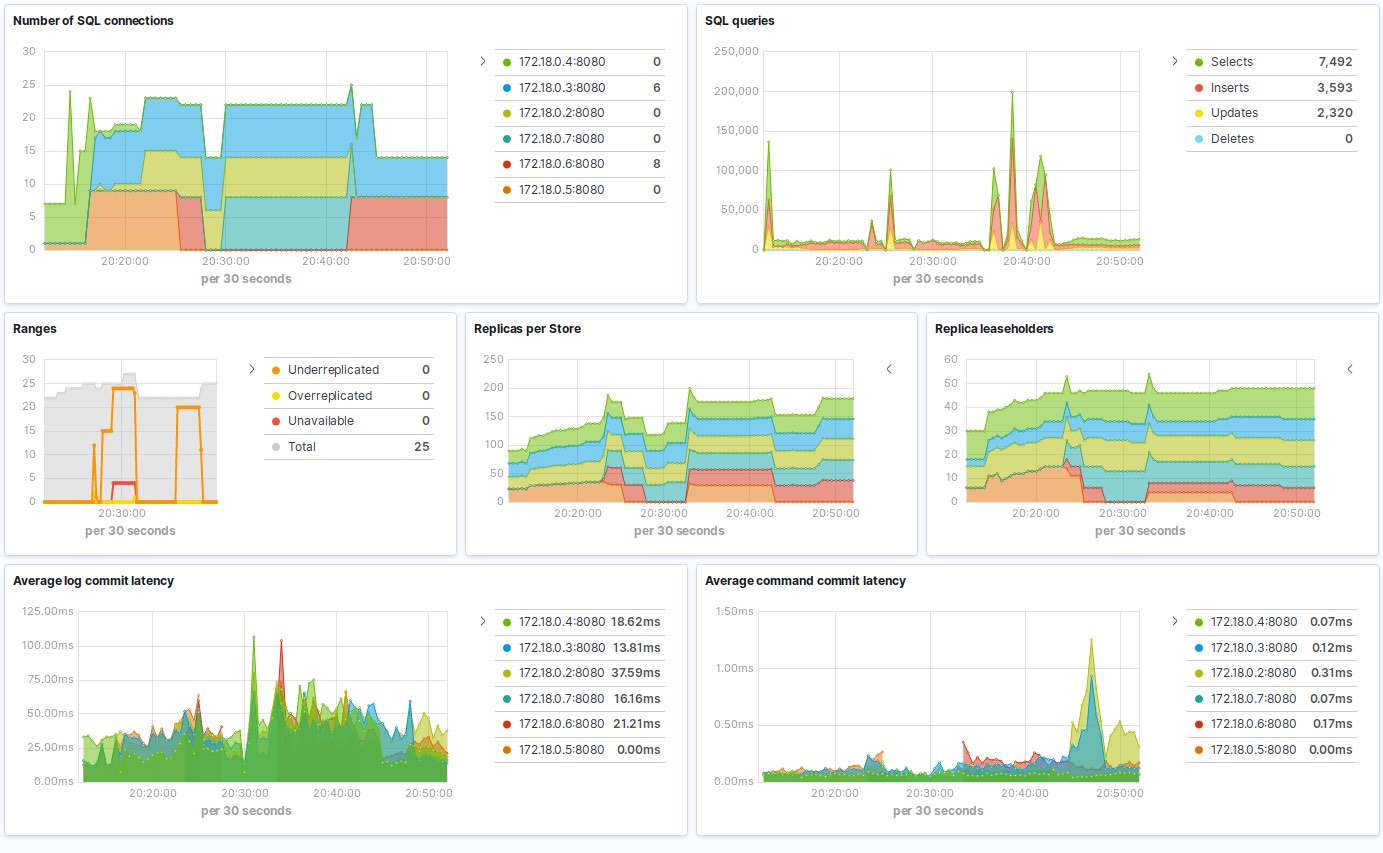
CockroachDB
The Metricbeat CockroachDB module exposes the status metricset, which is compatible with any CockroachDB version exposing metrics in Prometheus format.
Microsoft SQL Server
The new Filebeat MS SQL module monitors the Microsoft SQL Server error logs with the Elastic Stack.
Improved Kubernetes monitoring
Metricbeat 7.3.0 strengthens Kubernetes observability by introducing metricsets for three additional Kubernetes components:
- The controllermanager metricset captures metrics from kube-controller-manager.
- The proxy metricset covers kube-proxy, the network proxy component in Kubernetes.
- The scheduler metricset provides visibility into the kube-scheduler.
Configuration-only Metricbeat modules
We’re always looking for ways to streamline the process of adding new supported data sources. That’s why 7.3.0 introduces a new way of creating Metricbeat modules that doesn’t require a single line of Go code. We’re calling them light modules and they’re effectively a pre-defined configuration on top of an existing, more generic module, such as Prometheus or Jolokia. In fact, the CockroachDB module introduced in this release is our first light module, and it was much easier to create as a result.
Stay tuned — we’ll be sharing more about these light modules moving forward.
There’s a lot more to see
If you’ve made it this far, you might want to check out some of our related release blogs:
- The Elastic APM .NET Agent is now generally available. Plus, Elastic APM adds a new way to view services with aggregate service breakdown charts, agent sample rate configuration right from Kibana, and a whole lot more.
- Elastic Uptime has improved the look and feel of multi-location monitors with monitor summaries and details.
- Elastic Logs adds keyword highlighting, along with the ability to jump to APM traces based on
trace.id. - Metrics Explorer in the Elastic Infrastructure app, which allows you to quickly perform aggregation visualizations against time-series metrics, is now ready for use in production systems. Elastic Infrastructure also adds improved monitoring of additional core Kubernetes services and a new RDS metricset in the AWS module. Learn more in the Elastic Infrastructure release blog.
Please refer to the release notes for the complete list of bug fixes and features.