Elastic Infrastructure 7.3.0 released
We are pleased to announce a new release of Elastic Infrastructure, version 7.3.0, available on the Elasticsearch Service, or as part of the default distribution of Elastic Stack. This release brings the much-awaited GA version of Metrics Explorer - a quick and easy way to explore infrastructure metrics, lot’s of new integrations and improvements to the existing ones.
Metrics Explorer GA
We are excited to announce general availability of Metrics Explorer in Elastic 7.3!
Metrics are key indicators of infrastructure’s health, and for any sizeable infrastructure there are a lot of them. Our main goal with Metrics Explorer was to make browsing and analyzing metrics a smooth experience.
By default, Metrics Explorer shows the CPU information for all infrastructure assets, such as hosts, Kubernetes pods, and containers. This can easily be broken down per entity, such as container name, by selecting the respective field in the "graph per" section. Any graph can be opened in Time Series Visual Builder (TSVB), where it can be further enhanced, annotated, and published on a dashboard. In addition, you can quickly switch to the host overview from each graph’s action menu.
Simple, right? That’s the goal of Metrics Explorer -- simple and fast visualization experience regardless of the underlying complexity.
Hitting the general availability milestone means that starting from 7.3 Metrics Explorer can be used in production systems. That’s just the beginning! We are going to continue evolving and improving Metrics Explorer and other parts of Elastic Infrastructure. Let us know what you think. Ask a question or leave feedback in our forums.
Improved Kubernetes monitoring
In our previous blog post we talked about our commitment to supporting dynamic environments based on Kubernetes. In this release, we continue expanding our integrations with cloud-native technologies by adding new modules and improving the existing ones.
Release 7.3 strengthens Kubernetes observability by introducing metricsets for three Kubernetes components:
- controllermanager captures metrics from kube-controller-manager
- proxy covers kube-proxy, the network proxy component in Kubernetes
- scheduler provides visibility into the kube-scheduler
The updated Kubernetes module ships with expanded overview dashboards for the new metricsets.
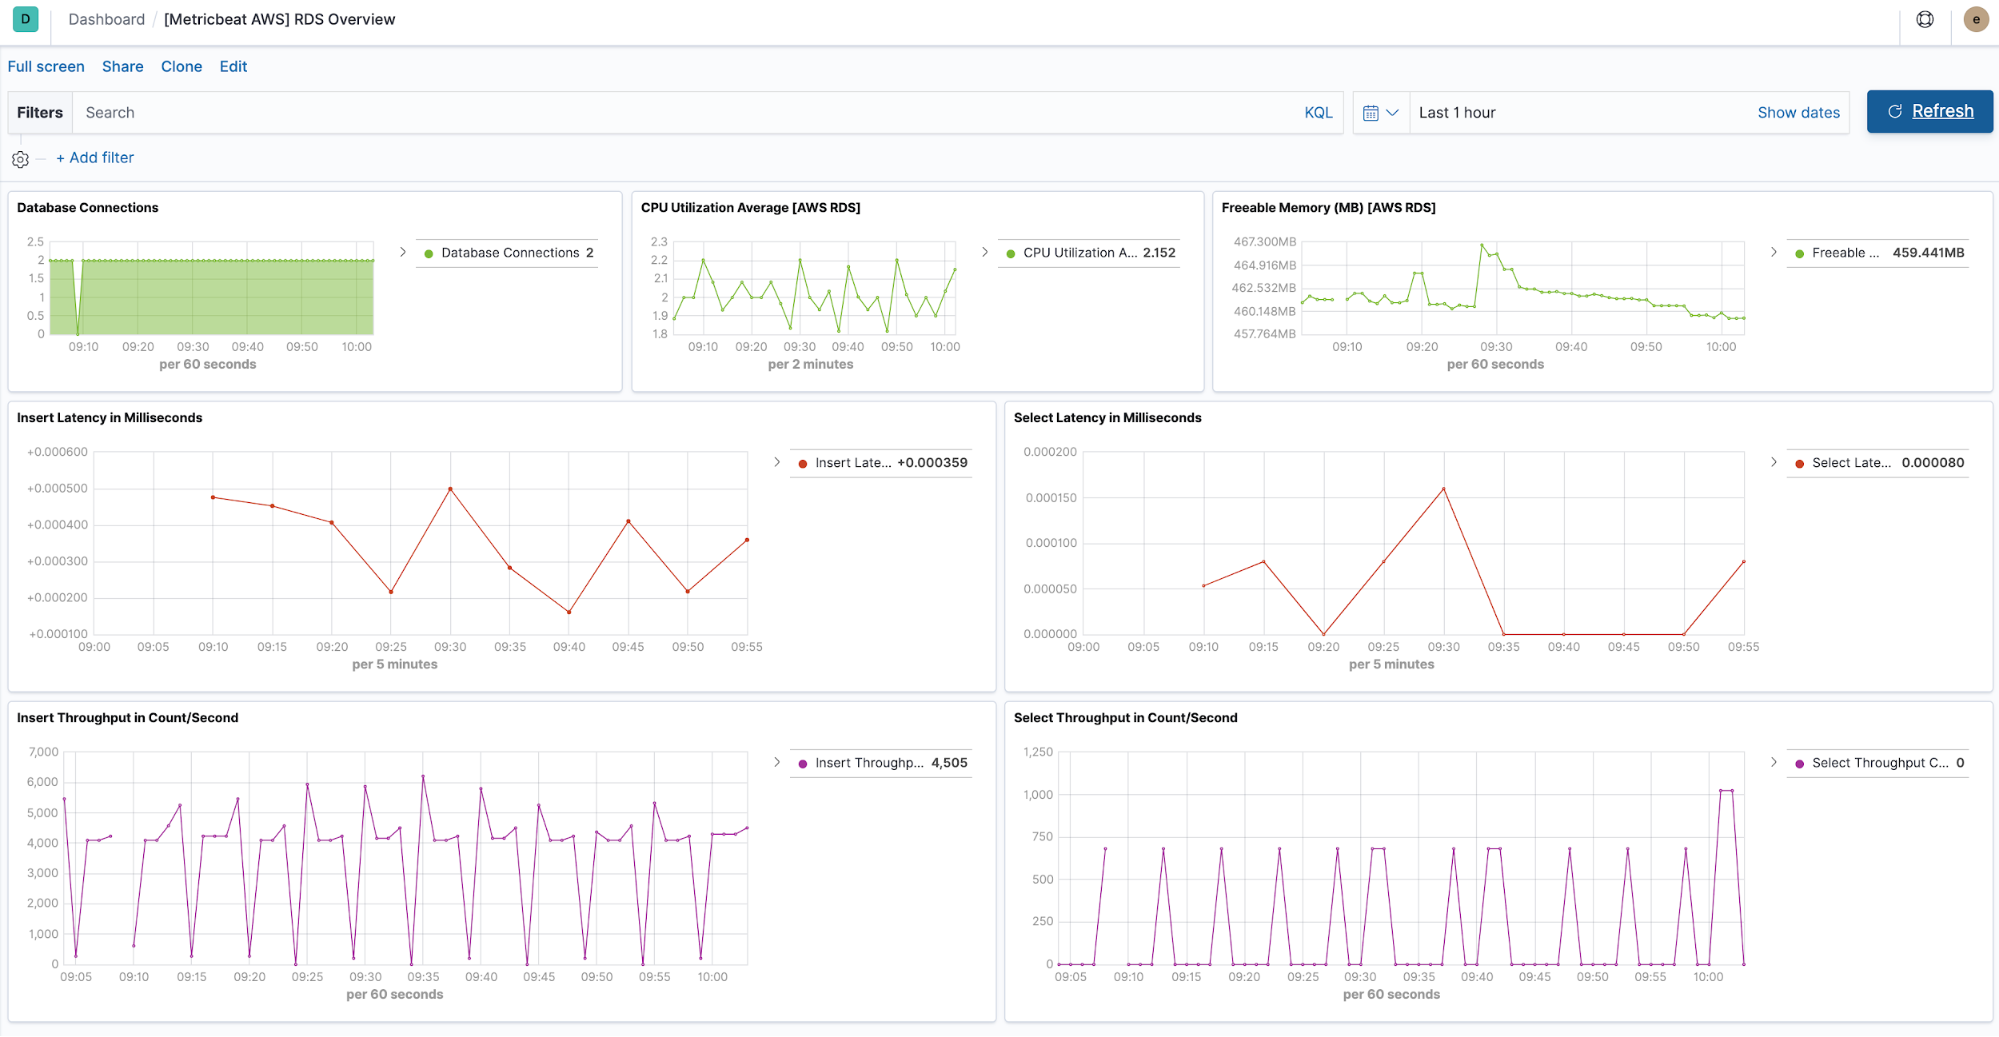
AWS RDS monitoring
The AWS module got an enhancement as well - the new rds metricset collects data from Amazon's Relational Database Service (RDS) service in all regions.
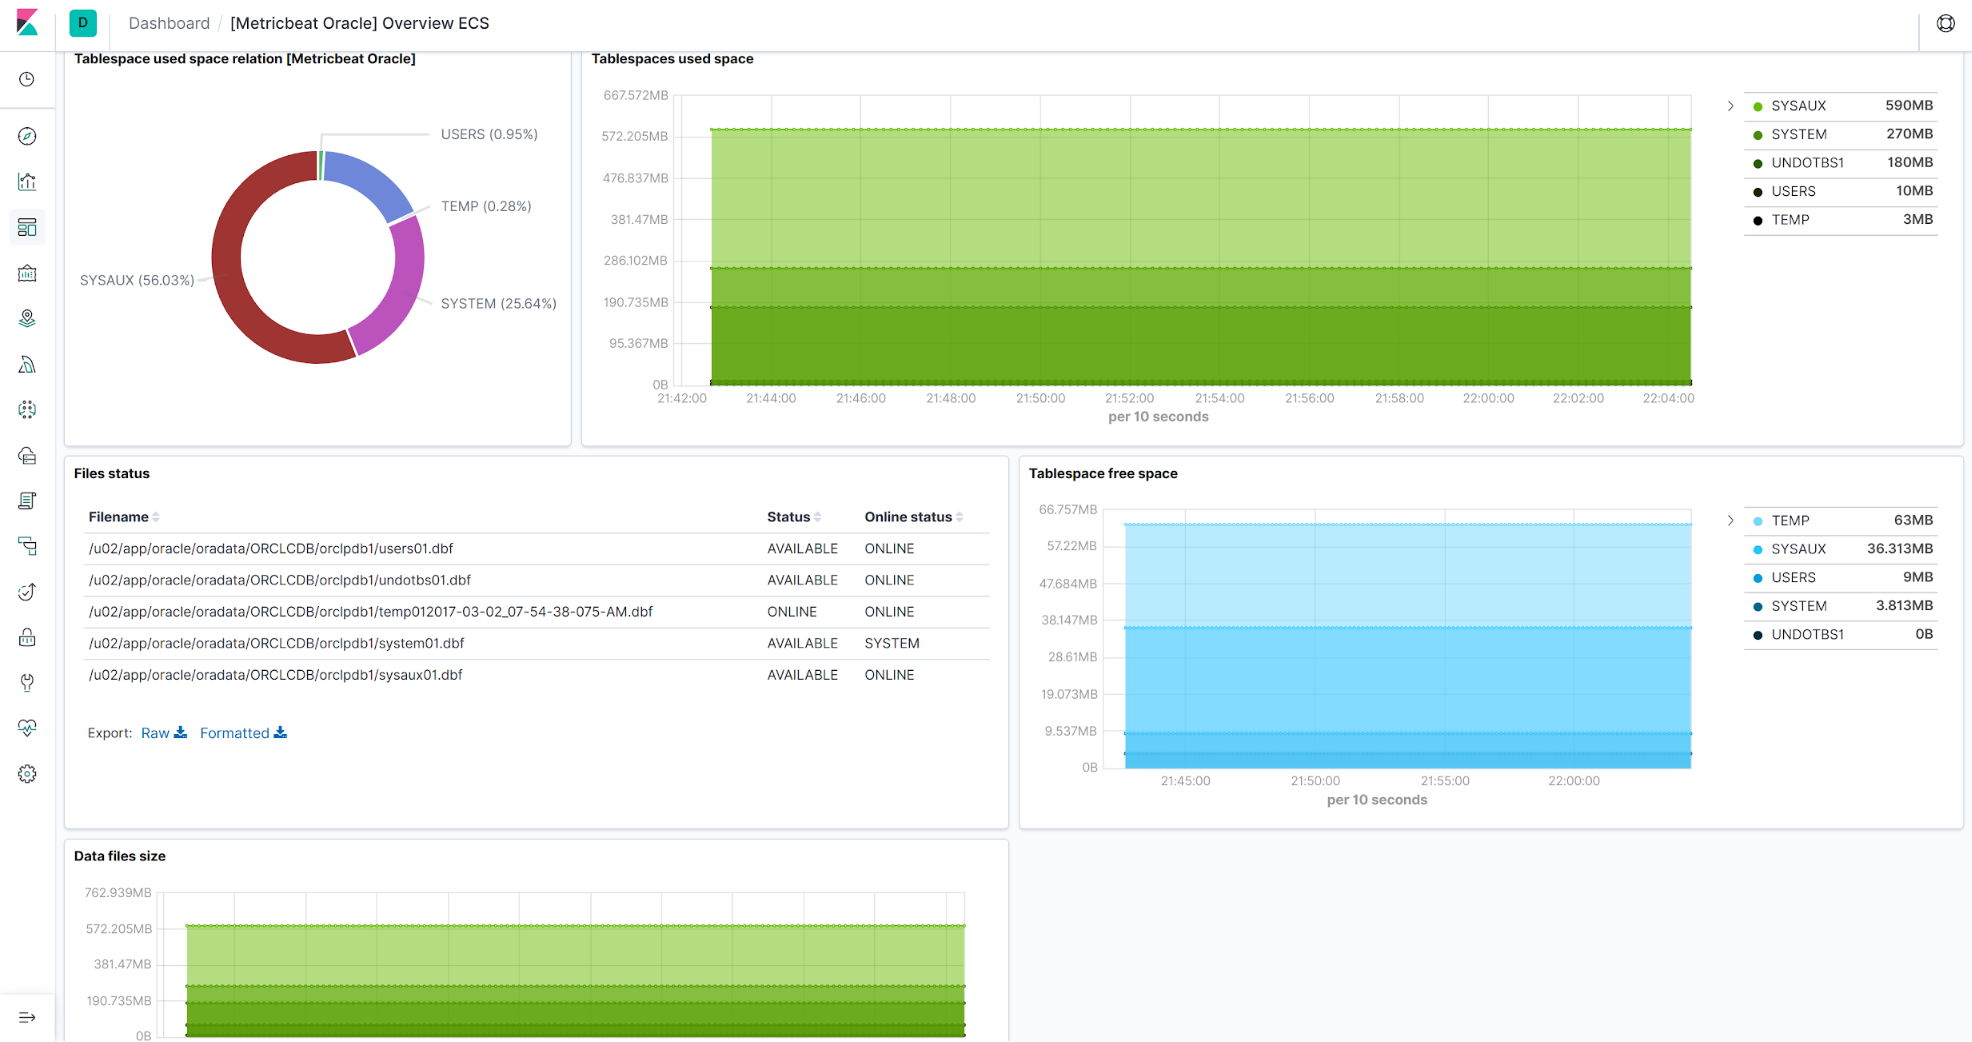
Oracle database monitoring
The latest addition to our list of database integrations is the new Oracle module that collects metrics from the Oracle Database Servers. Currently it includes the Tablespace metricset, which
includes information about data files and temp files, grouped by Tablespace. This beta module includes information on used and free space, the status of the data files, as well as the status of the Tablespace itself.
Configuration-only Metricbeat modules
In this release we introduced a new way of creating Metricbeat modules that doesn’t require writing a single line of Go code. These so called light modules can be derived from the existing modules, such as Prometheus or Jolokia. Think of them as predefined configurations of the more generic metricsets. The main goal with light modules is to make it simple to integrate with services whose protocols we already support. We will be publishing more information on light modules, stay tuned.
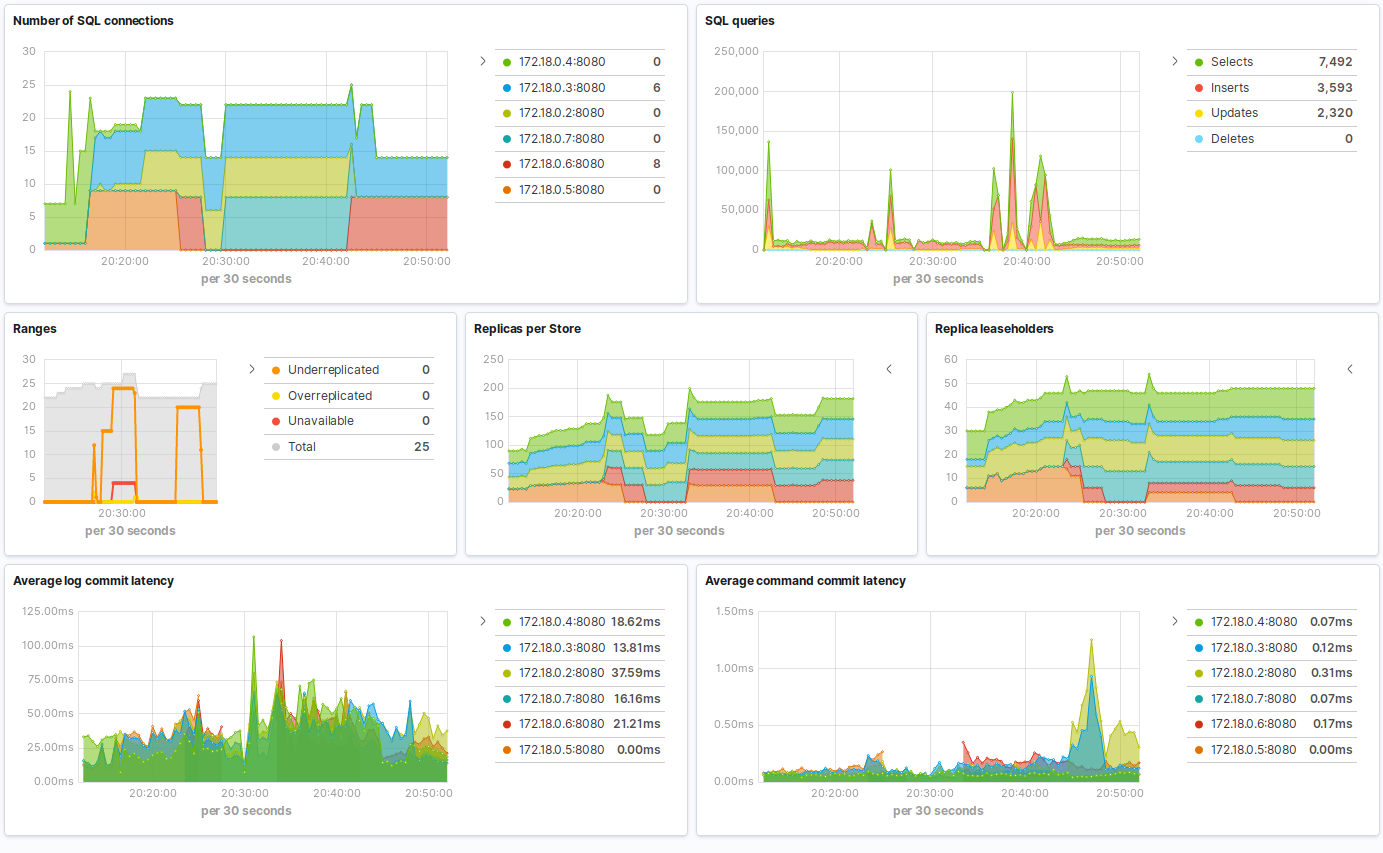
The first light module we realized in 7.3 was for CockroachDB - the distributed SQL database. The CockroachDB module is derived from the Prometheus module and exposes the status metricset, which is compatible with any CockroachDB version exposing metrics in Prometheus format.
See it in action!
You can access the latest version of the Elastic Infrastructure application on the Elasticsearch Service on Elastic Cloud by creating a new cluster, or upgrading an existing cluster the day of release, or you can download it as part of the default distribution of the Elastic Stack.