Observability updates in Elastic Stack 7.2: .NET in APM, Kubernetes monitoring, Metrics Explorer
We are excited to share with you our unbounded enthusiasm for improving tools available to operators keeping applications and services available, healthy, and fast. Whether or not you refer to this goal as “observability,” read on!
Elastic APM adds support for .NET, with the beta release of the highly requested .NET Agent. On the infrastructure monitoring front, we added the Metrics Explorer — a new view in the Infrastructure app in Kibana that is designed to enhance how you interact with infrastructure metrics in an ad hoc way. Finally, we continued to widen the Kubernetes monitoring tooling in 7.2 with the launch of several new data integrations for cloud-native technologies, such as CoreDNS and CRI-O.
If you cannot wait, version 7.2 is available now on our Elasticsearch Service — the only hosted Elasticsearch offering that includes these new features. Or you can download the latest version of the Elastic Stack.
The Elastic approach to observability
The term “observability” describes a philosophy that emphasizes unified visibility into the health of systems, services, and applications. While it’s a newer term in the industry, it effectively captures the main reason that many users and their teams are turning towards the Elastic Stack for their operational needs. Due to the flexible nature of Elasticsearch, where everything is just an index, users are able to successfully bring together logs, metrics, traces, and uptime metrics — which were traditionally disparate data sources — into a single operational store.
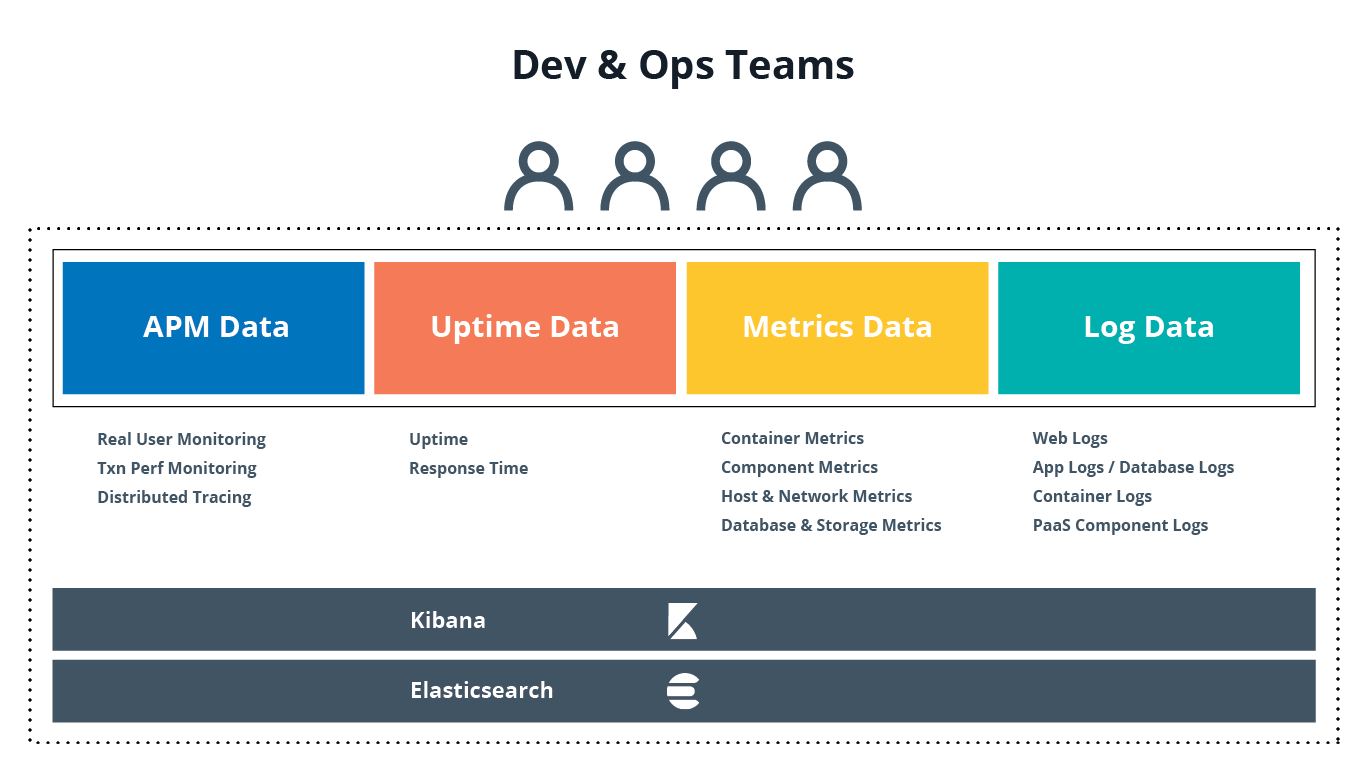
We have adopted a dual strategy in the observability space: continue to deliver best-in-class experiences for each “pillar” of observability, while simultaneously supporting how these data streams come together for users in more natural and fluid ways. All observability data adheres to the Elastic Common Schema (ECS) and all Kibana applications are integrated to provide one-click navigation and data correlation workflows.
Red Wing Shoes, an iconic manufacturer of safety footwear, relies on hosted Elasticsearch Service in Elastic Cloud to gain unified visibility into the manufacturing process on the factory floor, the health of its e-commerce website, and operations at over 600 retail store locations around the world. The team responsible for operations also leads the rollout of new applications and services aimed to grow the business. “We are able to do this with a tight-knit team because we focus on making our IT operations efficient,” said Marc Kermisch, Vice President and Chief Information Officer. “Seeing all the relevant operational data in a single datastore and UI interface has helped us get more effective at triaging and resolving issues based on actionable data. And the fact that the stack is fully managed for us in Elastic Cloud means our administrative overhead is low — all the deployment, scaling, and upgrades for the Elastic Stack happen at a click of a button."
Read more about our take on this important trend in our Observability with the Elastic Stack blog.
In 7.2, we continue to broaden and deepen our observability initiatives with the following product enhancements.
Elastic APM adds support for .NET, single-page applications, and agent-specific metrics
We are very excited to announce that we’re moving the Elastic APM agent for .NET from preview to beta status. The .NET Agent adds automatic instrumentation for ASP.NET Core 2.x+ and Entity Framework Core 2.x+, while also providing a Public API for the .NET agent that allows users to manually instrument any .NET applications that are using other frameworks.
.NET support was one of the most requested features for Elastic APM, and we are very happy to round out the supported languages universe. We would like to thank all our community members that filled out our survey to help us prioritize our language support efforts, and provided feedback on the preview version.
The RUM (Real User Monitoring) Agent in Elastic APM expands support for single-page applications (SPAs), allowing users to capture route-change transactions in addition to page-load transactions. SPAs offer many benefits over multiple-page applications (MPAs), including a more streamlined user experience and faster load times by dynamically rendering data elements as the user navigates the page. The dynamic nature of the delivery necessitates a more nuanced approach to gauging the end-user experience, such as examining internal application route changes.
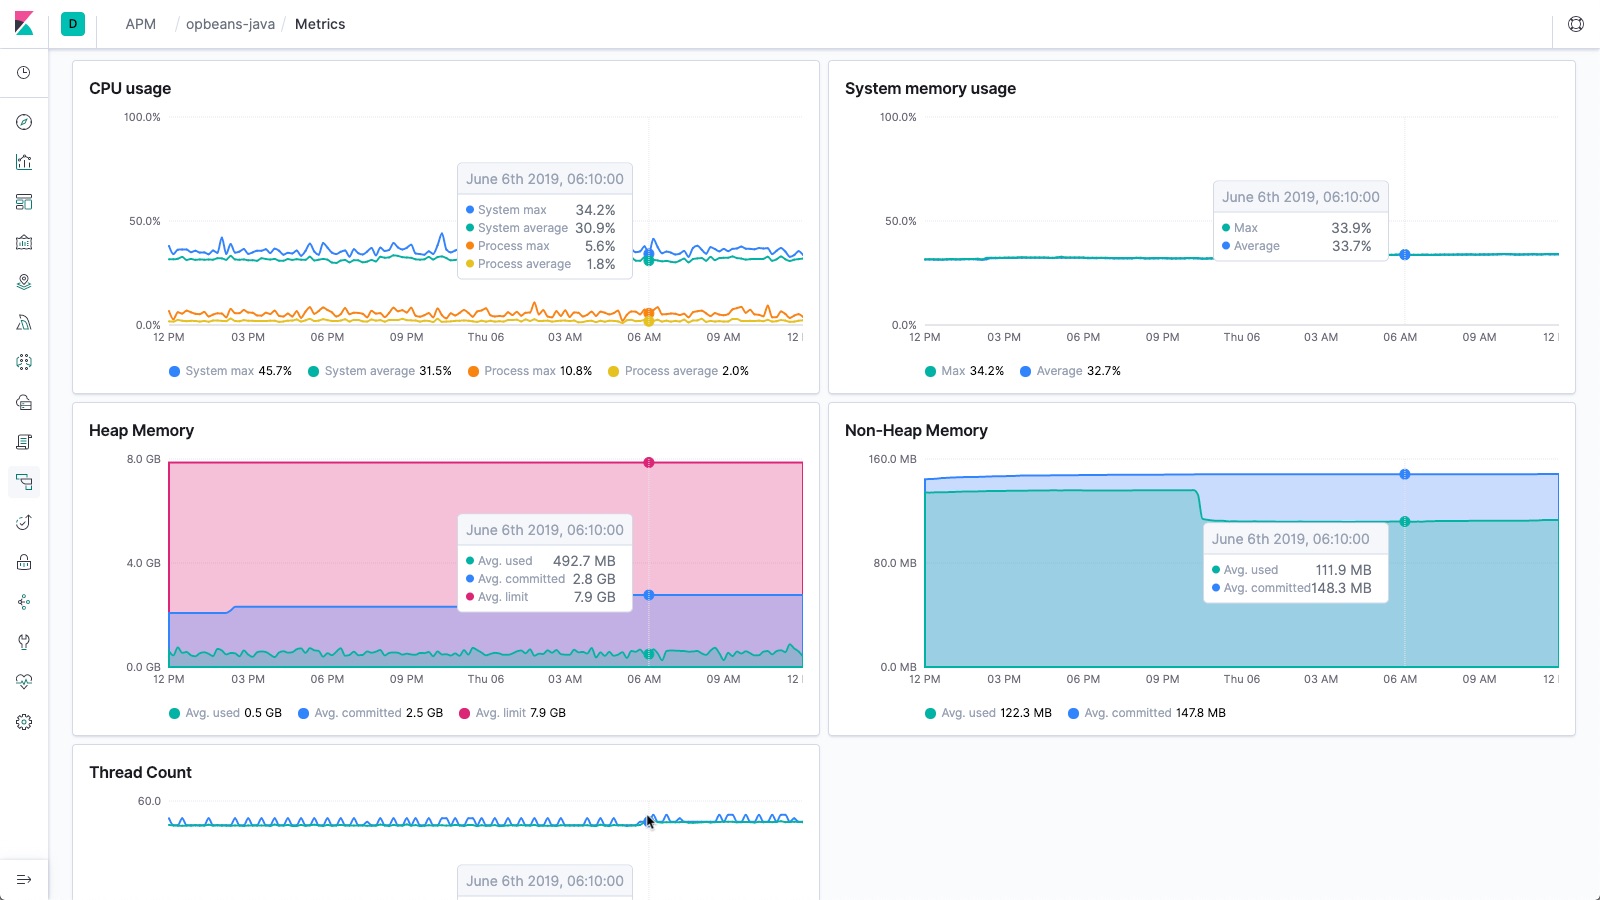
Finally, APM agents now collect language-specific metrics, in addition to the common key performance indicators — such as overall resource utilization — tied to APM trace data. For example, the Java Agent now collects JVM metrics, such as Java heap memory and thread count, which are also automatically displayed in the APM app. The addition of these agent-specific metrics creates a richer monitoring experience by providing additional context into application behavior, without requiring developers to install additional agents.
Read about more APM goodness in our Elastic APM release blog.
Metrics Explorer enhances exploration of infrastructure metrics
Expanding support for metrics has been a constant focus for the Elastic Stack engineering team over the last few years. Improving storage efficiencies through new data formats like Bkd trees that are optimized for numeric data, expanding the set of metrics data integrations through new Metricbeat modules, and enhancing time series visualization capabilities with dedicated Kibana apps like the Time Series Visual Builder are just a few examples of our continual commitment to this area.
Our users loved it, and in 7.2 we are doubling down on ad-hoc metrics exploration by introducing the Metrics Explorer in the Elastic Infrastructure app. This user interface enables you to navigate through most important infrastructure metrics and interact with them using common tags and chart groupings. Each Metrics Explorer chart can be opened in Time Series Visual Builder for further investigation, combining the simplicity of navigating metrics with just a single click with the power of all Elasticsearch aggregations. All of this exploration happens at blazing speed regardless of the number and cardinality of your tags and dimensions.
The Metrics Explorer is currently in beta — we would love your feedback on Discuss. Read about other improvements in our Elastic Infrastructure release blog.
Elastic strengthens Kubernetes observability
The Kubernetes ecosystem is rapidly evolving, fueled by open source innovation at many companies. New projects are added to the CNCF ecosystem every month, and get promoted to Graduated status at a remarkable speed.
Elastic is committed to supporting teams migrating on Kubernetes, including their need to monitor this dynamic technology stack. For example, features like auto-discovery in Filebeat and Metricbeat and modules for cloud native technologies like Prometheus provide turnkey ways to monitor both the Kubernetes infrastructure and services running in it.
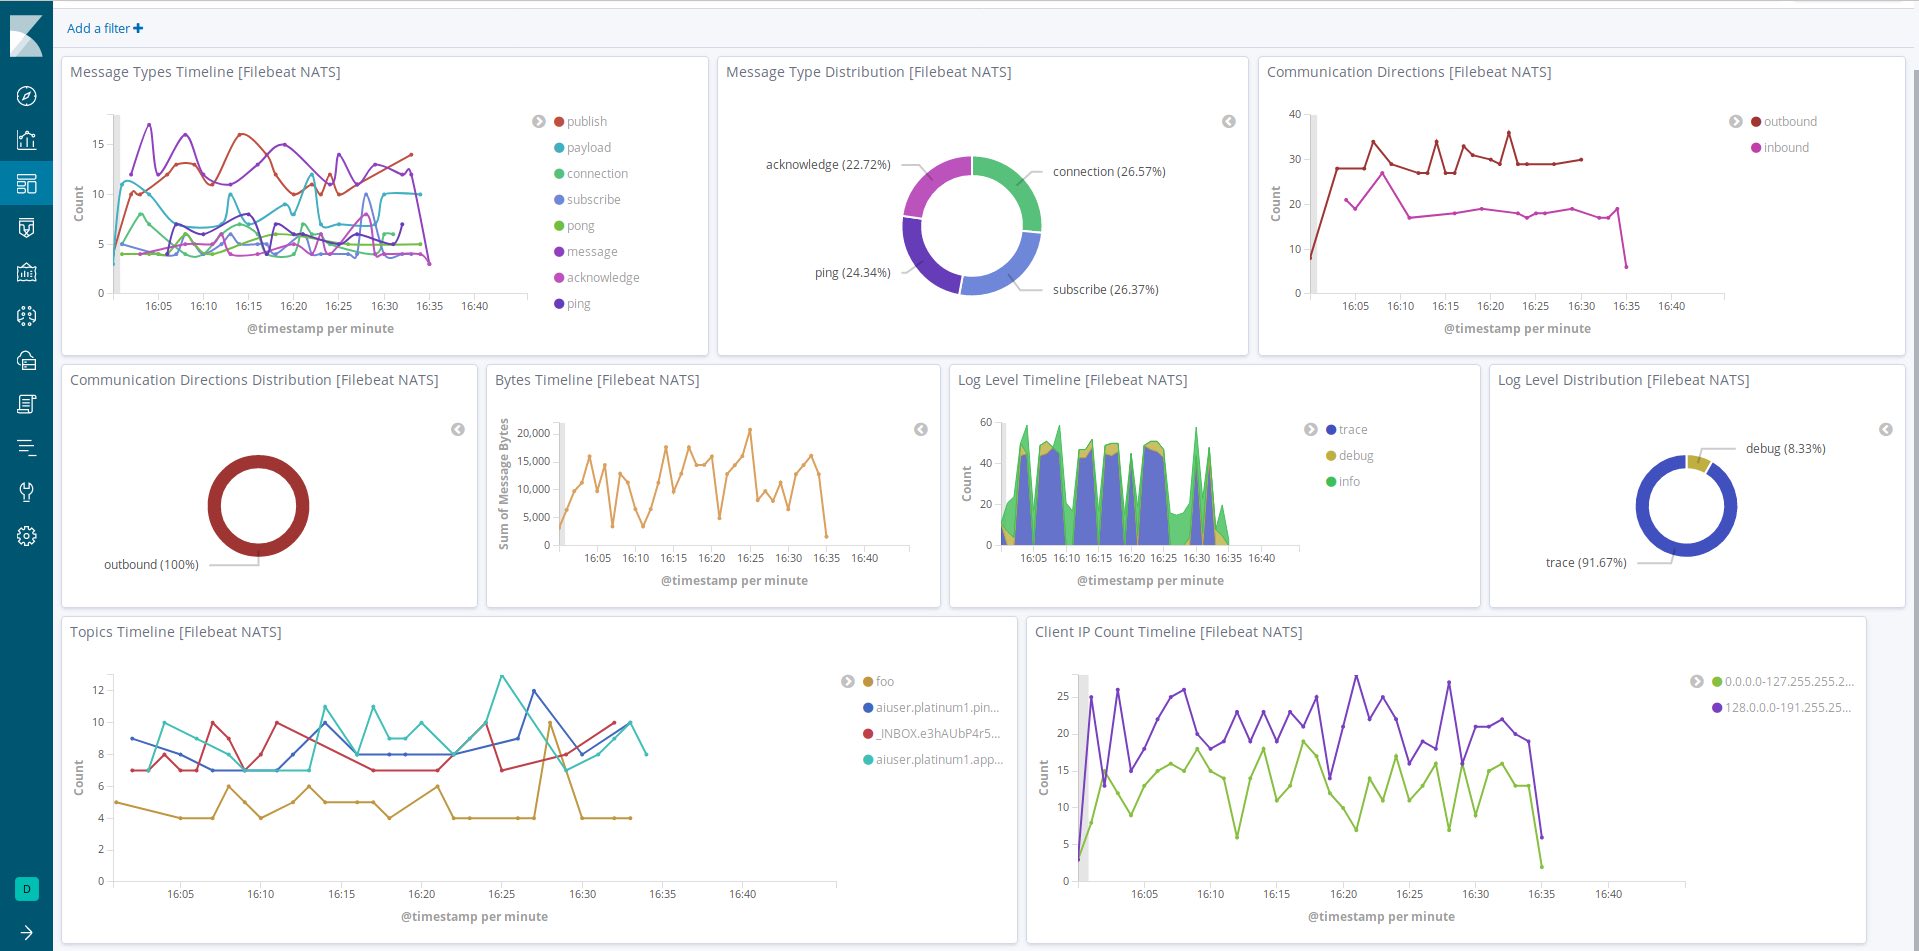
7.2 builds on these efforts with the launch of several new integrations for cloud-native technologies. Filebeat and Metricbeat introduce support for CoreDNS, the default cluster DNS for Kubernetes, that was recently promoted to Graduated status in CNCF. We are also expanding our support for the NATS messaging system — an open source cloud-native messaging system — in close collaboration with community members.
Finally, Filebeat 7.2 adds support for CRI-O, the open Container Runtime Initiative for Kubernetes. Developed at RedHat, this lightweight alternative to Docker is already the default container runtime in the popular OpenShift distribution. The CRI-O module lets Kubernetes users switch to CRI-O as their container runtime, without sacrificing their monitoring requirements.
Read more about the Kubernetes data integrations goodness in our Elastic Infrastructure and Elastic Logs release blogs.
But wait ... there’s more!
Elastic Uptime, recently introduced to provide a turnkey experience around active availability monitoring, now includes one-click integrations with the Elastic Logs, Infrastructure, and APM apps. These integrations make it that much easier to integrate active monitoring into your log analytics and observability workflows. Read more about these and other advancements in our Elastic Uptime release blog.
Elastic Logs, introduced in 6.5 to streamline working with log data, added support for structured logs and events via explicit column configuration. It also introduced a “filter by field” feature, which enables an important “view surrounding logs” workflow many logging users rely on in investigations. Read more about these and other new features in our Elastic Logs release blog.
Make it yours
The easiest way to try out the latest features is to spin up an Elasticsearch Service cluster on Elastic Cloud. We make the latest versions of the Elastic Stack available there on the day of release. If you like it, keep it — we take care of running, scaling up or down, and upgrading the cluster for you. If you are more into running things yourself, you can learn about our self-managed options, such as downloading binaries, running Docker containers, and deploying the Elastic Stack on top of Kubernetes.