Monitoring overview
editMonitoring overview
editWhen you monitor a cluster, you collect data from the Elasticsearch nodes, Logstash nodes, Kibana instances, and Beats in your cluster.
All of the monitoring metrics are stored in Elasticsearch, which enables you to easily visualize the data from Kibana. By default, the monitoring metrics are stored in local indices.
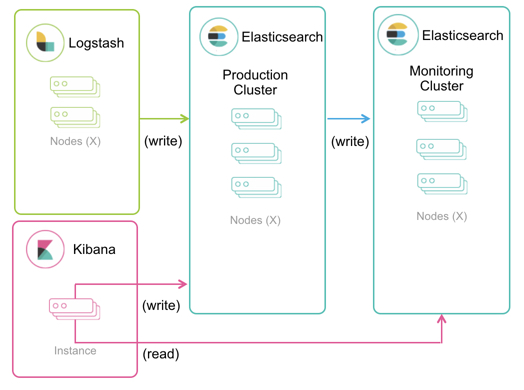
In production, we strongly recommend using a separate monitoring cluster. Using a separate monitoring cluster prevents production cluster outages from impacting your ability to access your monitoring data. It also prevents monitoring activities from impacting the performance of your production cluster. For the same reason, we also recommend using a separate Kibana instance for viewing the monitoring data.
The following diagram illustrates a typical monitoring architecture with separate production and monitoring clusters:
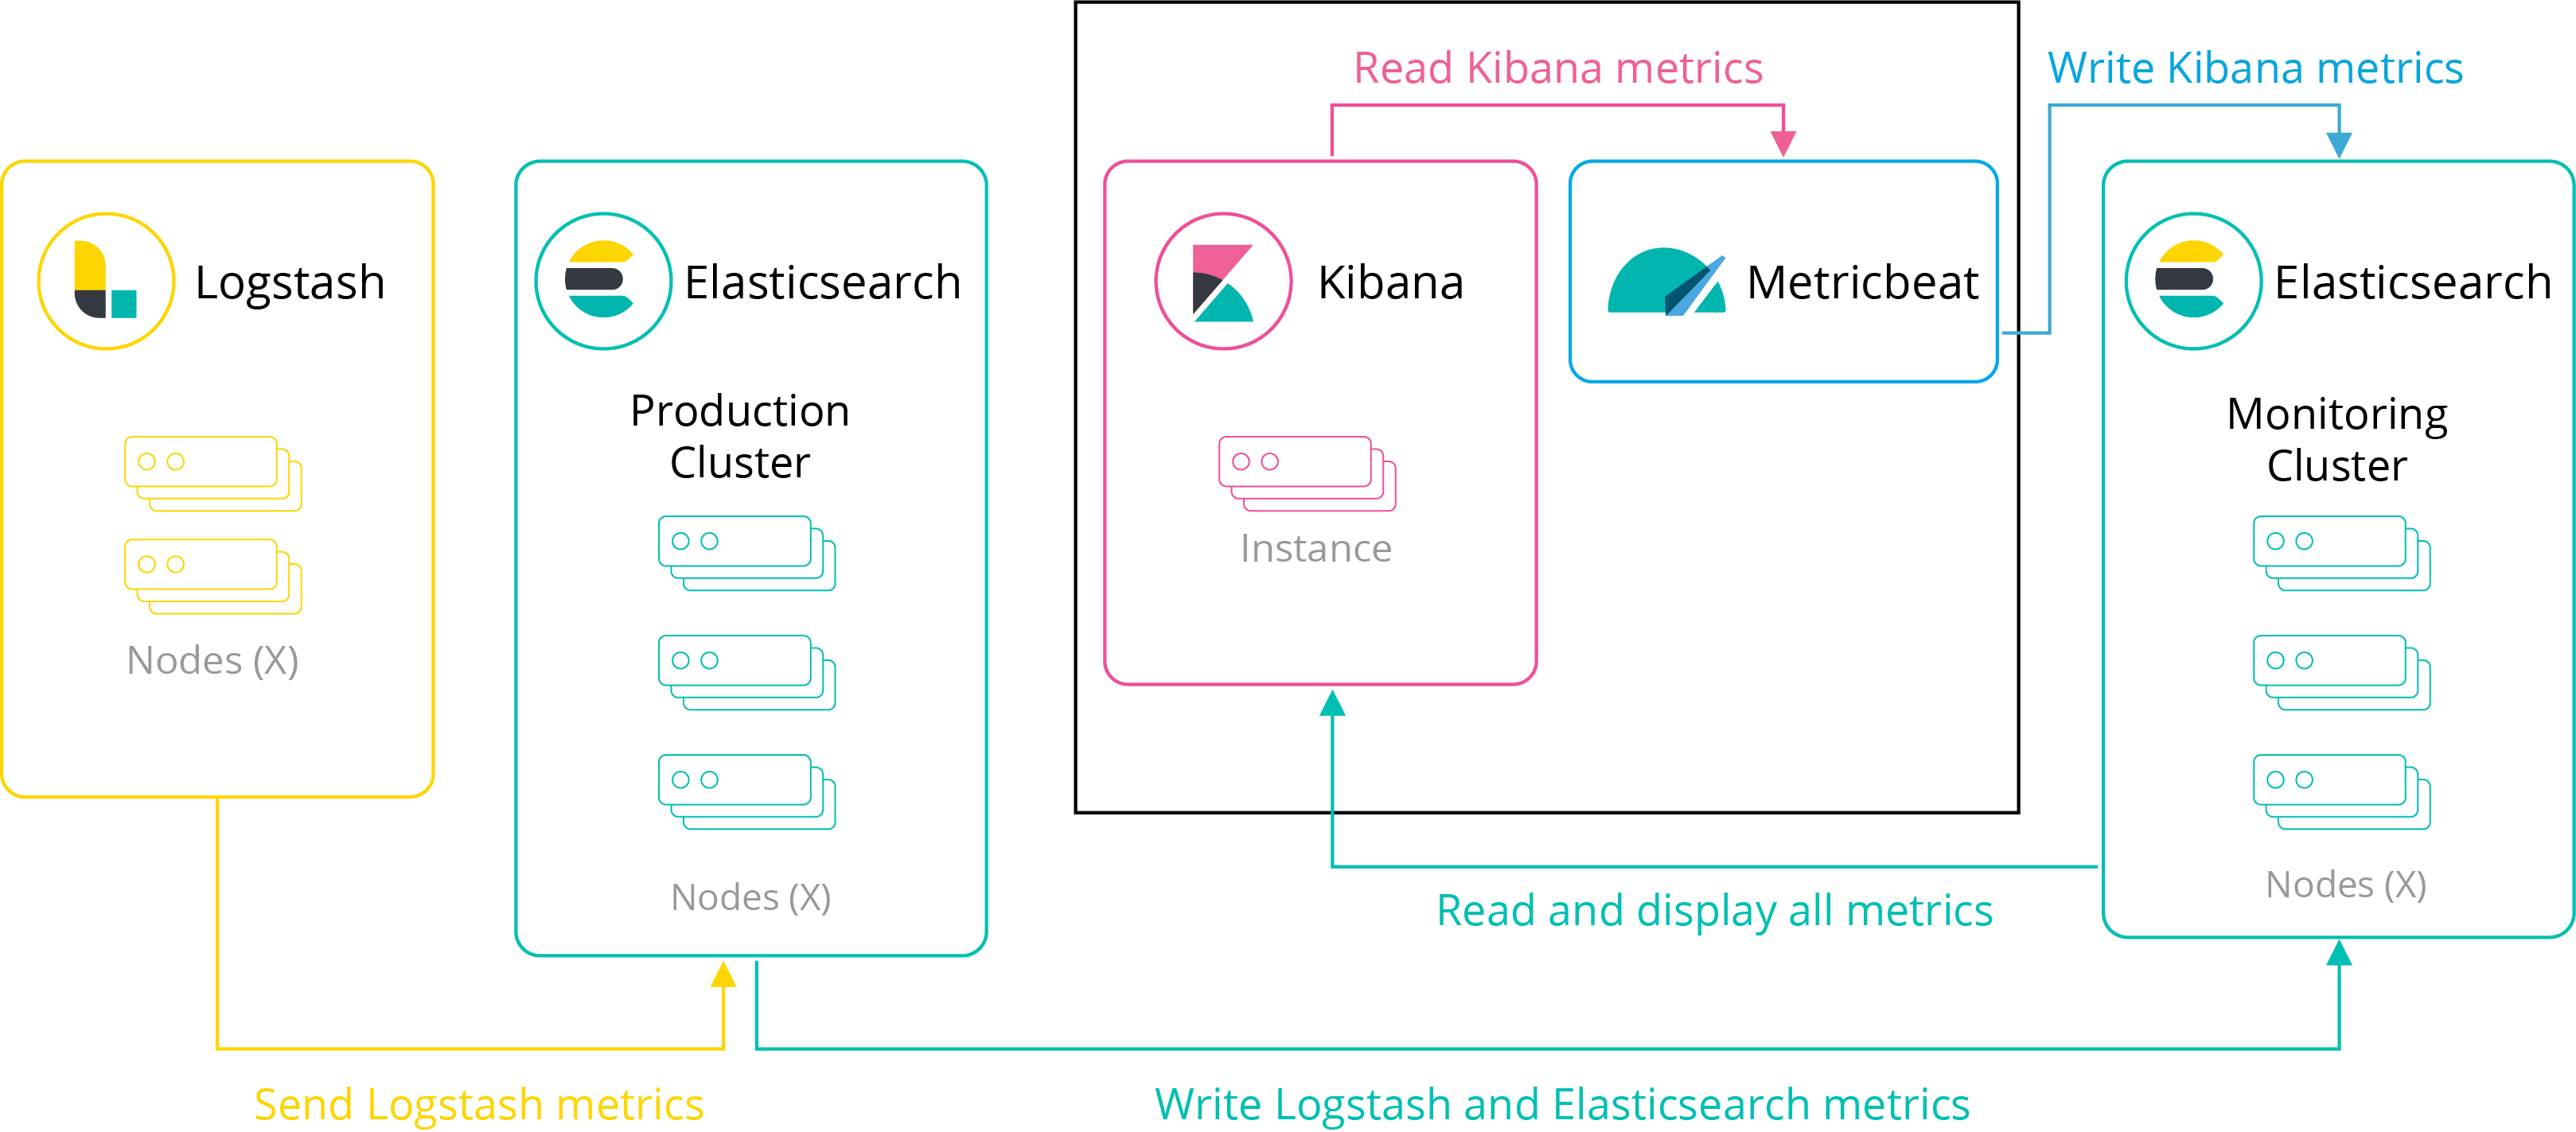
[beta] This functionality is in beta and is subject to change. The design and code is less mature than official GA features and is being provided as-is with no warranties. Beta features are not subject to the support SLA of official GA features. In 6.4 and later, you can use Metricbeat to collect and ship data about Kibana, rather than routing it through Elasticsearch. For example:
If you have the appropriate license, you can route data from multiple production clusters to a single monitoring cluster. For more information about the differences between various subscription levels, see: https://www.elastic.co/subscriptions
In general, the monitoring cluster and the clusters being monitored should be running the same version of the stack. A monitoring cluster cannot monitor production clusters running newer versions of the stack. If necessary, the monitoring cluster can monitor production clusters running older versions, but the versions cannot differ by more than one major version.