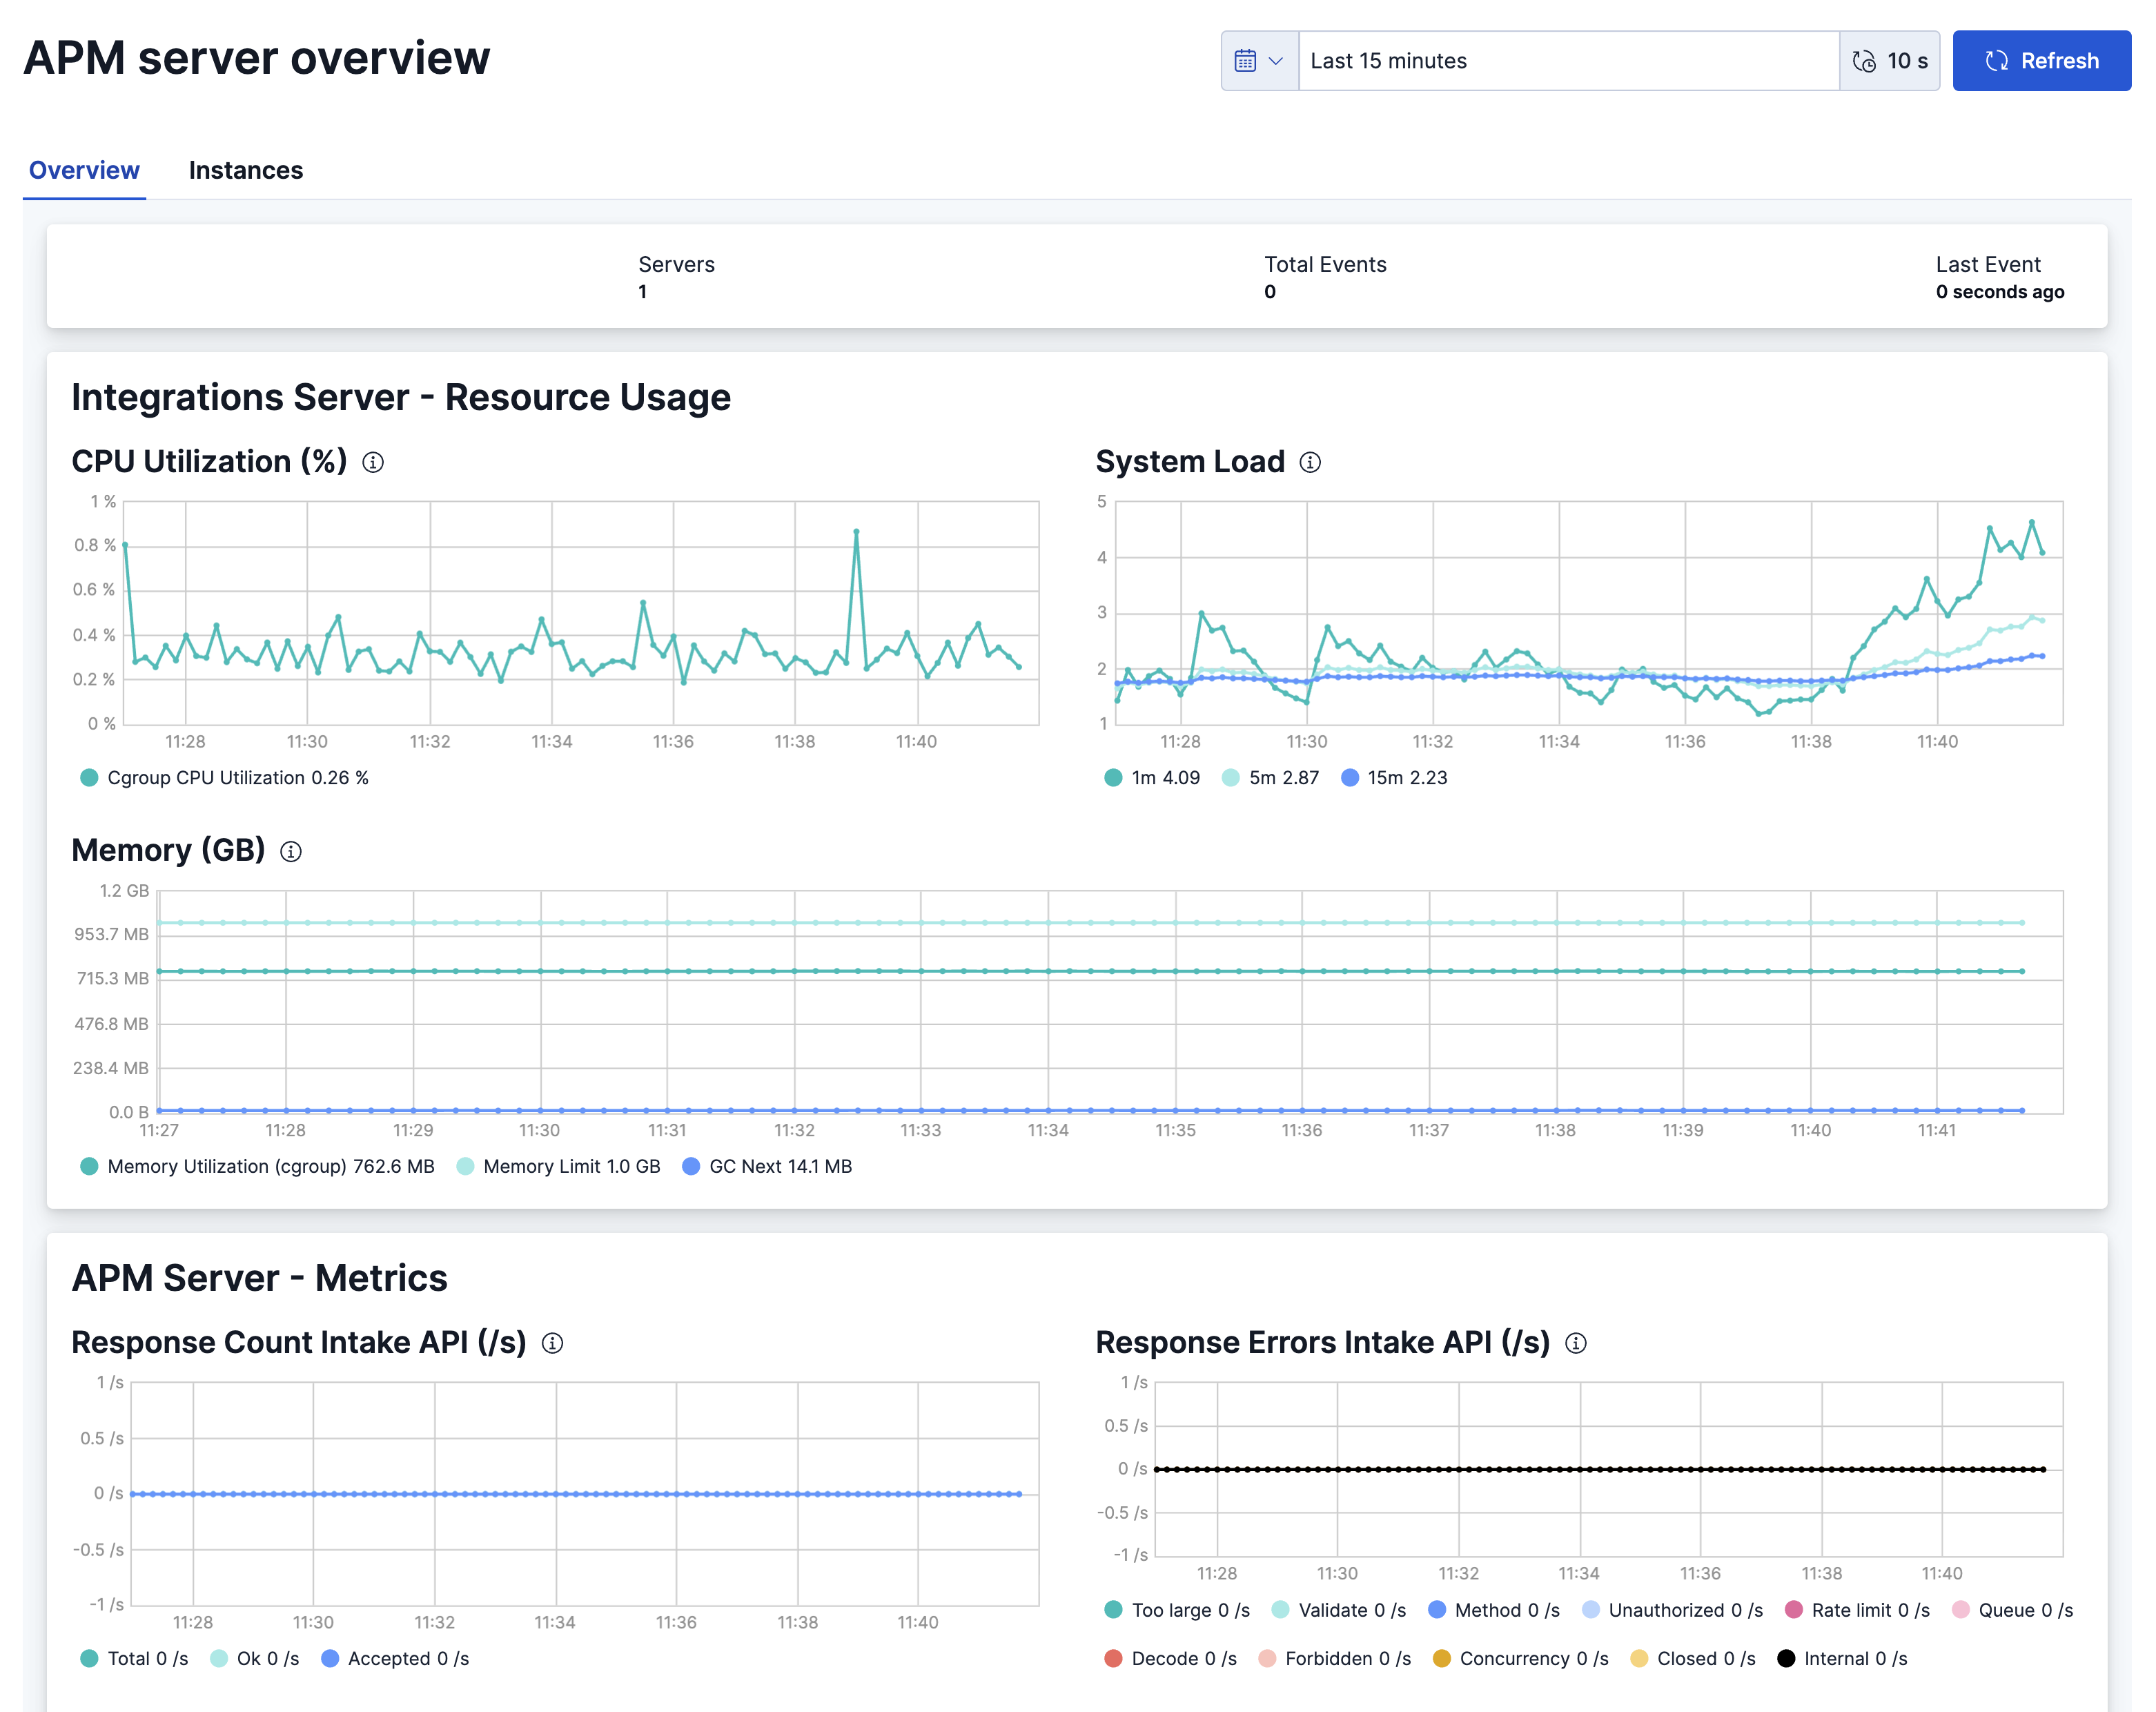
Integrations Server metrics
Integrations Server is available in Elastic Cloud Hosted and Elastic Cloud Enterprise deployments as a combined offering of Application Performance Monitoring (APM) Server and Fleet Server:
- Use APM Server to monitor your software services and applications in real time.
- Use Fleet Server to manage your Elastic Agents running on one or more hosts, and the policies that the agents run under.
To view an overview of Integrations Server health:
In the Integrations Server section of the Stack Monitoring page, click Integrations server overview.
The APM server overview page opens, showing both resource usage for Integrations Server and various metrics for APM Server.

Adjust the time period for the visualizations as needed.
From this page you can also create alerts to be triggered when the Integrations Server metrics meet a defined set of conditions.
To view metrics for a specific Integrations Server instance:
In the Integrations Server section of the Stack Monitoring page, click Integrations Servers.
The APM server instances page opens, showing the status of each instance, including both resource usage for Integrations Server and metrics data for APM Server.
Click the name of an instance to view its statistics over time.
Adjust the time period for the visualizations as needed.
As with the APM server overview page, you can also create alerts to be triggered when the instance metrics meet a defined set of conditions.