Protect your AWS workloads using Elastic Security


 Share on Twitter
Share on Twitter

 Share on LinkedIn
Share on LinkedIn

 Share on Facebook
Share on Facebook

 Share by Email
Share by Email

 Print this page
Print
It’s no secret that cloud service providers like AWS, Google Cloud, and Azure give teams incredible power and flexibility when it comes to delivering great solutions and user experiences to a global customer base. Leveraging the power of one or more clouds is often seen as a critical competency for an organization to succeed. This power of course comes with the added complexity of monitoring and securing cloud workloads — often running on multiple underlying technologies with varying levels of control, access, and exposure.
In this blog post, we focus on the approach that should be considered for securing AWS-based workloads and how Elastic Security can help security teams prevent, detect, and respond to threats in their AWS environment. Follow-up blogs will address other cloud providers including Google Cloud Platform and Microsoft Azure.
Establish visibility across your workloads
The first step to securing your cloud environment is to be able to observe and monitor your workloads. Having end-to-end visibility into all the different cloud services your teams rely on, with the ability to seamlessly correlate logs, metrics, and other telemetry across services is critical in building meaningful security detections.
The Elastic Agent is a single unified agent to help you onboard various data sources onto your Elastic deployment. This blog will leverage the Elastic Agent to collect data from your AWS environment for observability.
The Elastic serverless forwarder SAR (Serverless Application Repository) supports ingesting logs contained in the Amazon S3 bucket and sends them to Elastic. The SQS queue event notification on Amazon S3 serves as a trigger for the Lambda function. When a new log file gets written to an Amazon S3 bucket and meets the criteria, a notification is generated that triggers the Lambda functions.
Cloud visibility can be broadly categorized into the following areas:
Cloud platform
Implementing visibility into your environment should start with the cloud service provider platform. All AWS workloads, regardless of the technologies they use, will interact with and generate telemetry in this layer of the stack.
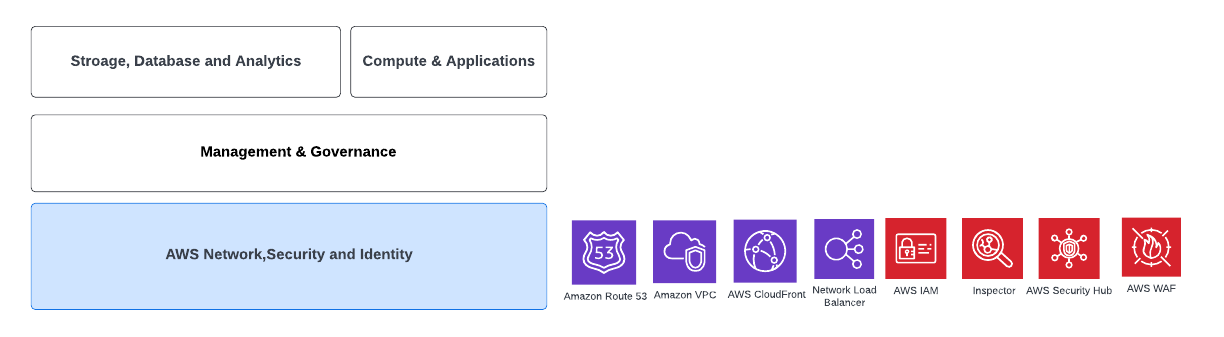
The following data sources should be collected at the AWS Network, Security, and Identity cloud platform level for security monitoring:
- Configure Cloudtrail logging for all critical AWS services including Identity and Access Management (IAM). Cloudtrail logs can then be collected using Elastic Agent for ingestion into the SIEM.
- AWS Web Application Firewall (WAF) integration: Process WAF logs in near-real time to identify security threats and specific requests based on parameters like cookies, host header or query string to understand why they are being blocked or allowed.
- Elastic and AWS Network Firewall integration: Maintain the reliability, availability, and performance of your AWS Network Firewall by logging and monitoring how the service is being used as well as network traffic and traffic filtering done by the stateful rule groups in your network firewalls.
- Elastic and Amazon Virtual Private Cloud (Amazon VPC): Quickly search, view, and filter Amazon VPC Flow Logs to monitor network traffic within your Amazon VPC with Kibana. Analyze the flow log data and compare it with your security group configurations to maintain and improve your cloud security.
Cloudtrail logs provide great visibility into key events of interest across AWS services for your security detections. The following screenshot shows an alert indicating the deactivation of an MFA device associated with an AWS user.
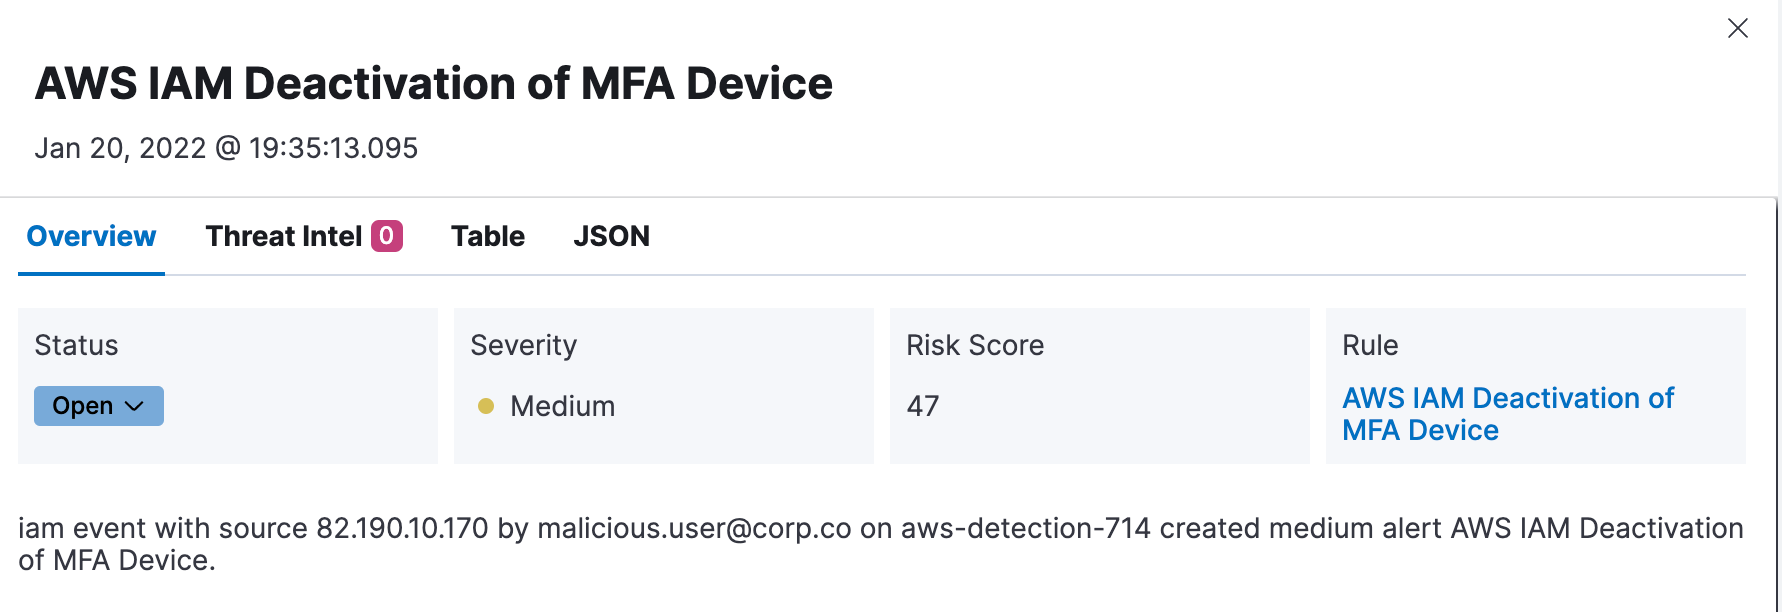
This can be an instance of security policy non-compliance, or potentially an attempt by an attacker to establish persistence or disrupt access to your AWS account. Collecting these logs and using out-of-the-box security rules can be a great way to detect such activity.
Cloud-native workloads
The cloud-native approach to architecting applications takes full advantage of the cloud computing model. This includes:
- Running applications as containers, portable across your infrastructure
- Using orchestration platforms like Kubernetes to deploy and scale your applications across your infrastructure
- Leveraging managed services for things like object storage, relational databases, key value stores, etc.
- Defining infrastructure as code and automating the deployment and maintenance of your workloads
While this model gives teams the ability to very quickly innovate, scale and deliver value to customers, it also introduces some complexity when it comes to observing and securing such workloads. The difference being, your application is now distributed across multiple underlying systems and platforms — some of which are managed by your cloud service provider on your behalf.
Observing each layer of your technology stack, including any SaaS or cloud platform dependencies, is critical. Meaningful security detections need to be able to correlate and stitch together the data from the various underlying components to protect your workloads.
Consider monitoring the following layers of your application using Elastic Agent:
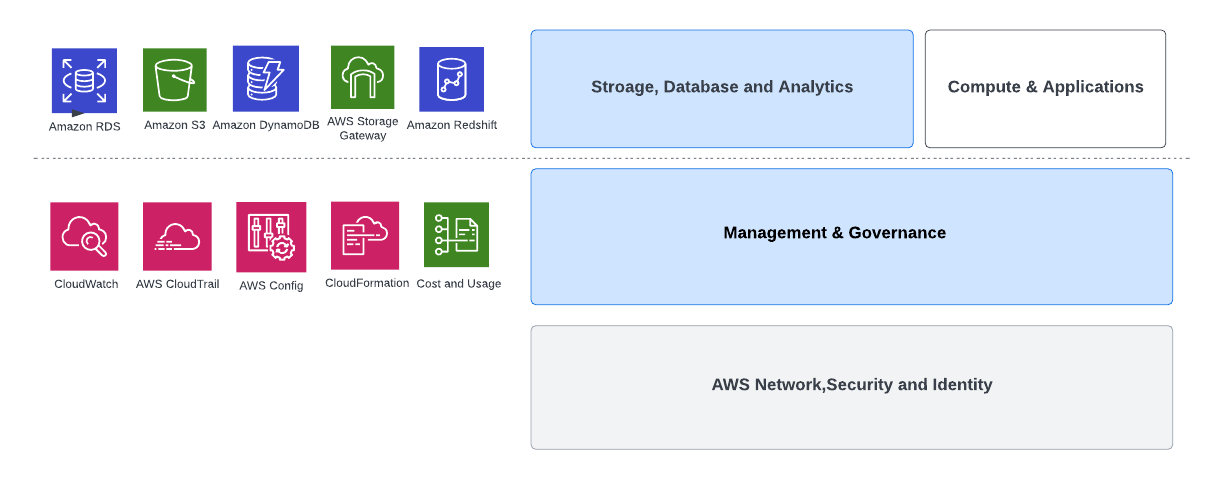
- Cloudwatch and Cloudtrail logs
- AWS storage, database, and analytics metrics for the services you rely on (e.g., S3, EBS, RDS, DynamoDB, Storage gateway, etc.)
- AWS Usage data to help teams understand AWS service footprint and changes in usage patterns
All data sources onboarded using the Elastic Agent are automatically transformed into a common schema. This makes it easy to search and correlate across data sources, while also simplifying downstream use cases like dashboards and detections.
Cloud-hosted workloads
Cloud-hosted workloads generally refer to applications or services that leverage core compute, storage, and networking services on cloud infrastructure. These look a lot like traditional or on-premise workloads from an architecture perspective and may be a result of lifting and shifting as part of a cloud migration journey.
Refactor or re-architect cloud migration strategies involve rewriting entire applications from scratch to make them cloud-native. This method allows customers to realize the full potential of cloud-native technologies like microservices architecture, serverless, and containers. Take, for example, an EC2 instance running an Nginx web server hosting a simple web app or applications running on lambda functions(serverless) or containers (microservices).
Monitoring such workloads is relatively simple with Elastic Agent. The agent automatically collects logs and metrics at the host level. Integration modules on the agent can be used to collect data from any additional applications such as Nginx and MySQL running on the instance.
Install Elastic Agent on your cloud instances and enable integration modules as appropriate for your environment using the Fleet application on Kibana. You can automate the installation of Elastic Agent as your instances are provisioned.
From a security perspective, the following integrations should also be considered to bring in additional visibility:
- Audit package to collect logs generated by the audit daemon on Linux. The audit daemon records important security and file access events on the host for your security detections.
- Network Packet Capture package can collect network traffic data on your cloud instances. The package can be configured to decode select protocols on your hosts, depending on the workloads being run, to provide additional visibility into the network.
- Linux Metrics package can collect Linux OS specific metrics from the host
- Windows package can collect Windows specific logs and metrics from the host
- Osquery Manager package to run live osquery requests on your endpoints during security investigations or incident response workflows
It is important to consider the level of visibility you would need depending on the host or instance you are monitoring. For example, while network packet captures can be a great way to get additional visibility into key, mission-critical compute instances using specific network protocols, the approach wouldn’t scale for your entire environment. The same considerations should be applied to security logs and telemetry that you can get out of the integrations provided in this blog.
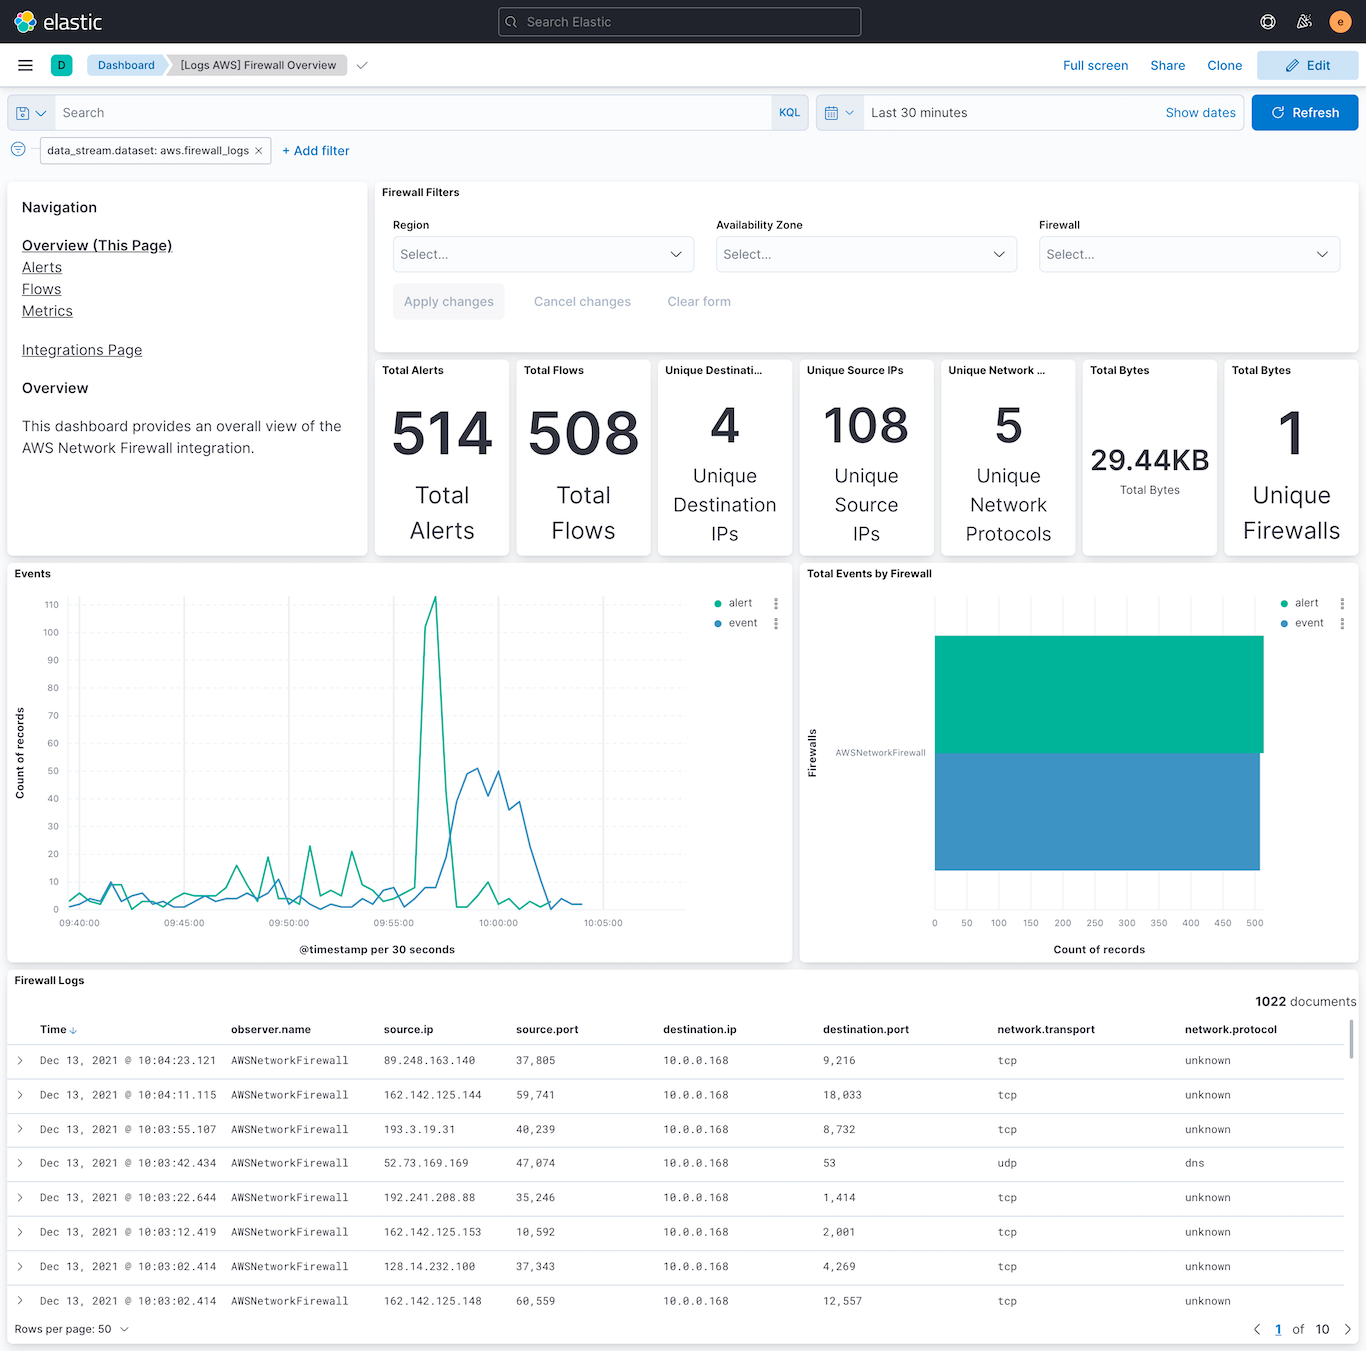
The following dashboard shows data from a Network Firewall to help security teams understand alerts and flow logs on the Network firewall. This is useful for both security detections and hunting/investigation.
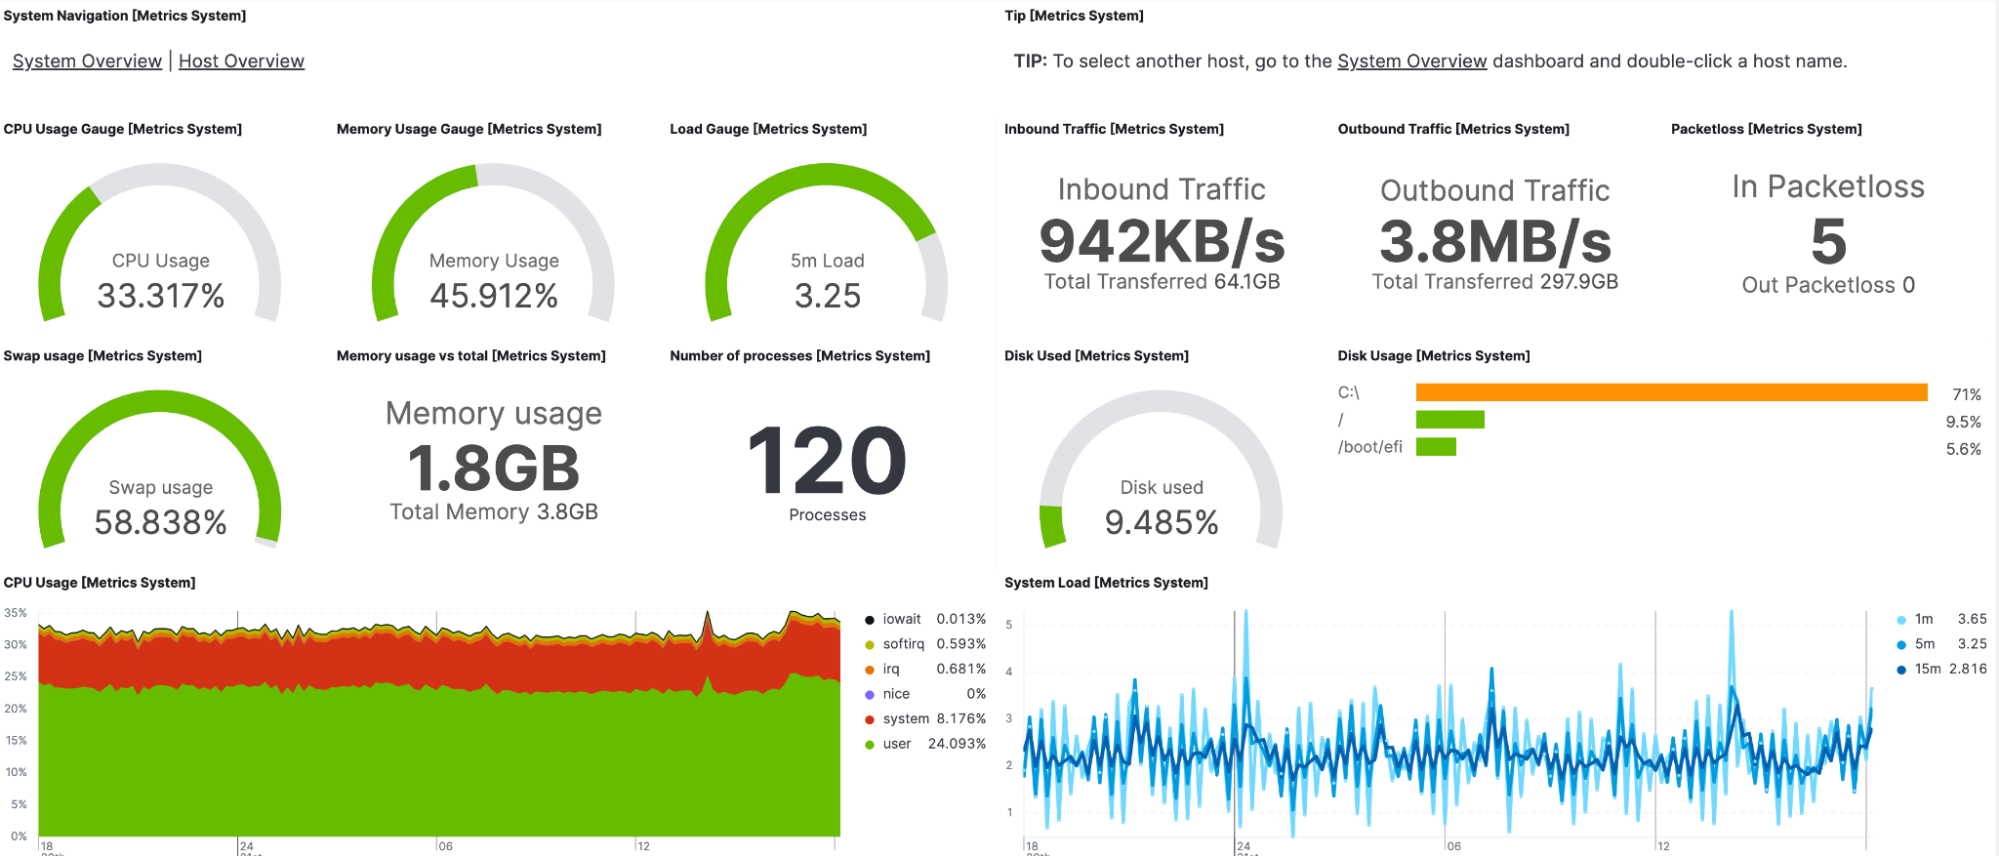
The following dashboard shows data from a Linux host to help security teams understand activities and usage profiles on the host. This is useful for both security detections and hunting/investigation workflows.
Protect cloud instances with endpoint security
Cloud service providers like AWS refer to the shared responsibility model when it comes to operating and protecting your mission critical workloads. Despite the prevalent use of managed services, many cloud environments still maintain a sizable footprint of EC2 instances that serve important functions.
Endpoint detection and response capabilities help secure your cloud instances by:
- Providing in-depth visibility and monitoring into the activities happening on your instances
- Protect endpoints from common malware- or ransomware-based attacks
- Analyze machine and human behaviors to detect and prevent malicious activity
Thanks to the granular level of host visibility and instrumentation, alerts generated by Endpoint Security come with rich contextual information to help analysts quickly understand and remediate potential threats. This endpoint context can of course quickly be correlated with AWS platform-related activity to create high fidelity detections across your environment.
The Visual event analyzer view is an example of this in-depth endpoint telemetry in action. Being able to visualize process lineage, alongside network, file, and registry activity for each sub-process is a powerful tool for security analysts when investigating an alert.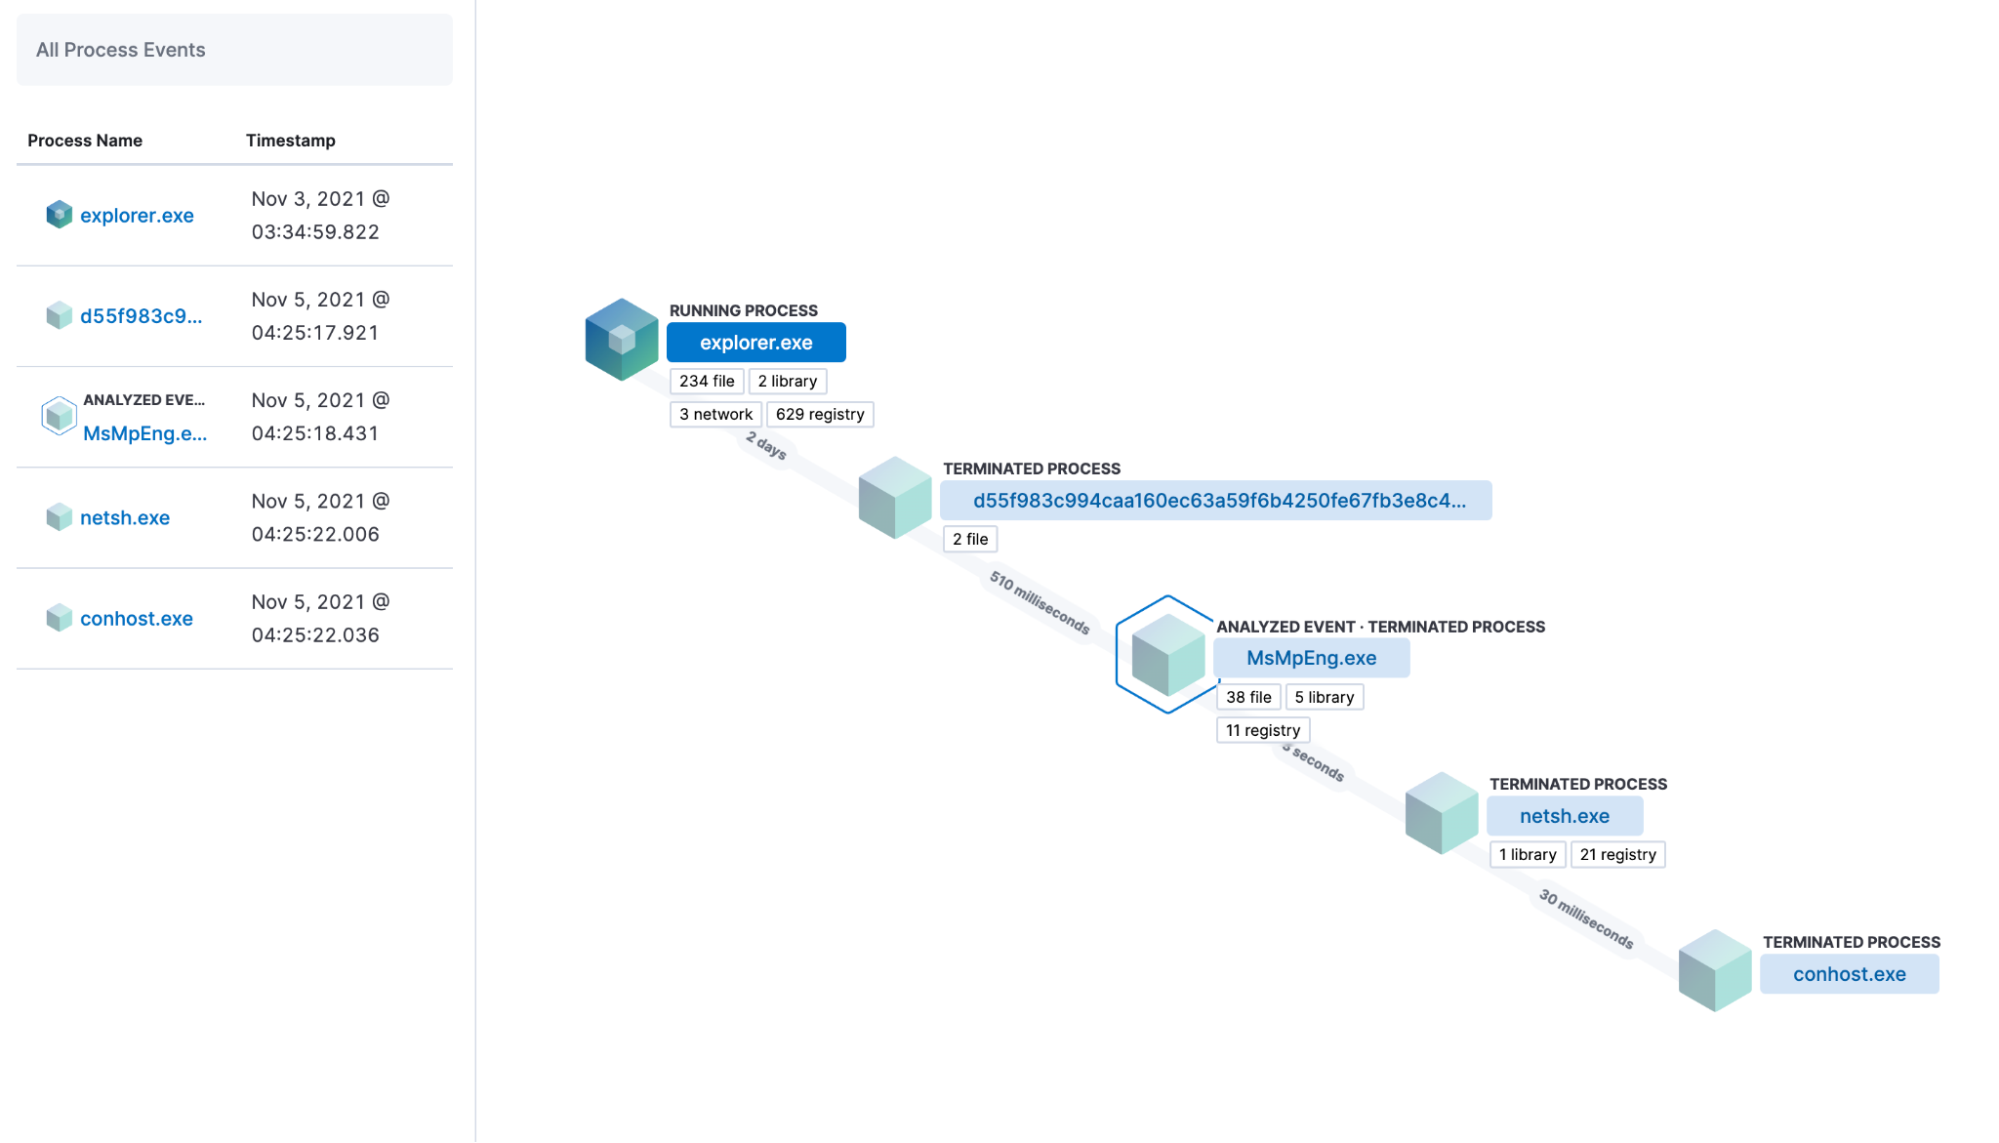
The Endpoint Security integration can be used to configure and activate endpoint security controls on your EC2 instances in your environment. Review the endpoint security documentation guide for a detailed walkthrough on endpoint security solutions and features and configuration options available.
Develop security detections and use cases
Once you’ve established visibility across your cloud assets, it is worth thinking about the various detections and security use cases you want to build to quickly identify and respond to security threats. Elastic Security ships with 600+ out-of-the-box detections aligned with Elastic Agent integration sources. This includes a number of detections designed specifically for AWS workloads. These prebuilt detections offer a great starting point for any blue team or SOC to establish basic detection capabilities.
Security detections on Elastic are mapped to the MITRE ATT&CK® framework to help analysts easily map detections to attack surface and external controls, contextualize detection logic, and understand the course of remediation for alerts.
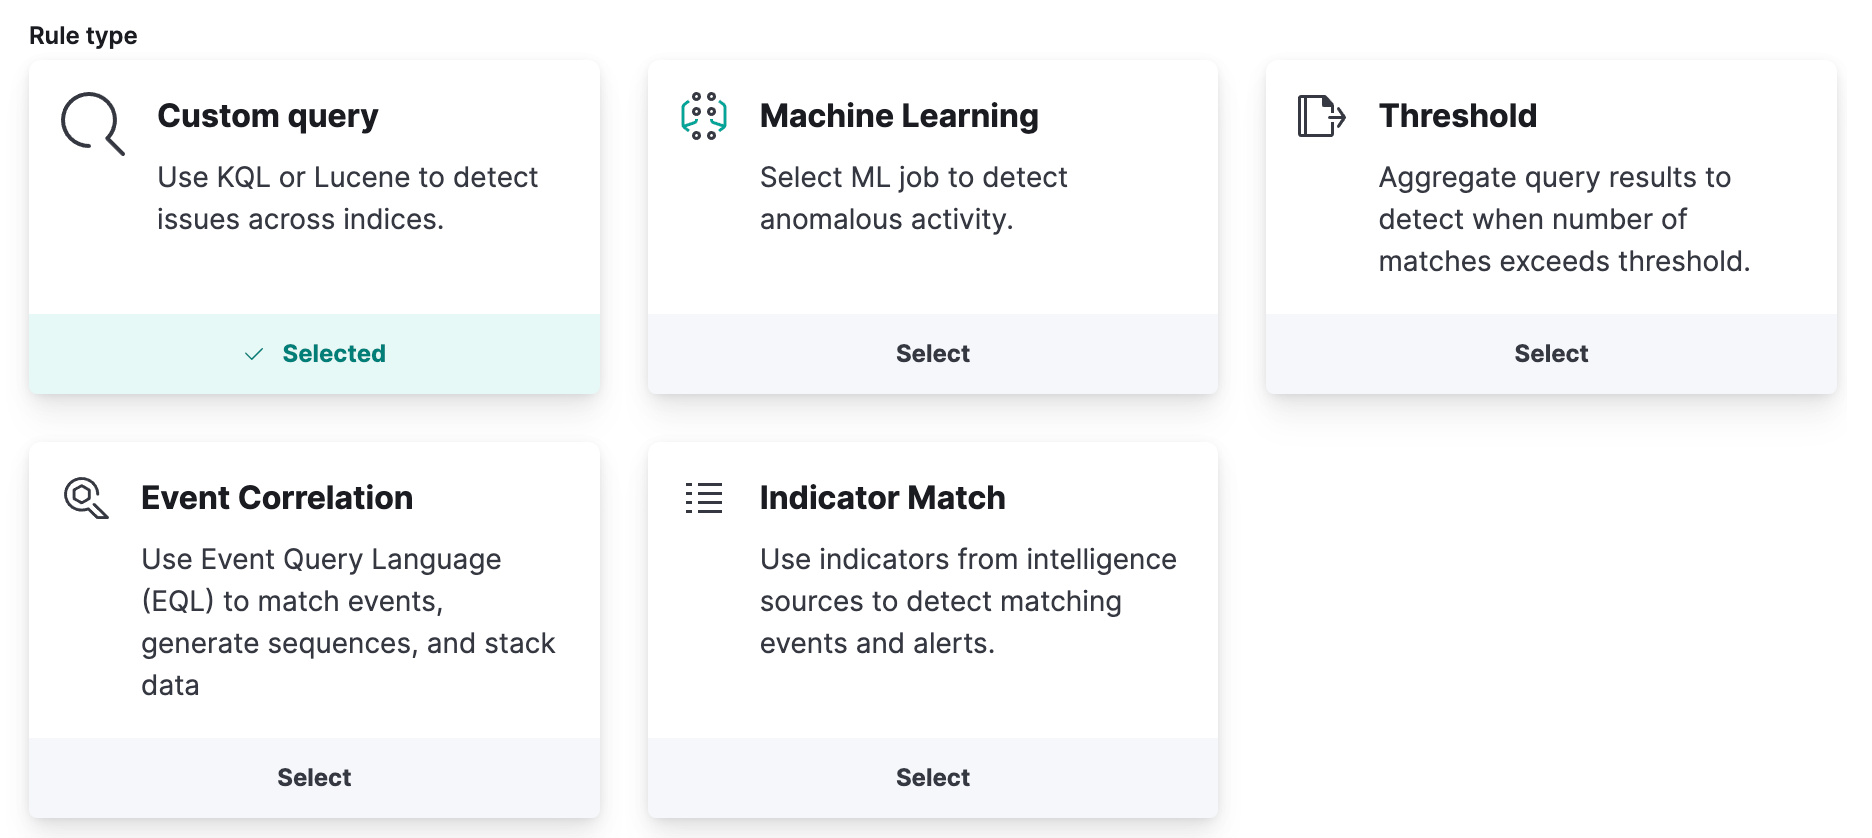
Teams can also complement out-of-the-box rules with custom detections tailor-made for their environment. Custom detection rules on Elastic SIEM cater for a wide range of use cases:
- A custom query can detect a specific event or issue across your data (did this event happen?)
- Detections can be triggered by a machine learning job detecting an anomaly in one of your data sources (did something anomalous happen?)
- Threshold detections can evaluate aggregated datasets to trigger a detection (did something happen more than 10 times in the last two minutes?)
- Event correlation rules can look for a precise sequence of events in your data to trigger a detection (did a user log into the system successfully after three failed attempts in the span of two minutes?)
- An indicator match rule can look for the occurrence of indicators of compromise in your data
Elastic customers often also leverage additional community contributed detection rules such as Sigma to supplement their out-of-the-box rules.
Conclusion
Elastic Security gives organizations the ability to easily observe and protect both cloud-native as well as hosted workloads using the unified Elastic Agent. The agent can not only ingest cloud based data for security monitoring, but also protect cloud compute instances with state-of-the-art endpoint security capabilities. Teams can also leverage purpose-built, out-of-the-box detection rules for AWS environments and supplement engineer custom detection rules to detect and respond to complex security threats.
If you haven’t checked out the Elastic Security solution, take a look at our Quick Start guides (bite-sized training videos to get you started quickly) or our free fundamentals training courses. Take advantage of a 7-day free trial directly from the AWS Marketplace and deploy Elastic in minutes. Or download the self-managed version of the Elastic Stack for free.
Share
- Share on Twitter
Share on Twitter
- Share on LinkedIn
Share on LinkedIn
- Share on Facebook
Share on Facebook
- Share by Email
Share by Email
- Print this page
Print