Elastic Agent and Fleet make it easier to integrate your systems with Elastic
Today, we are happy to announce three major improvements that will make it easier to integrate your systems and applications with the Elastic Stack. First, we are launching the generally available (GA) release of our Elastic Agent, which is a single, unified agent for both observability and security. A unified agent will simplify data onboarding with fewer things to configure and install.
Second, we are launching the GA release of Fleet, a new Kibana app that lets you centrally manage an entire fleet of Elastic Agents at scale. It acts as a control plane, giving you a real-time view into agent status, remotely upgrade agents, execute queries on each host, and contain security threats.
Third, we are launching our new Integrations app in Kibana along with our first set of GA integrations. In a single click, you can integrate your systems and applications with the Elastic Stack. Integrations provide out-of-the-box log parsing, dashboards, machine learning jobs, and more. You can deploy integrations on Elastic Agents through Fleet, letting you go from data to insight in seconds.
The challenges of ingesting data at scale
A critical challenge when adopting a monitoring or security solution is the time it takes to deploy agents and manage them at scale. This delays critical business objectives and adds to your total cost of ownership. Large organizations may have hundreds of teams and hundreds of thousands of servers, laptops, and applications. It can take months to go through evaluation, customization, operations and security compliance approvals, then deployment across multiple teams and environments. Any problem in the monitoring or security infrastructure can have a dramatic and critical impact on the business.
Beats are our existing solution for shipping data to the Elastic Stack and they make many things easier over generic solutions like syslog. However, we currently have a total of seven Beats in addition to APM agents, APM server, endpoint security, and more. Installing this many binaries is complex, particularly in enterprise environments where each binary involves installation via configuration management solutions, progressive deployments, change management, and audit requirements.
Another challenge is the process of adding integrations for new data sources. Today, users must edit YAML files and upload them to all their servers. They often use tools like Ansible or Chef to push out configurations. Unfortunately, this makes adding a new data source a complex process that often requires third-party tools and coordinating with specialists across teams. This is even more complex when dealing with hundreds of thousands of agents spread across multiple networks and data centers.
One agent to rule them all
Elastic Agent is a single, unified agent for logs, metrics, APM traces, synthetics, and securing your system. Getting started is as simple as running a single command to install the agent. You no longer need to deploy multiple Beats. This will make it quicker to deploy across your infrastructure and maintain over time. Additionally, Elastic Agent has a single, unified configuration managed through a single pane of glass. Thus, there is no need to edit multiple configuration files for Filebeat, Metricbeat, and others. This will make it much easier to add integrations. You can update the configuration through Fleet, allowing you to quickly enable integrations, ingest data, and customize the agent’s behavior.
Easier integrations and configuration
The new Integrations app provides a web-based UI in Kibana to add and manage integrations for popular services and platforms. Our integrations not only provide an easy way to add new sources of data, but they also ship with out-of-the-box assets like dashboards, visualizations, and pipelines to extract structured fields out of logs. You don’t need to spend a lot of effort configuring the system because it’s done for you automatically. This makes it easier to set up and get insights within seconds.
Our new GA integrations allow you to monitor system infrastructure including servers, laptops, containers, VMs and more. You can also protect your systems from security threats and analyze security events. There are over 70 integrations available and we are continuously working to add more.
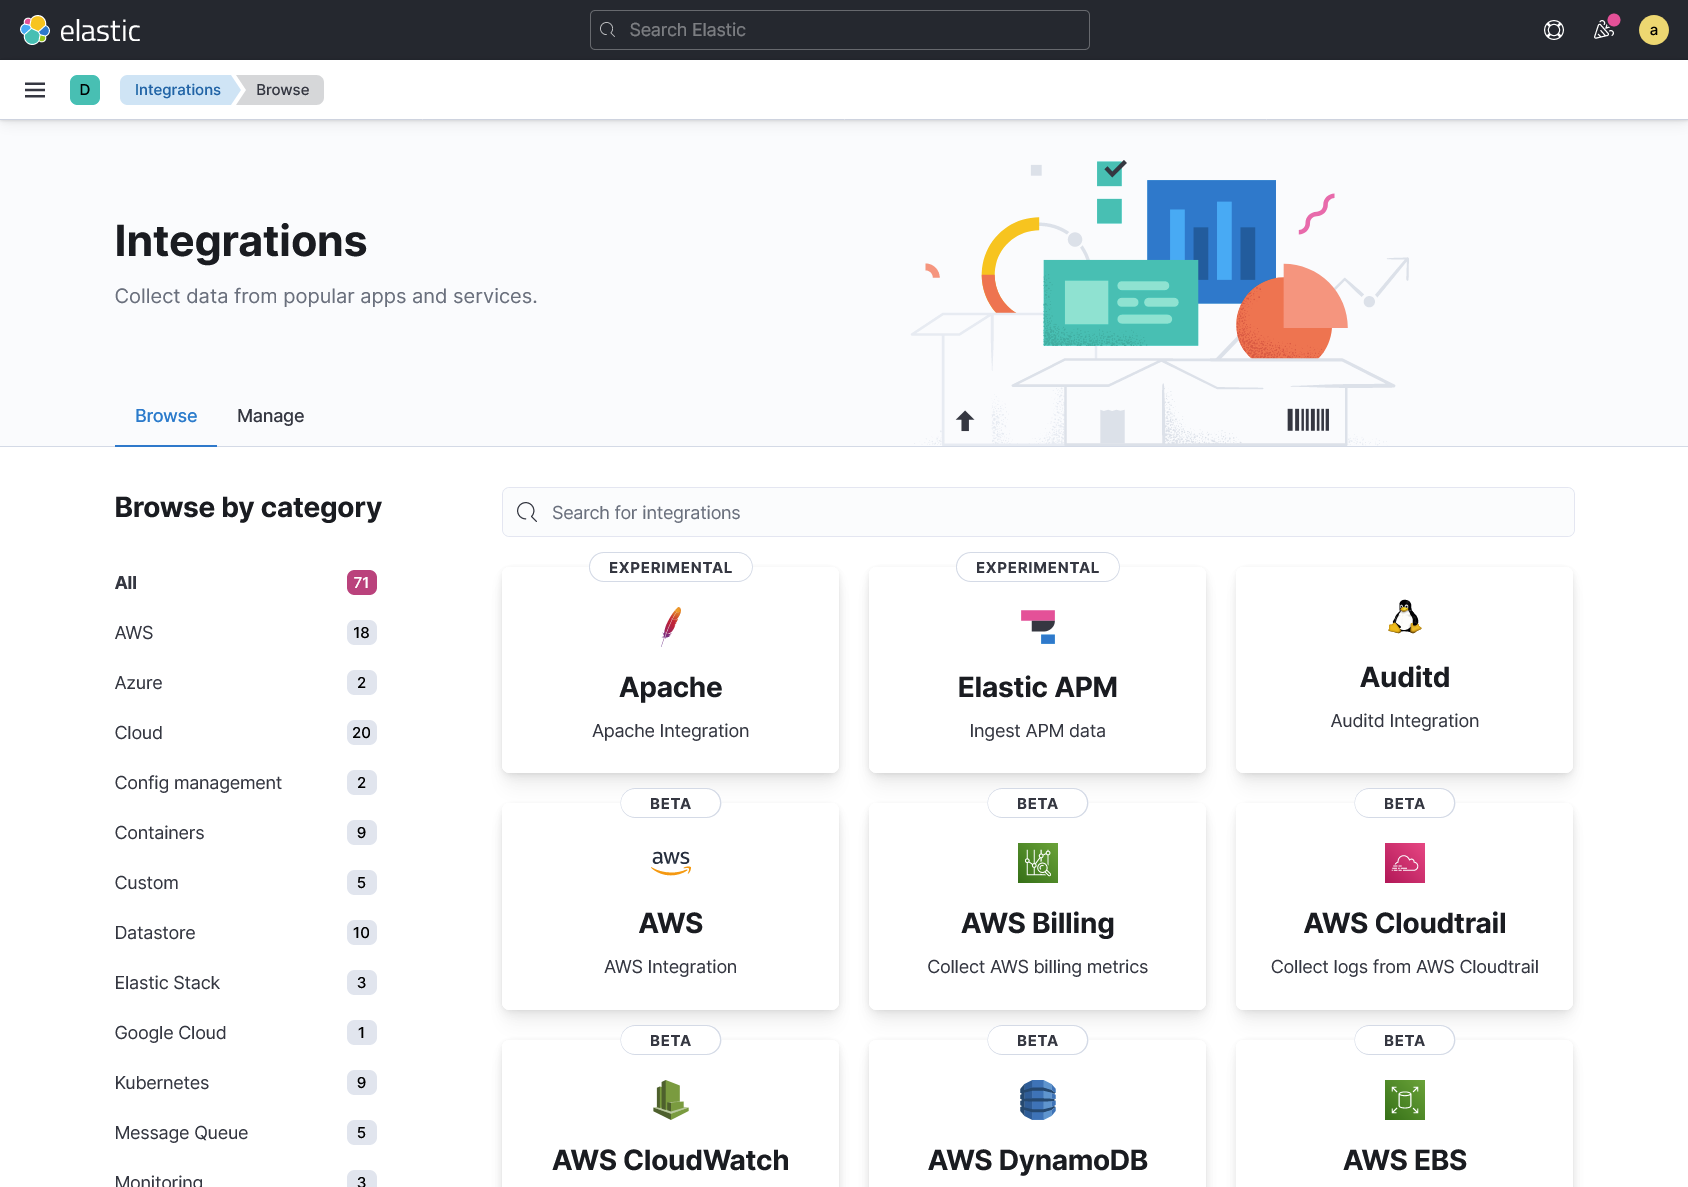
We also provide a web-based UI to configure integrations for your systems and applications. Instead of editing long YAML files with many irrelevant settings, the web UI is more concise and offers guidance and validation. Default values are already provided for common log and metric locations, so you can just click save to deploy the integration in a single click.
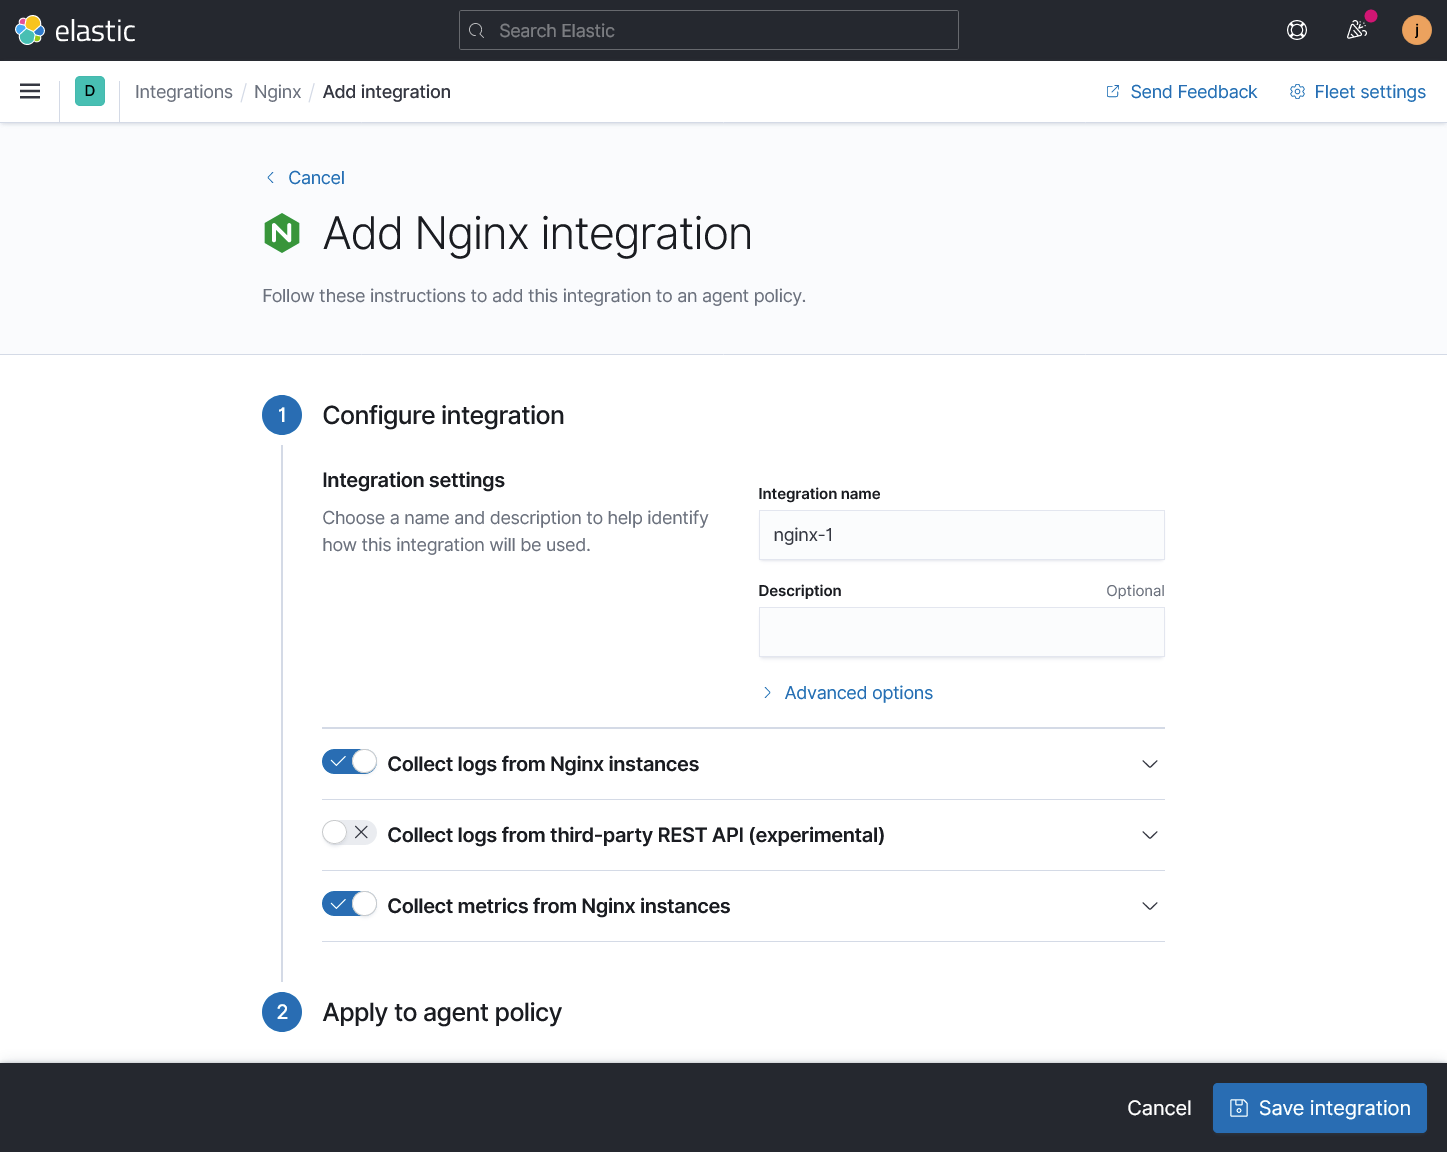
You can choose to add this Nginx integration to a single agent or a group of agents as part of a policy. An agent policy lets you apply the same integration on any number of agents, which makes it easier to manage many agents at scale. The agents will receive the update next time they check in to the Fleet.
Advanced users sometimes prefer YAML files, APIs, and infrastructure as code (IaaC). Fleet has an API-first design and anything you can do in the UI you can also do using the API. This allows you to integrate with other systems. If you prefer not to use Fleet, you can also configure Elastic Agent with a YAML file in standalone mode.
Centrally manage your Fleet
Fleet serves as the control plane allowing you to centrally manage large groups of agents. You can see the state of all your agents on the Fleet page. Here you can see which agents are online and healthy, which are unhealthy, and the last time they checked in. You can also see the version of the agent binary and agent policy.
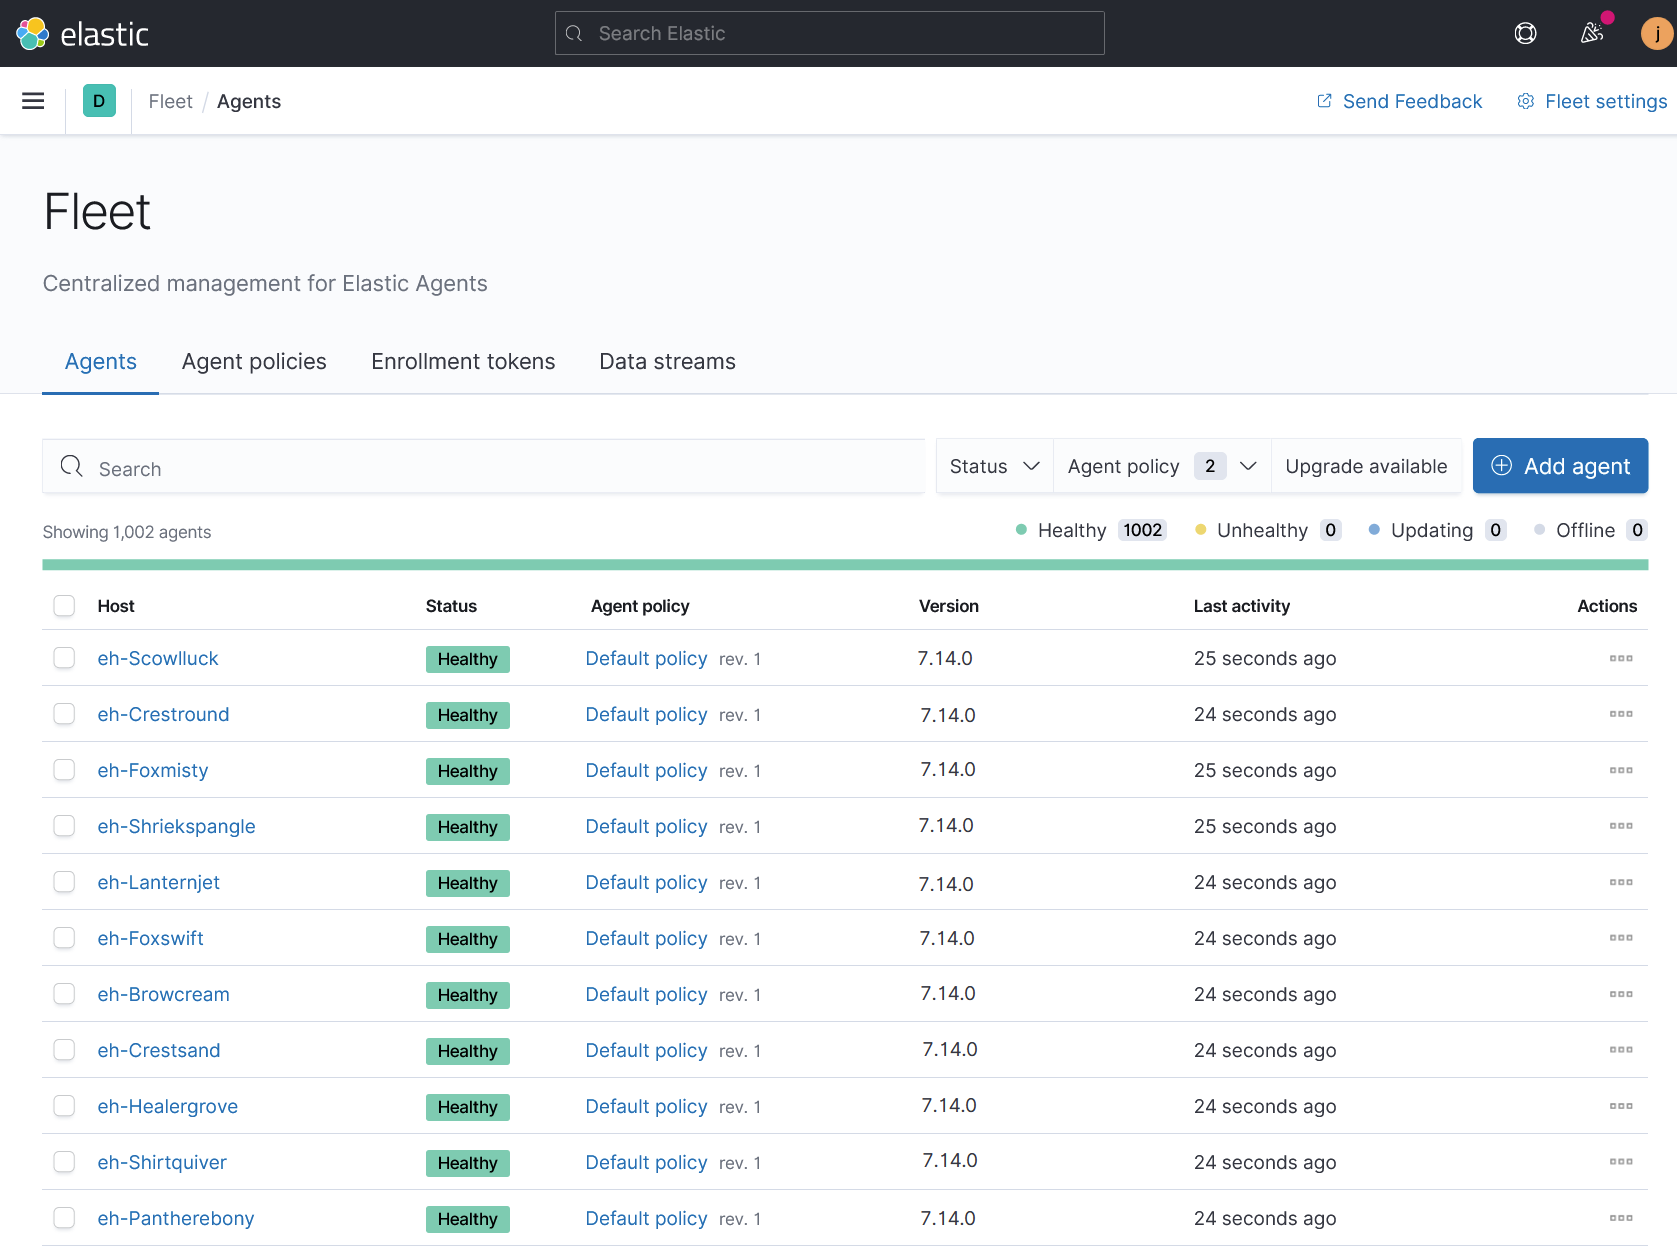
You can define groups of agents using agent policies. When you make a change to an agent policy, all the agents receive the update during their next check in. You no longer have to distribute updates yourself using SSH, Ansible playbooks, or other configuration methods.
Another advantage of Fleet is that we can better secure agents. It automatically generates Elasticsearch API keys for each agent with minimal permissions for the integrations that are running. The API keys can be revoked on a per-agent basis and you no longer need to store shared credentials with broad permissions on each host. Also, when you run Elastic Agent with Endpoint Security, the agent can protect itself from threats running on the host.
Fleet Server is the infrastructure component that manages communication with Elastic Agents. It provides the control plane that updates agents and instructs them to execute actions like running OSQuery across hosts or isolating hosts at the network layer to contain security threats. It can be deployed centrally or on the edge in private networks.
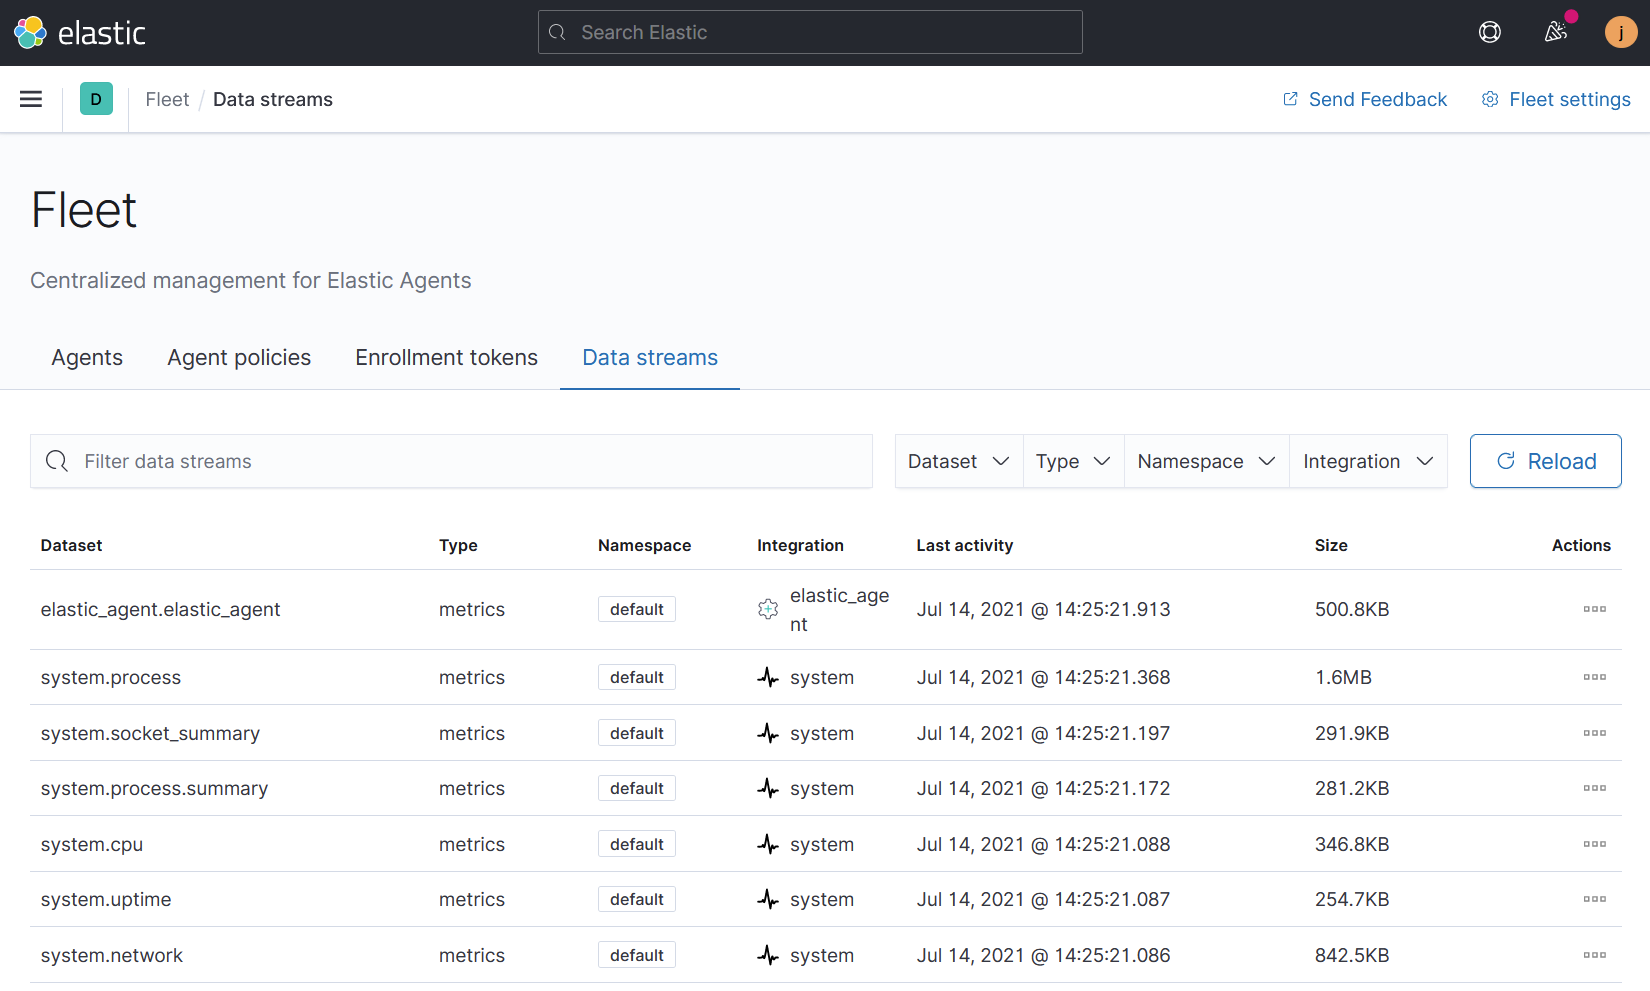
Data streams make data management easier
The data collected by Elastic Agents is stored using the new data stream naming scheme. It stores data in more granular indices than Beats did. The advantages include a smaller number of fields per index, faster autocomplete, more efficient storage, more visibility into the sources of data volume, and control over lifecycle management policies and index permissions. Namespaces allow you to group data any way you like, such as by environment or team name.
What does this mean for Beats users?
Beats are not going away anytime soon and you can continue using them alongside Elastic Agent. You might run both in parallel while you switch systems from Beats to Elastic Agent.
While Elastic Agent and Fleet are much easier to use, there are still a few times when it’s better to use Beats — and we will close these gaps over time. Fleet does not yet support output to Logstash or Kafka, it requires the superuser role, and it also requires an internet connection to download the list of integrations from the Elastic Package Registry. We are also working to convert several remaining Beats modules to integrations. Check our comparison page to learn more about the differences.
Try it out
Try it out for yourself by opening Kibana and navigating to the Integrations app in the main menu. Here you can see a list of integrations and the app will guide you through the process of adding Elastic Agents. Alternatively, you can open the Fleet app to add Elastic Agents directly.
Elastic Agent and Fleet are both free and open. We would like to encourage collaboration with the community so you can find the code on GitHub for Fleet and Elastic Agent. We’re looking forward to including the community with us on this journey.
We hope this release shows how we’re making it easier to integrate your systems and applications with the Elastic Stack. It will get even better over time with your feedback, so please share your thoughts in our Discuss forum.