From data to insights: Predicting workout types in Strava with Elasticsearch and data frame analytics


 Share on Twitter
Share on Twitter

 Share on LinkedIn
Share on LinkedIn

 Share on Facebook
Share on Facebook

 Share by Email
Share by Email

 Print this page
Print
This is the seventh and final blog post in our Strava series (don’t forget to catch up on the first, second, third, fourth, fifth, and sixth)! I will take you through data onboarding, manipulation, and visualization.
What is Strava, and why is it the focus? Strava is a platform where recreational and professional athletes can share their activities. All my fitness data from my Apple Watch, Garmin, and Zwift is automatically synced and saved. If I want to get an overview of my fitness, getting the data out of Strava is the first step.
Predict the Strava type
There is one additional set of features available in the machine learning space in Elastic, and this one is known as Data Frame Analytics.
We want to run a Classification Job. Based on the values of the documents, we want the model to tell us if this is a Ride, VirtualRide, Hike, Run, Yoga, or something entirely else.
We first need to define the dependent variable, often known as y. Leverage the summary index again and set it to strava.type.
After that, it will autoselect all possible fields in the index. We don’t want that, so we deselect all of them. I want the model to determine the type correctly by using distance and elevation gain only. Give it a name, and let it run!
Let us go through the following page step by step. I know there is a lot to unpack.
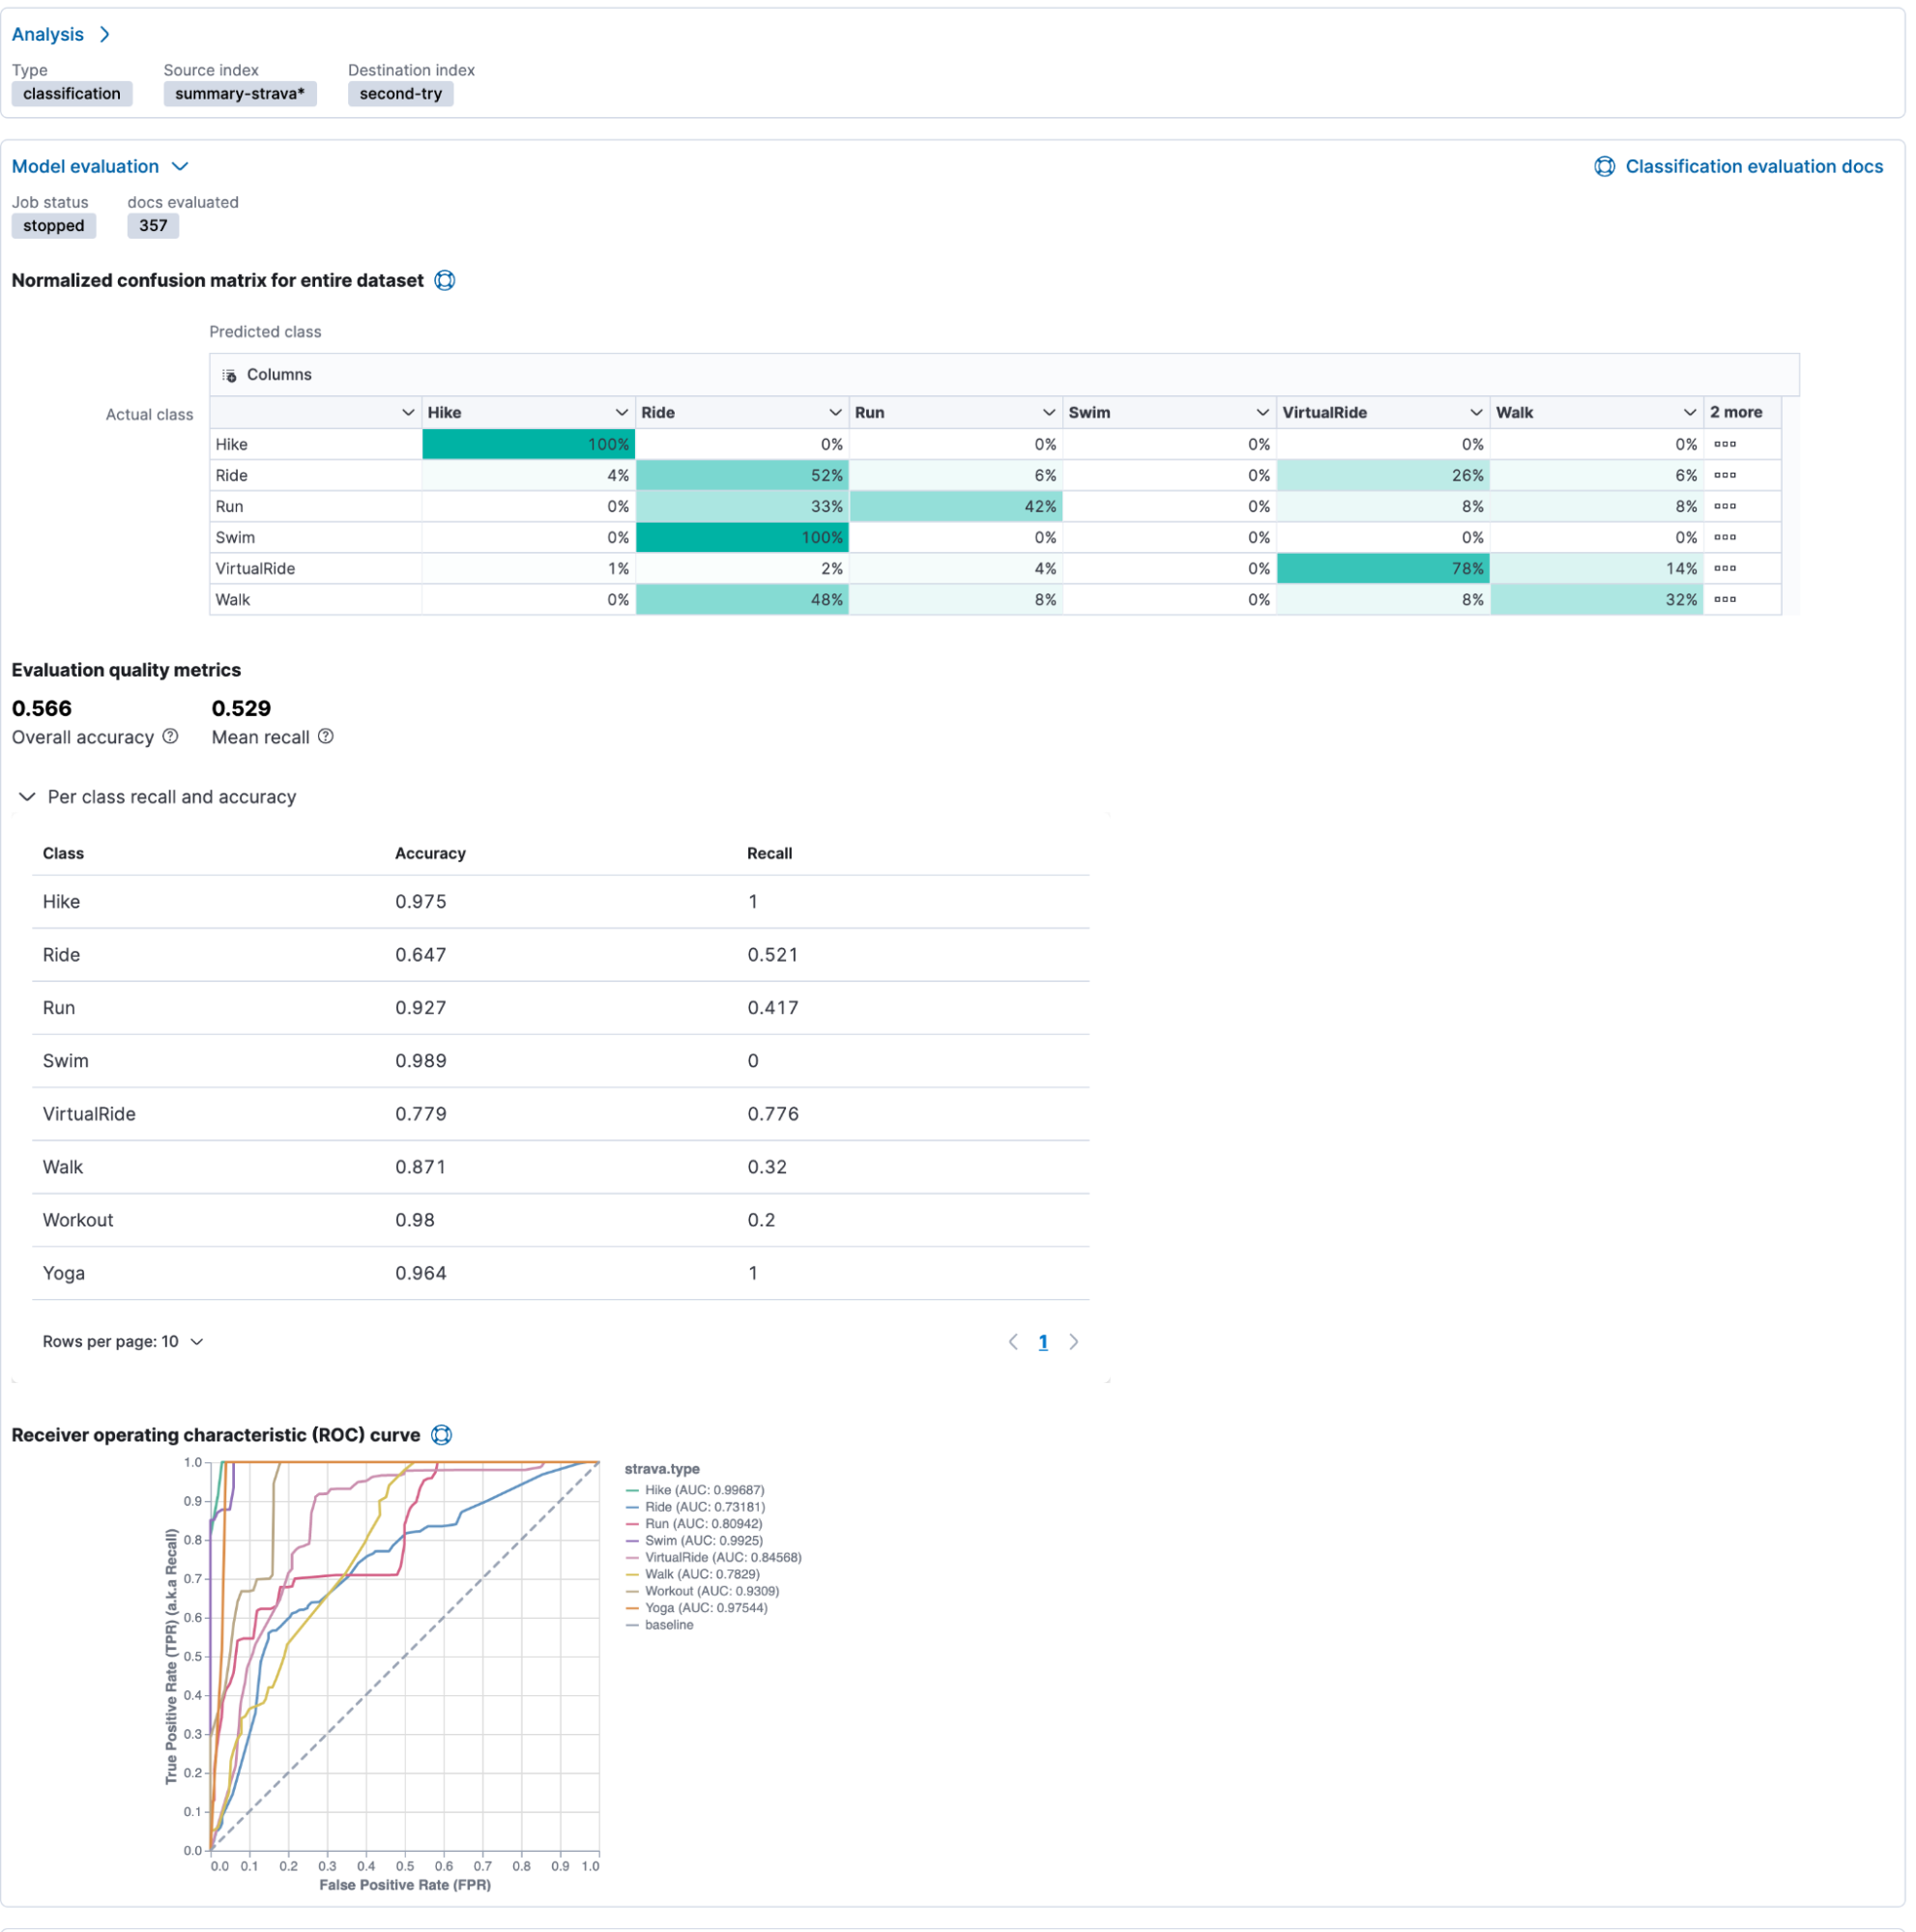
Beginning at the top, we see an exciting matrix with green-shaded numbers. This is the Normalized confusion matrix for the entire dataset. This provides a summary of the performance of the classification analysis. The actual labels are displayed on the left side, and the predicted labels are on top.
In our case, hike & hike has 100% accuracy. 4% of all rides were identified as hikes, and 6% even as runs, or worse, an additional 6% as walks. This allows us to identify issues with our model quickly.
The Receiver operating characteristics (ROC) curve is a standard tool in statistical analysis to interpret. The ROC curve represents the classification process's performance at different predicted probability thresholds. It compares the true positive rate (y-axis) for a specific class against the false positive rate (x-axis) at the various threshold levels to create the curve. From this plot, the area under the curve (AUC) value can be computed, a number between 0 and 1. The closer to 1, the better the algorithm performance.
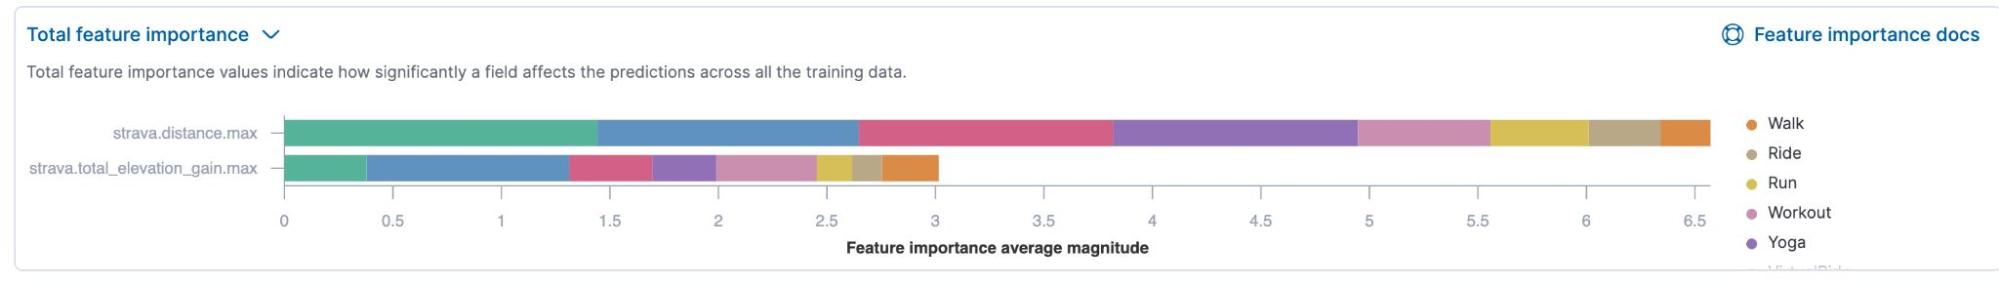
The total feature importance is a helpful tool in understanding the model, and this clearly shows that just the distance heavily sways the model.
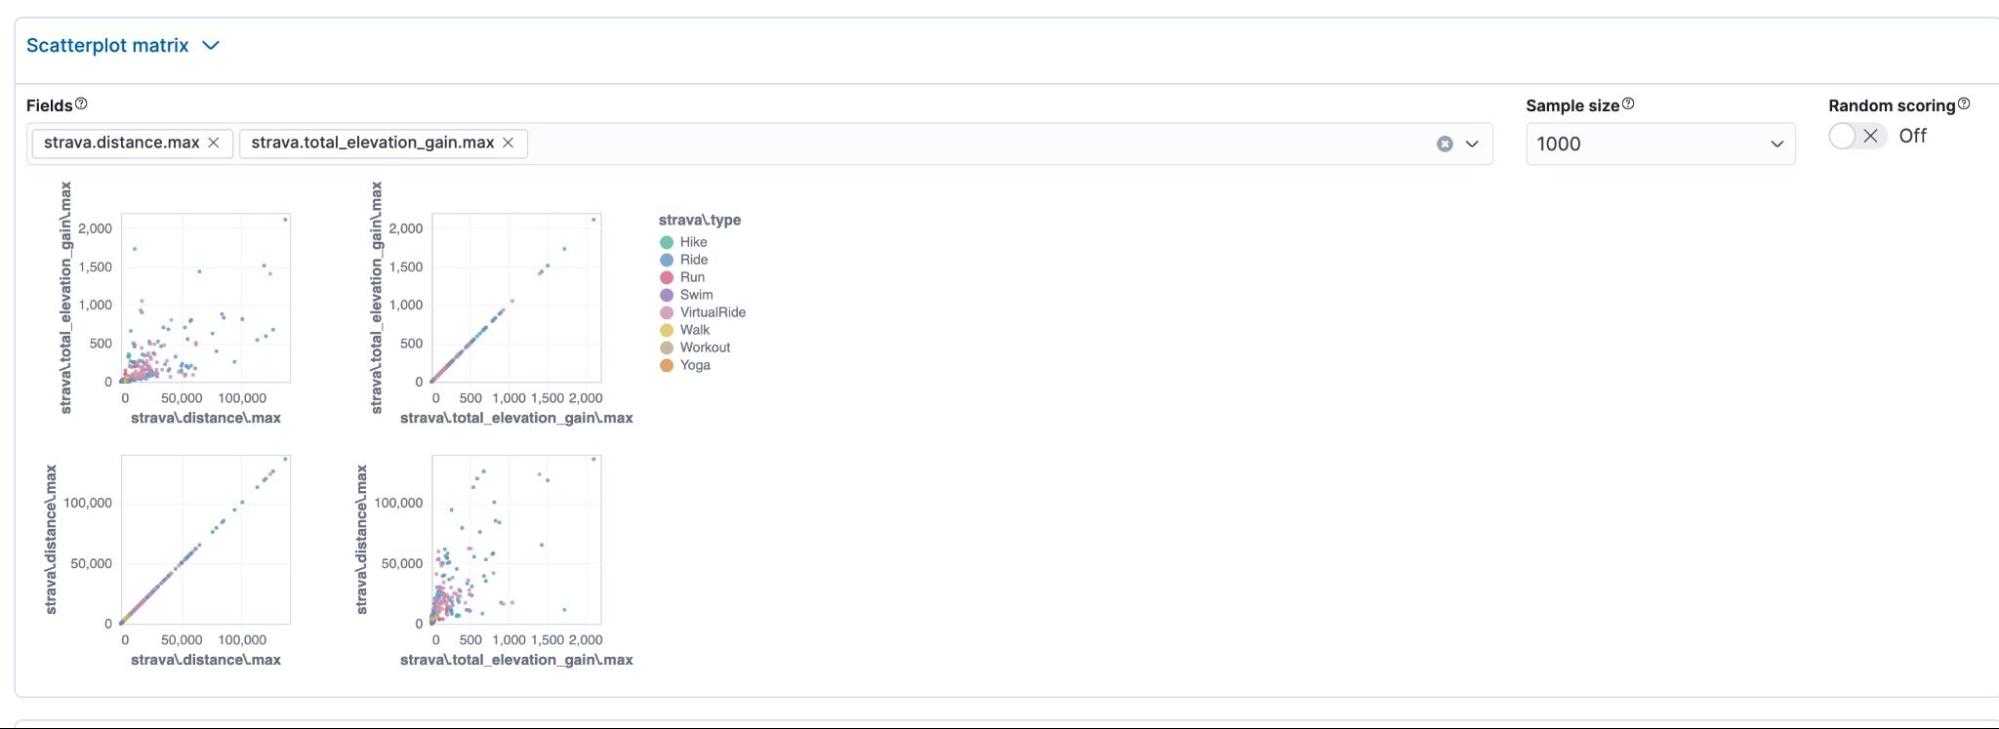
The scatter plot analysis shows us the distribution of the values on a scatter plot. It’s useful for visually understanding if a group of values is close together and could significantly influence the model's decision.
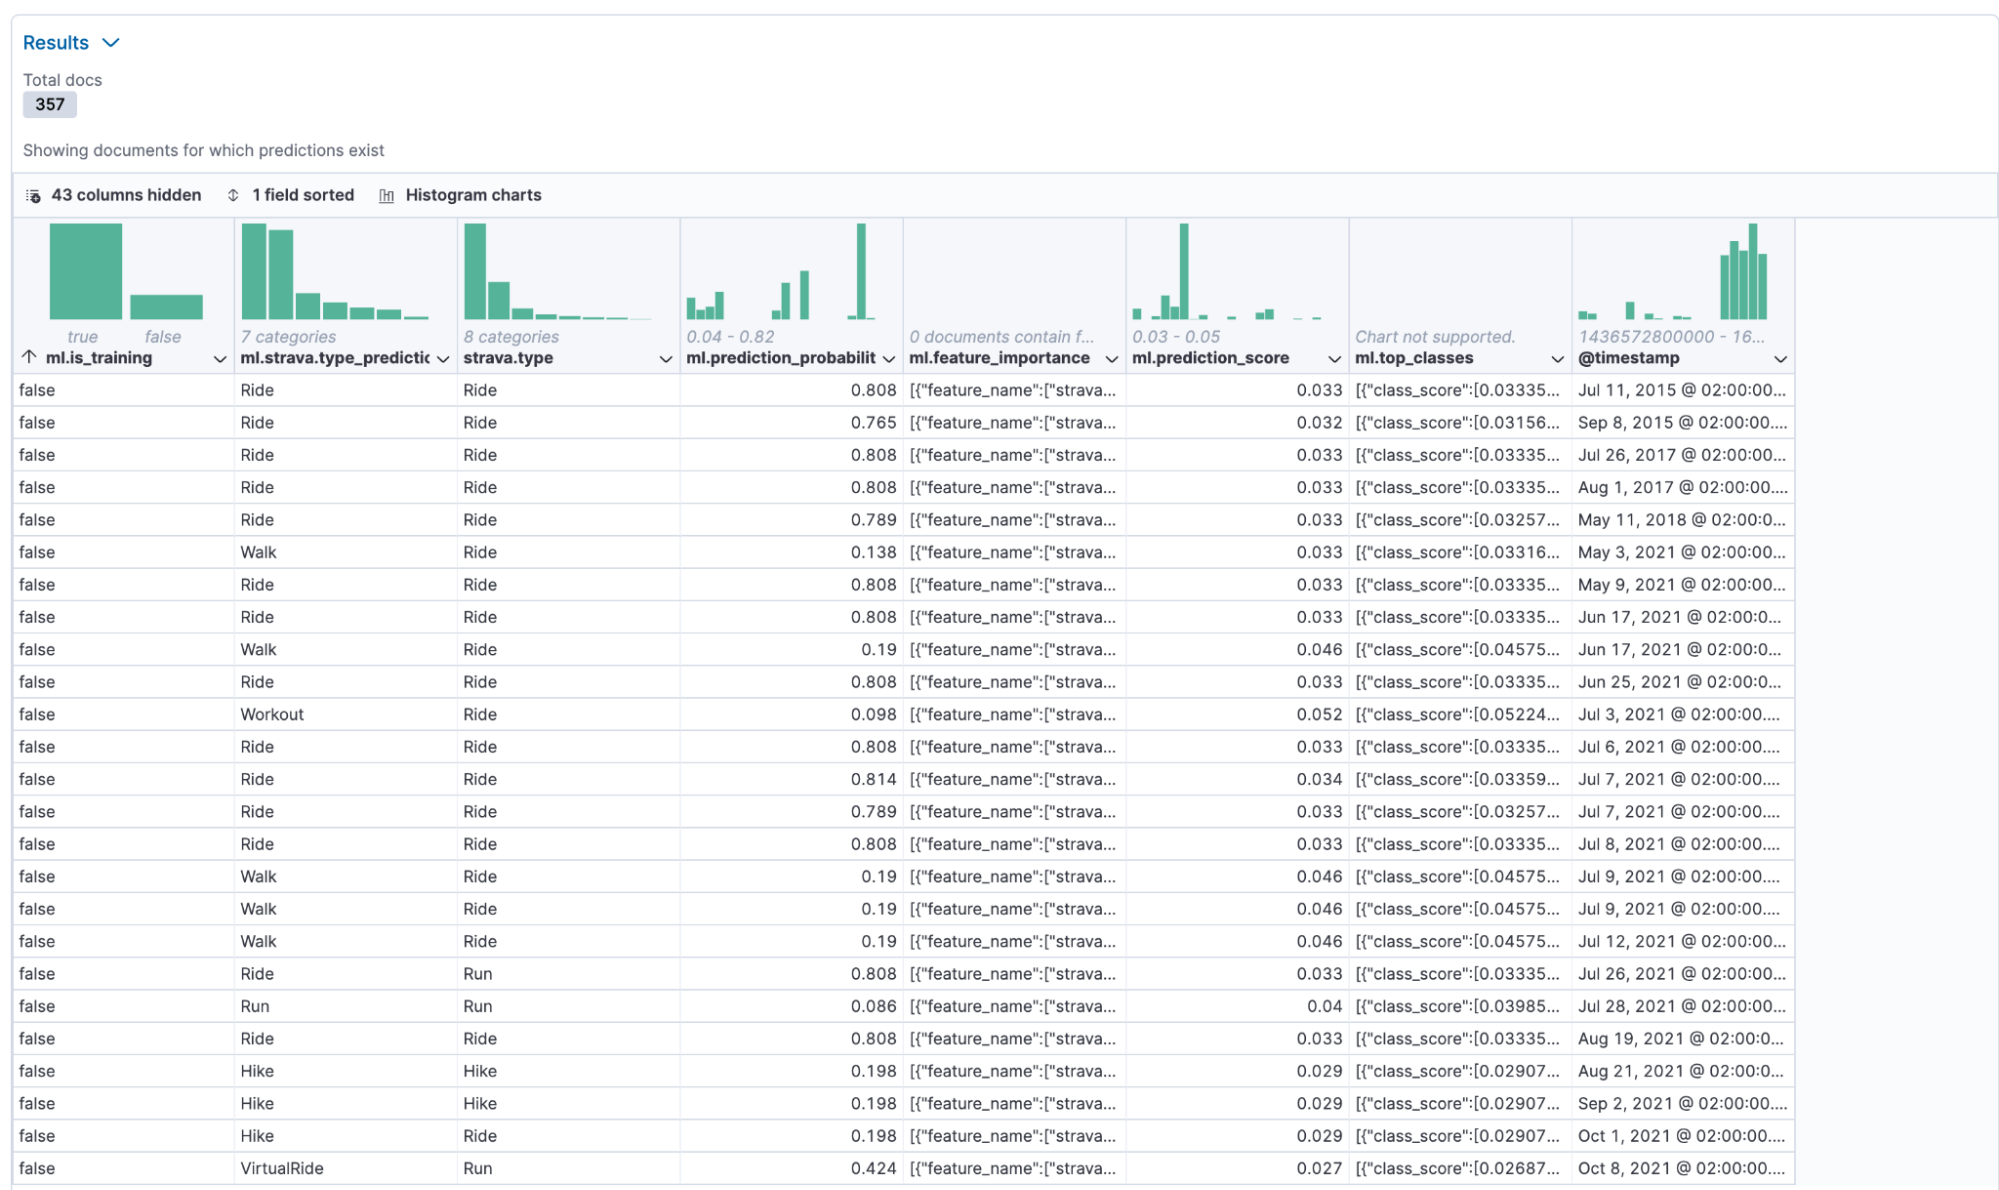
Last is the results page, telling us what type the model assumed and what the actual type is. I don’t mind if the model cannot identify between VirtualRide and Ride since both are bike options, but classifying a walk, while in reality, it is a bike ride, is just wrong.
We can see that with the two variables, our Job is more hit-and-miss than actual valuable insight.
Create a new classification, and take the same steps as before. This time we add two more variables. Elapsed time and velocity. I think elapsed time will heavily influence the decision, and the velocity might help identify the difference between VirtualRide and Ride, since, on Zwift, my overall speed is higher than riding outdoors.
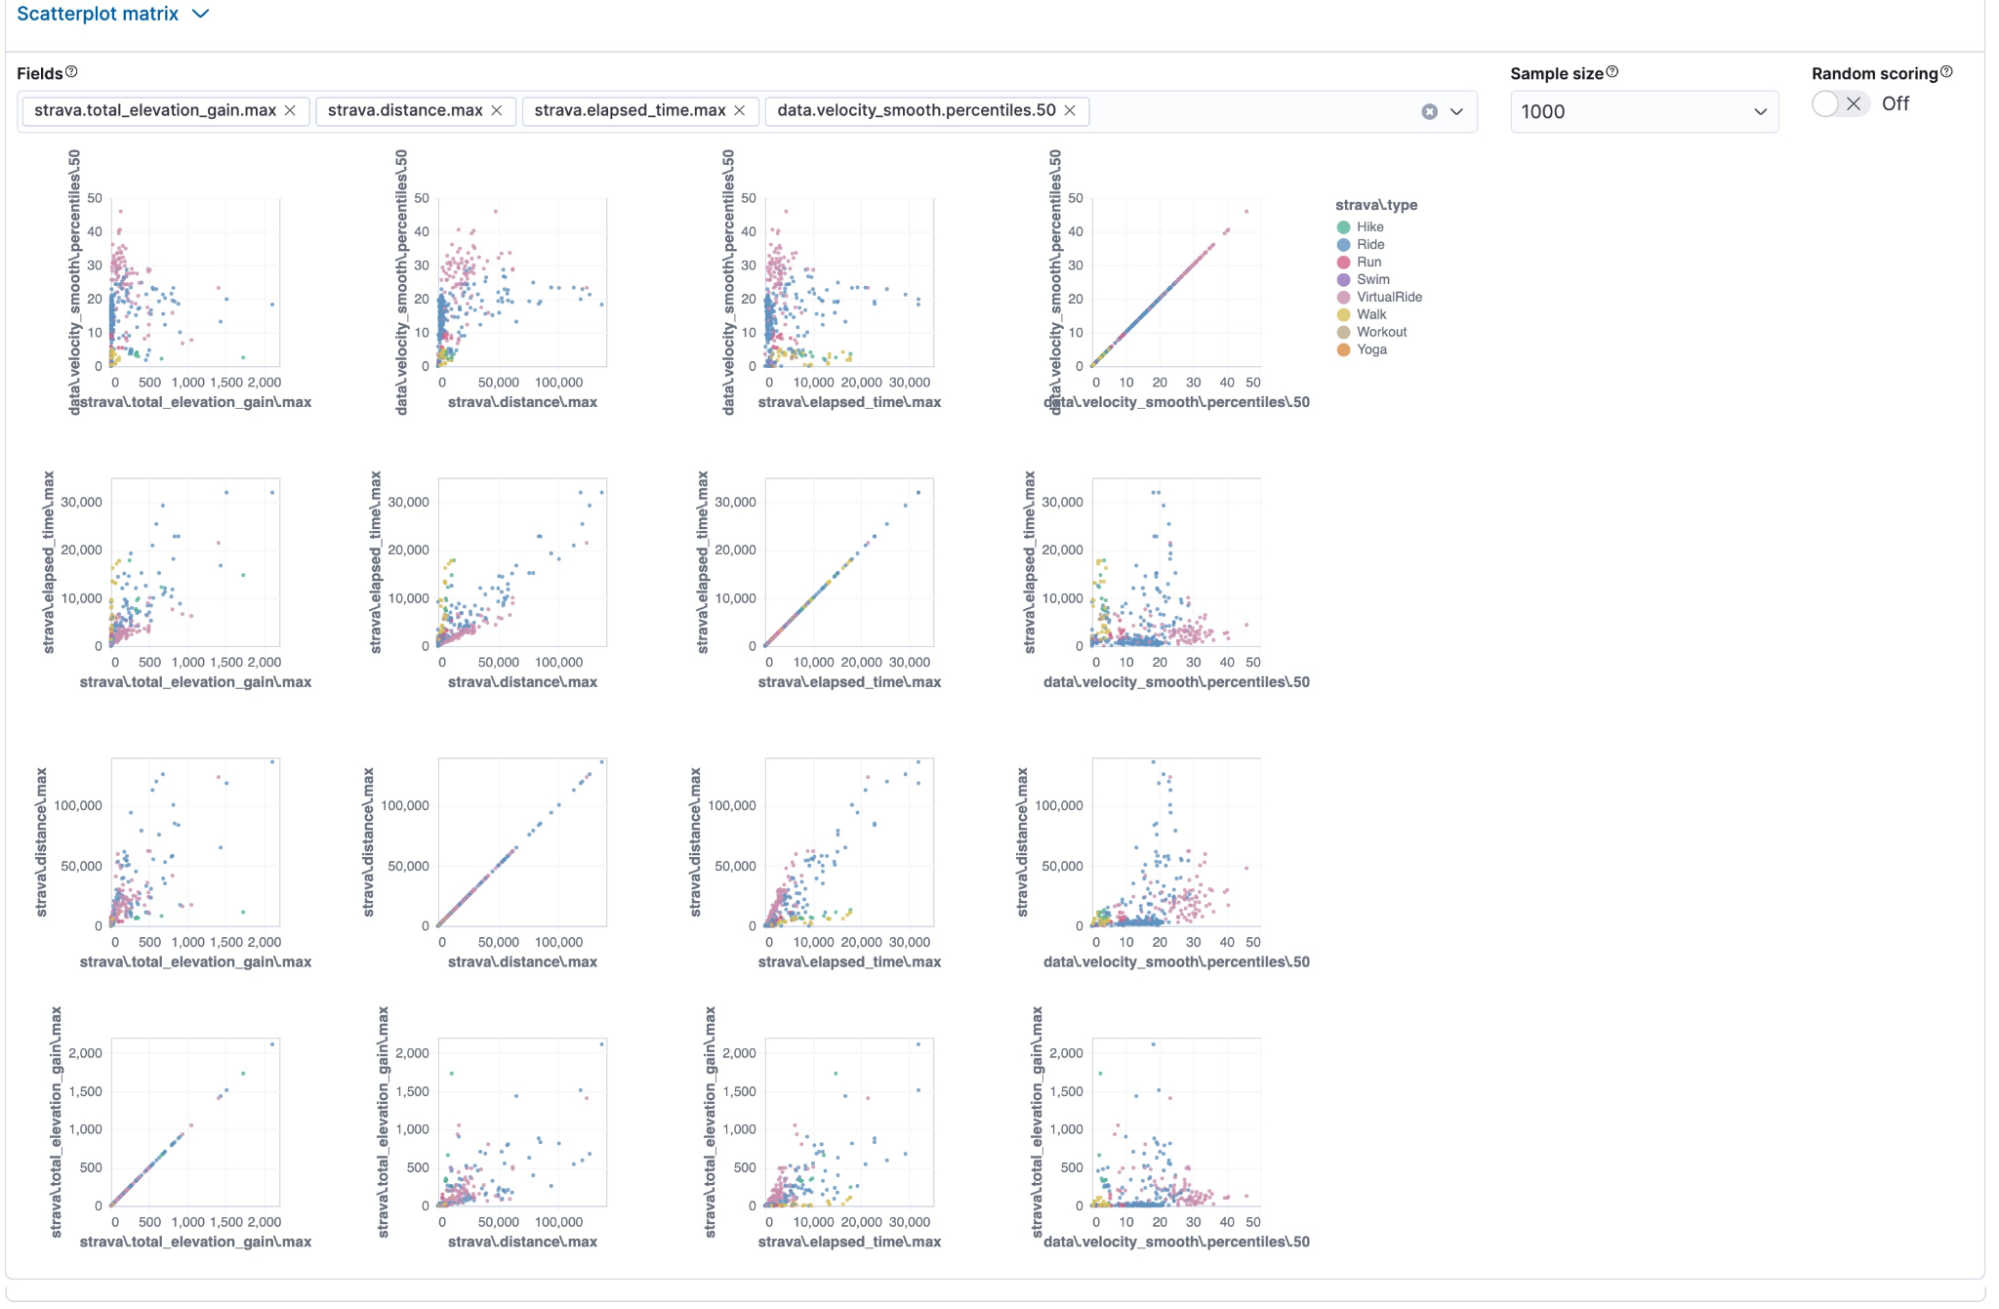
The scatter plot looks much more promising and exciting.
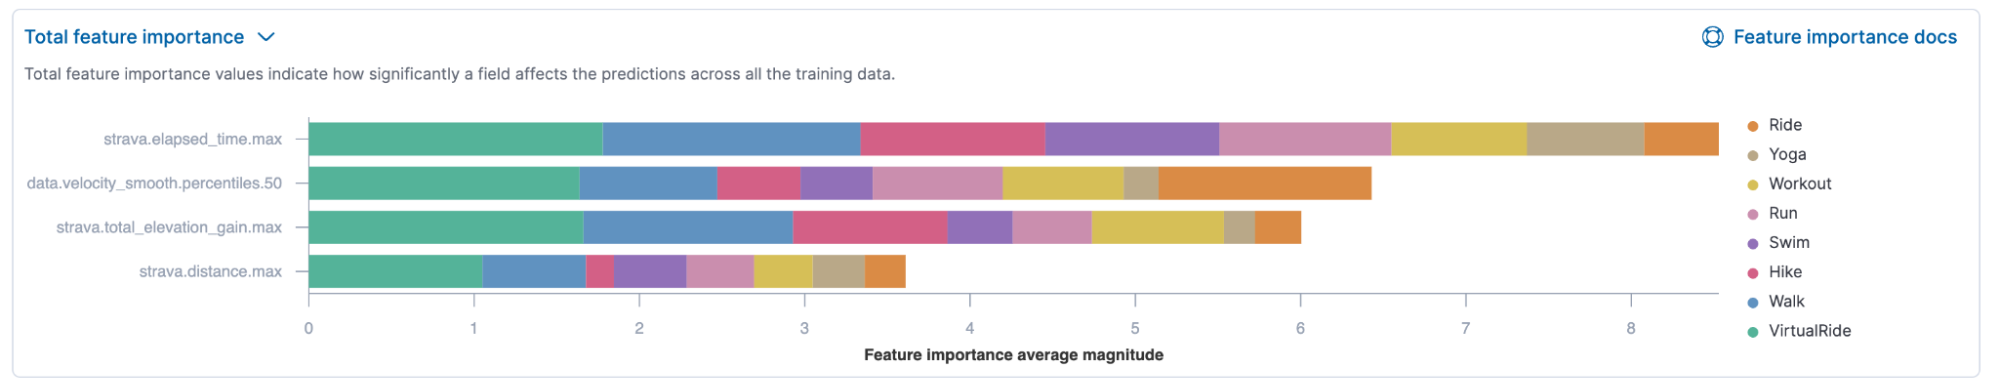
Yes! I was right. The feature importance clearly shows that elapsed time is now a significant factor. Velocity and elevation gain are nearly equally important, while distance decreased in significance.
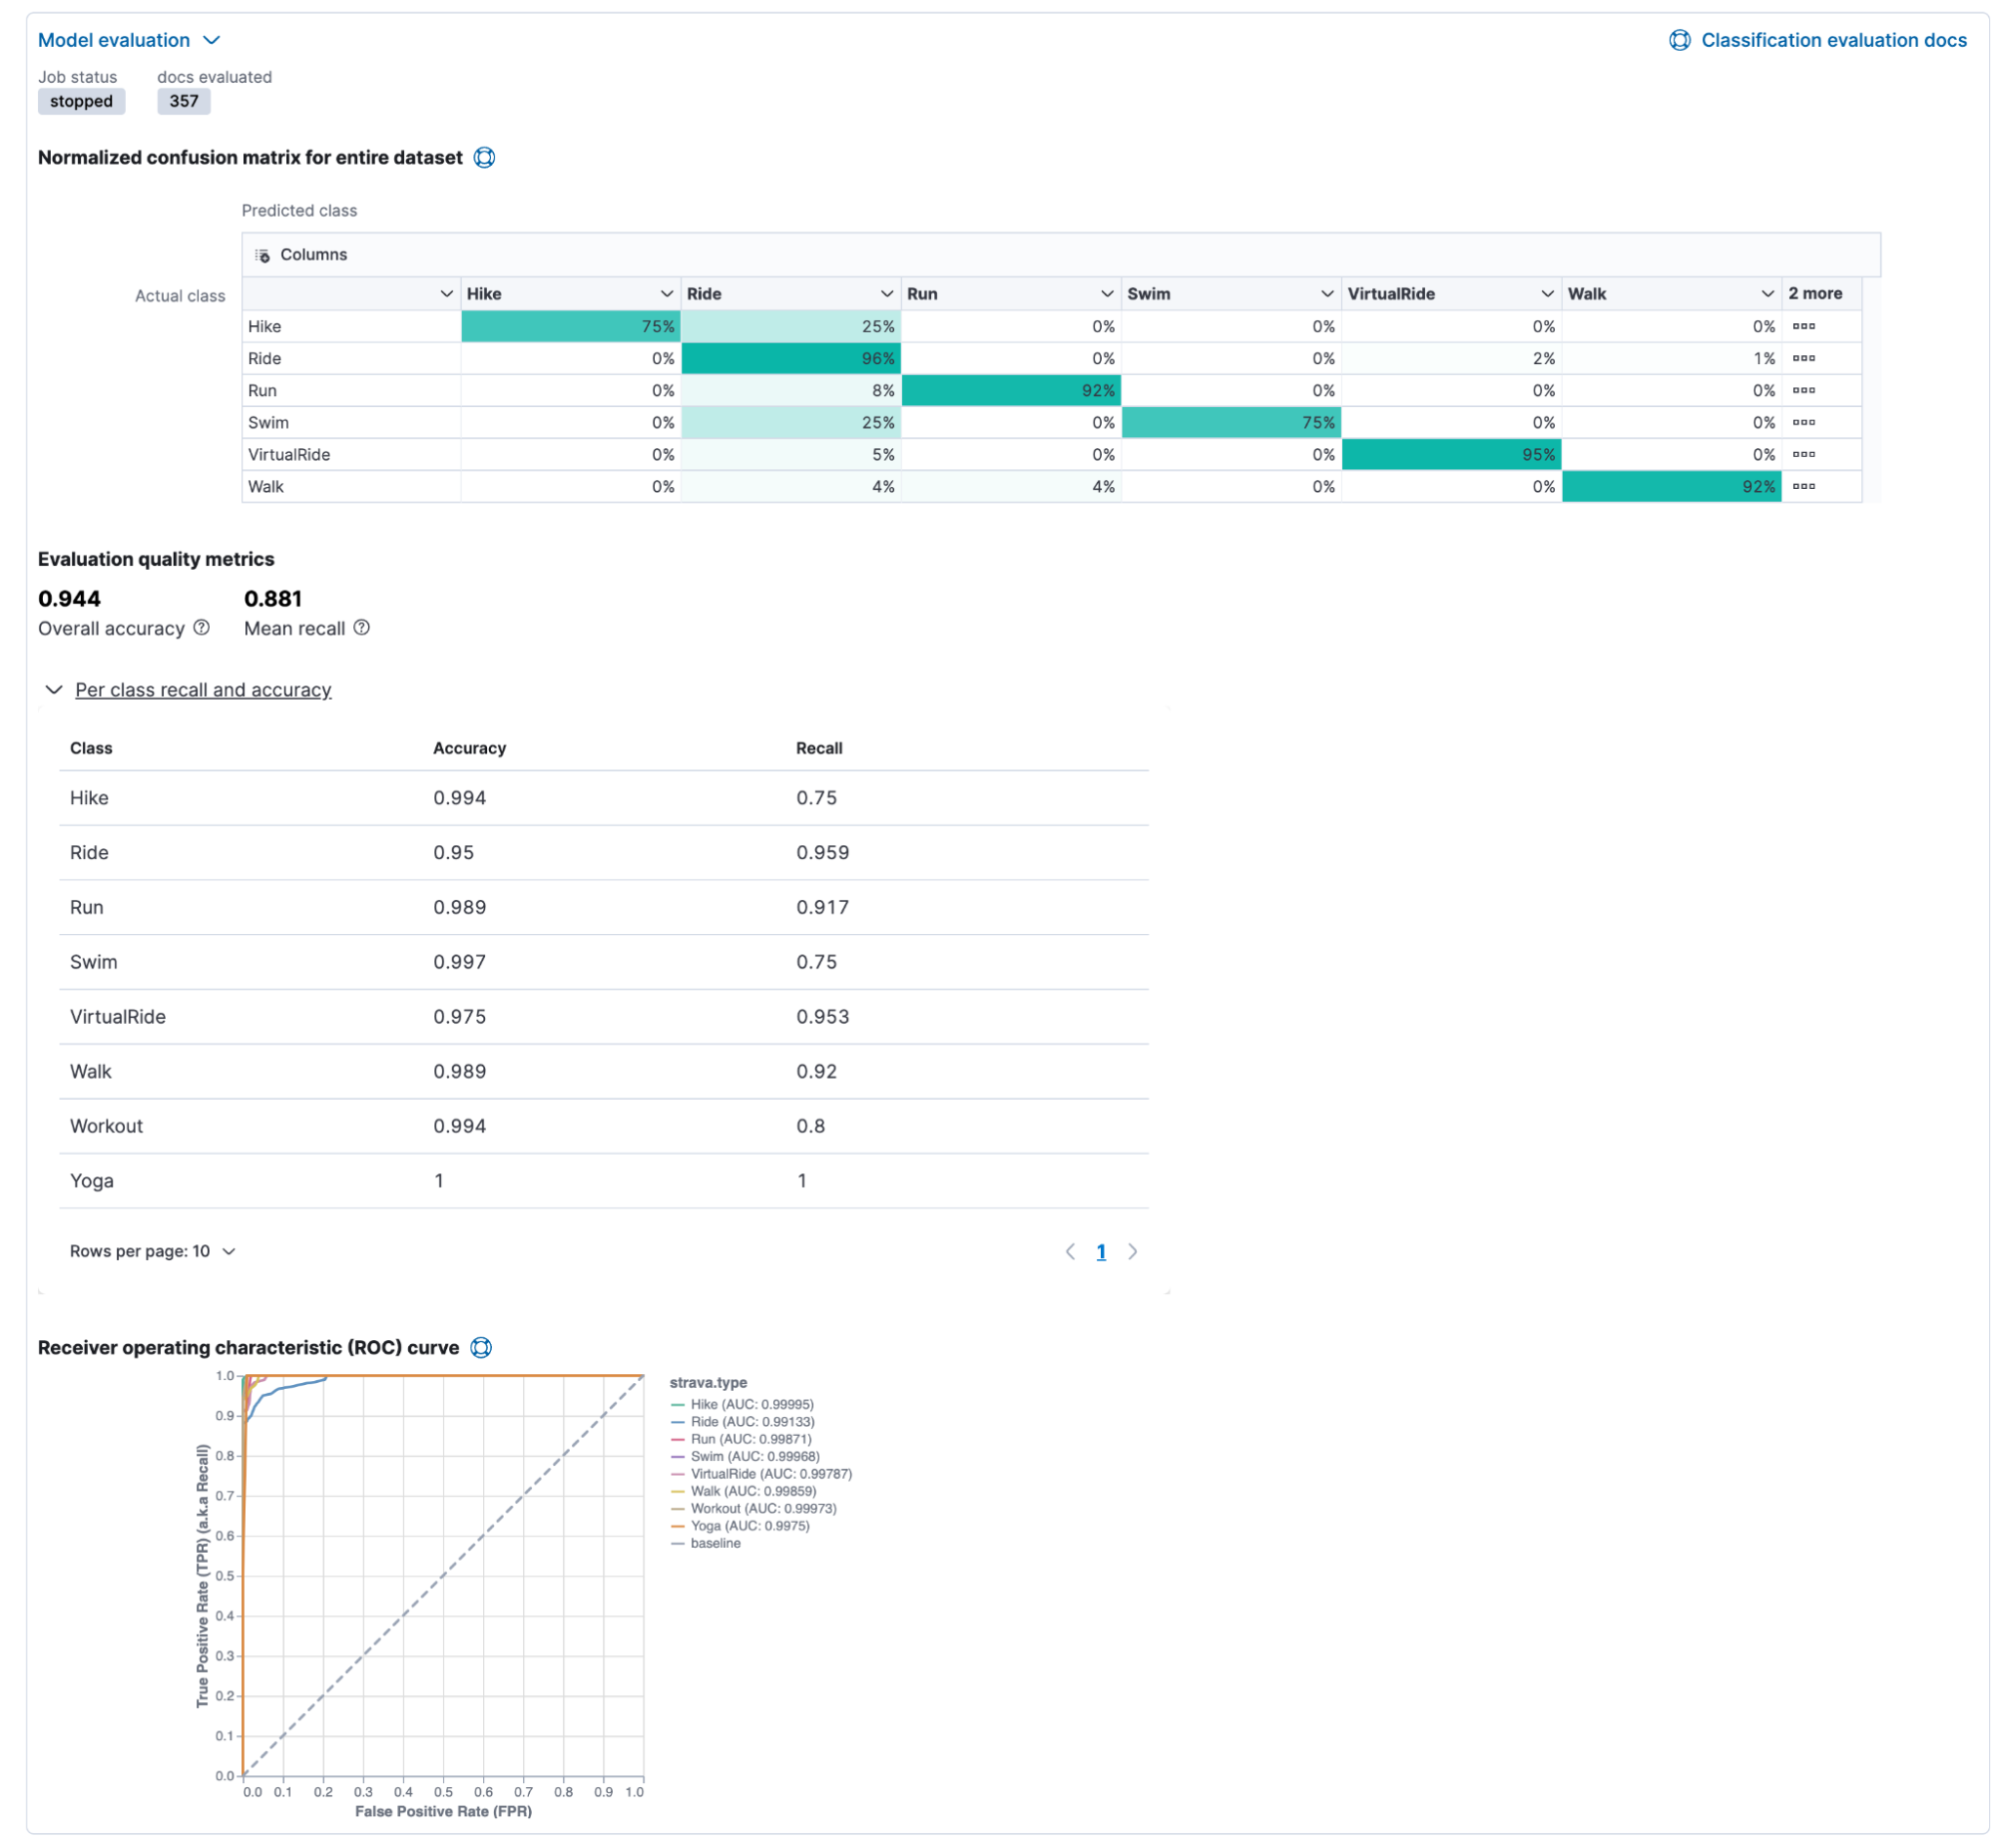
This is a beautiful ROC curve, and there is nothing more to add than changing from two to four impactful variables made a huge difference.
Summary
We achieved quite a bit in this blog post, and you can start exploring your data now! Don’t forget to check out our book Machine Learning with the Elastic Stack.
Ready to get started? Begin a free 14-day trial of Elastic Cloud. Or download the self-managed version of the Elastic Stack for free.
Check out the other posts in this Strava series:
- Part 1: How to import Strava data into the Elastic Stack
- Part 2: Analyze and visualize Strava activity details with the Elastic Stack
- Part 3: Get more out of Strava activity fields with runtime fields and transforms
- Part 4: Optimizing Strava data collection with Elastic APM and a custom script solution
- Part 5: How tough was your workout? Take a closer look at Strava data through Kibana Lens
- Part 6: Unlocking insights: How to analyze Strava data with Elastic AIOps
Share
- Share on Twitter
Share on Twitter
- Share on LinkedIn
Share on LinkedIn
- Share on Facebook
Share on Facebook
- Share by Email
Share by Email
- Print this page
Print