How tough was your workout? Take a closer look at Strava data through Kibana Lens


 Share on Twitter
Share on Twitter

 Share on LinkedIn
Share on LinkedIn

 Share on Facebook
Share on Facebook

 Share by Email
Share by Email

 Print this page
Print
This is the fifth blog post in our Strava series (don’t forget to catch up on the first, second, third, fourth)! I will take you through a journey of data onboarding, manipulation, and visualization.
What is Strava and why is it the focus? Strava is a platform where athletes, from recreational to professional, can share their activities. All my fitness data from my Apple Watch, Garmin, and Zwift is automatically synced and saved there. It is safe to say that if I want to get an overview of my fitness, getting the data out of Strava is the first step.
Why do this with the Elastic Stack? I want to ask my data questions, and questions are just searches!
- Have I ridden my bike more this year than last?
- On average, is my heart rate reduced by doing more distance on my bike?
- Am I running, hiking, and cycling on the same tracks often?
- Does my heart rate correlate with my speed when cycling?
Suffer Score, Training Impulse, Exercise Load…
In Strava it is called Suffer Score, Wahoo calls it TSS, and Garmin’s version is called Exercise Load. Nearly every fitness tracking company has its own version of the Training Impulse (TRIMP) calculation. Those companies properly did a ton of mathematical modeling to ensure that their model fits perfectly and is universally applicable.
I am not saying that any of those is just a TRIMP calculation. TRIMP is a way to calculate the possible training load a workout has created. This can be based on the training mileage, as in the distance, or better use heart rate. For cyclists, you can also resort to power output. One should never forget that the human body is extremely complex, and a single model such as the TRIMP will not be enough to model a training session's impact properly. Nonetheless, TRIMP has its place, and some metrics help develop a consistent and good training plan.
There are many different versions of TRIMP nowadays. We will look at two models to showcase how this can be done in Lens using the Formula functions.
TRIMP average
TRIMP average is the easiest implementation as it takes the average heart rate and multiplies it by minute duration.
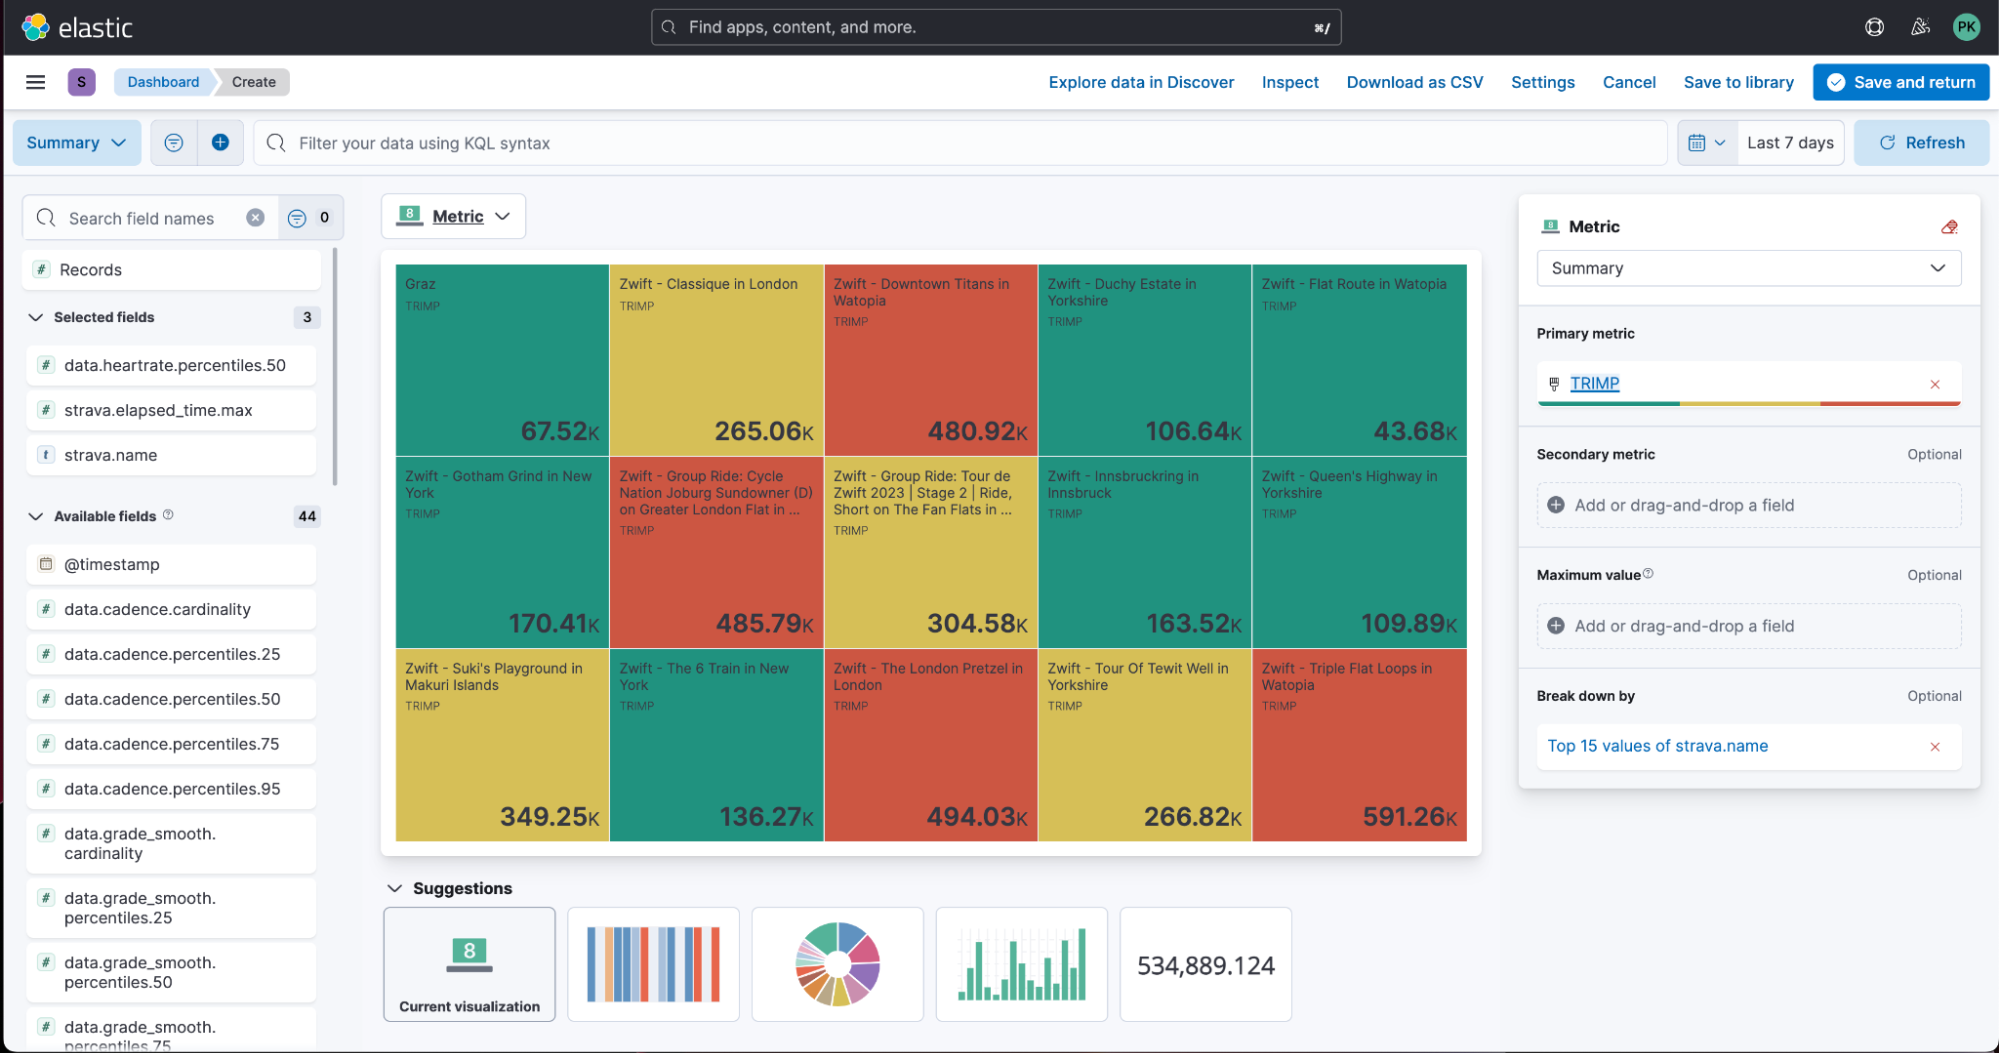
We can do that in Lens without hesitation. Let’s grab the new metric visualization and use our summary index that originates from the transform (check the third part, if you are missing it). Now let’s break down by the field strava.name. This will ensure that we individually calculate the TRIMP value for each activity. We want to select a formula on the primary metric and use the field that holds our average heart rate and the elapsed time. Then do this: max(heart-rate-field)*max(total-time-in-minutes-field).
At the bottom, select dynamic for the color mode to highlight intense training sessions. Ultimately, it looks like this:
TRIMP zone
TRIMP zone is an adapted form that categorizes your heart rate into five predefined zones. This makes it difficult to use the summary index as we need to calculate the time spent in this zone. This is the table that we will be creating as a formula in Lens.
|
% HRmax |
Scale |
|
50%–60% |
1 |
| 60%–70% | 2 |
| 70%–80% | 3 |
| 80%–90% | 4 |
| 90%–100% | 5 |
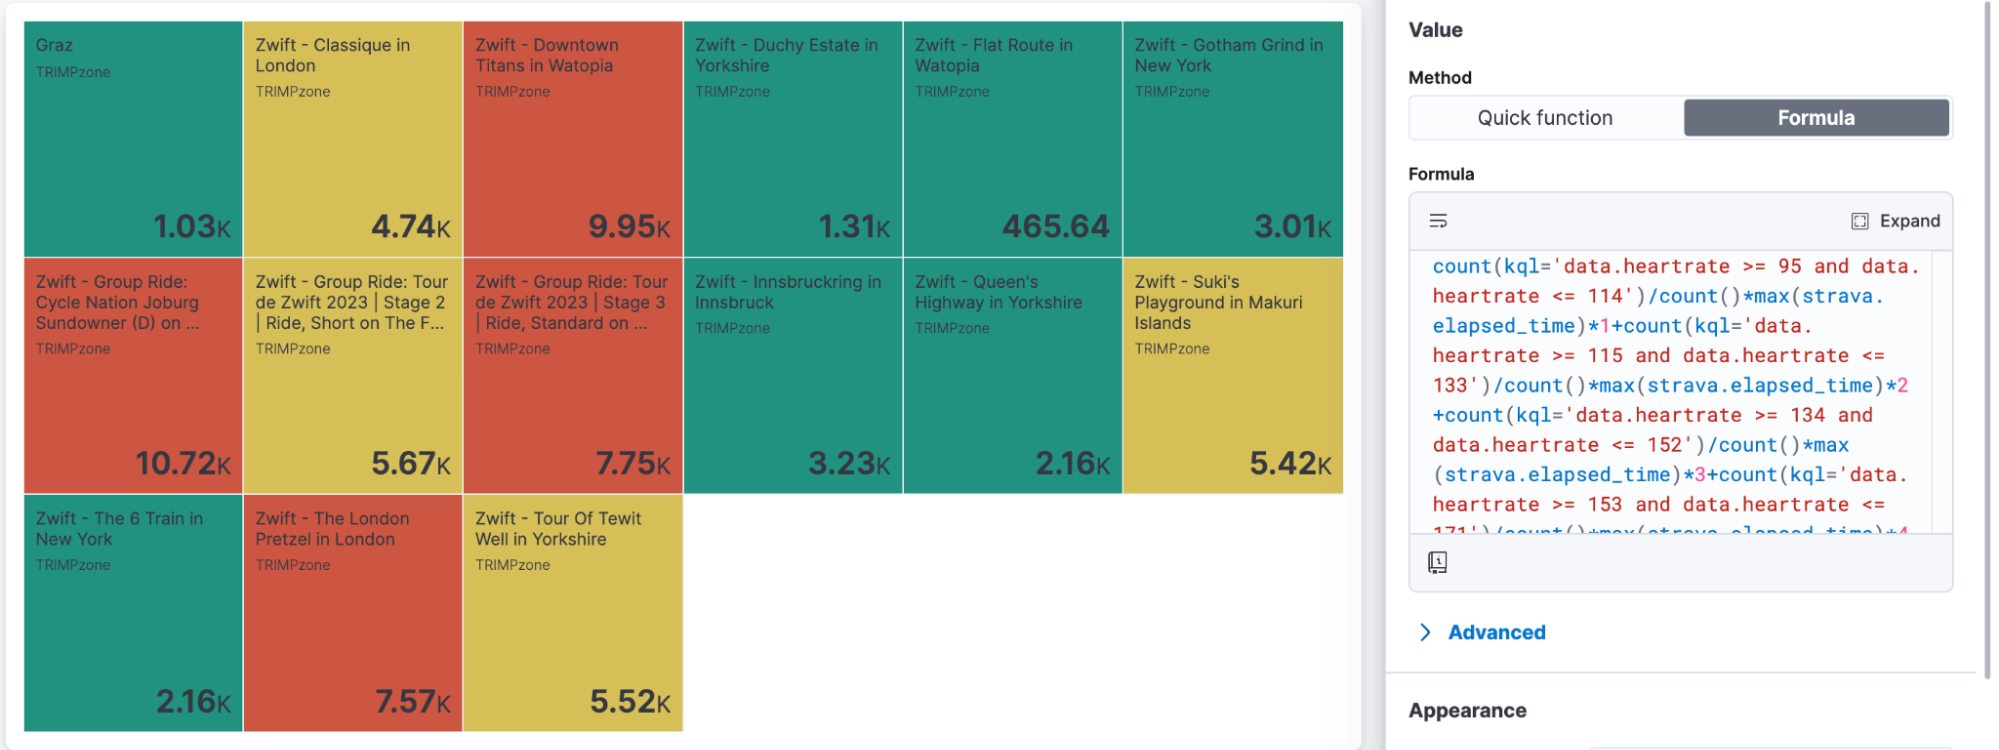
In my case, my max heart rate is around 189. In the end, we can use this clunky formula in Lens.
count(kql='data.heartrate >= 95 and data.heartrate <= 114')/count()*max(strava.elapsed_time)*1+count(kql='data.heartrate >= 115 and data.heartrate <= 133')/count()*max(strava.elapsed_time)*2+count(kql='data.heartrate >= 134 and data.heartrate <= 152')/count()*max(strava.elapsed_time)*3+count(kql='data.heartrate >= 153 and data.heartrate <= 171')/count()*max(strava.elapsed_time)*4+count(kql='data.heartrate >= 172 and data.heartrate <= 189')/count()*max(strava.elapsed_time)*5Not pretty, but functional!
Summary
We achieved quite a bit in this blog post, and you can start exploring your data now!
Ready to get started? Begin a free 14-day trial of Elastic Cloud. Or download the self-managed version of the Elastic Stack for free.
Check out the other posts in this Strava series:
- Part 1: How to import Strava data into the Elastic Stack
- Part 2: Analyze and visualize Strava activity details with the Elastic Stack
- Part 3: Get more out of Strava activity fields with runtime fields and transforms
- Part 4: Optimizing Strava data collection with Elastic APM and a custom script solution
- Part 6: Unlocking insights: How to analyze Strava data with Elastic AIOps
- Part 7: From data to insights: Predicting workout types in Strava with Elasticsearch and data frame analytics
Share
- Share on Twitter
Share on Twitter
- Share on LinkedIn
Share on LinkedIn
- Share on Facebook
Share on Facebook
- Share by Email
Share by Email
- Print this page
Print