Monitoring Java applications with Elastic: Getting started with the Elastic APM Java Agent
The goal of Java application monitoring is to minimize the time it takes to discover a problem with a Java application (mean time to detect, or MTTD) and the time it takes to recover from it (mean time to resolve, or MTTR). Understanding what's going on in our code is the biggest step in finding and eliminating the root cause of a problem, and let's face it — that code that seemed clear and concise when we wrote it a year ago might not be as "self documenting" as we thought.
In this blog series, we’ll use Elastic Observability to monitor a sample Java application. In this part, we’ll start by looking at how Elastic APM works to monitor Java applications. Using the Elastic APM Java Agent, we’ll then build and instrument a Java Spring application composed of a single microservice backed by a MySQL database. We’ll use the APM app in Kibana to monitor and navigate the spans of code that make calls to the database when the microservice handles a REST call. Next, we’ll look at how the agent captures any errors and stack traces that might have occurred. We’ll wrap up with an exploration of the Java Virtual Machine (JVM) metrics collected by the agent.
In the next blog post, we’ll link code spans with their logs, we’ll use custom instrumentation to monitor slow methods, and we’ll add another microservice to our sample app. We’ll also use Kibana to explore and analyze the traces, metrics, and logs we collected.
Monitoring Java with Elastic Observability
With the tools provided by Elastic Observability, it is possible to implement an effective incident response process framework. Elastic Observability integrates logs, metrics, and application traces into a unified view of a system’s behavior that allows continuous monitoring and response. Logs, metrics, and traces, together with traditional uptime monitoring and modern machine learning, are known as the pillars of observability. The Elastic Stack is the ideal platform to support these pillars. For Java applications, the Elastic APM Server and the Elastic APM Java Agent collect metrics and code traces and ship them to an Elasticsearch cluster. Filebeat reads the logs generated by the application and ships them to the cluster. Using structured logging and log correlation, all this data will be integrated. Elasticsearch and Kibana provide the final processing and analysis tools for Java monitoring.
The Elastic APM Java Agent works by tapping into a great deal of data provided by Java itself. Java’s compiled code, the byte code, is based on an open specification and even provides an instrumentation API that supports Java monitoring agents. Byte Buddy is an open source code generation and manipulation library that leverages the instrumentation API for the purpose of unobtrusively creating and modifying Java classes during the runtime of an application without having to recompile the code. The Elastic Java agent in turn uses Byte Buddy to instrument the JVM and generate information about an application’s interesting code paths, or spans, such as when it makes a database call or makes an HTTP request. The Elastic APM Java Agent can automatically attach itself to the byte code of an application to extract the span information, metrics, and errors. The agent understands a wide range of Java technologies, including most Java versions, web frameworks such as Servlets and Spring Boot, application servers such as Tomcat or WebSphere Application Server, messaging frameworks such as JMS and Kafka, and logging frameworks such as log4j, along with many other technologies. When necessary, developers can use the agent’s own API to create custom instrumentation of any parts of their code not captured by the agent to find performance problems and errors.
Once an application is instrumented we need to collect and ship all generated data, including related logs and metrics, to a central repository for integrated management, visualization, analysis, and alerting. Because of its scalability and its powerful search capabilities, Elasticsearch is an ideal solution for these purposes. The Elastic APM Java Agent collects and sends transaction and span information to the Elastic APM Server which, in turn, correlates this data and ships it to the Elasticsearch cluster. The agent also collects unhandled errors and exceptions and groups them to see how frequently errors of the same type occur. The agent also captures JVM metrics such as memory usage and garbage collection statistics. To collect and ship the logs we are going to need Filebeat, but the Java Agent will correlate them to the transactions they belong to before we even send them to Elasticsearch. Kibana provides the visualization, analysis, and alerting interface. Users with a Platinum subscription can use Elastic machine learning features to detect anomalies in the metric time series.
Now, when a service provided by an instrumented application is called, the Java Agent captures metrics and errors about the spans involved in its execution and organizes them hierarchically. The top-level span, the service call itself, is called a transaction. Calls to a database, HTTP requests, or other such operations are linked to the current span creating a parent-child relationship.
When a service calls another service over a network, and both services have been instrumented using Elastic APM agents, a trace is created to link the service-level transactions. It is then possible to follow a service call end to end across an arbitrary number of service calls. Elastic APM provides agents for a variety of technologies, including .NET, node.js (and its frameworks such as Express), and others. A page on a browser running JavaScript can be also instrumented using the Elastic APM Real User Monitoring (RUM) Agent. The RUM Agent supports popular JavaScript frameworks including Vue and React.
When you add log correlation to the picture, you can truly weave the complete story of a multiservice transaction. The agent will inject the current trace.id, transaction.id, and error.id into your code’s mapped diagnostic context (MDC) — thus linking your log entries to the current trace, transaction, or error. With a fully instrumented web application and correlated logs, you can find out exactly what happens from the moment a user loads a page on a browser, or clicks a button on that page, through all the services involved in responding to the user action, including database calls to the moment the user receives the response. Specifically, you can find out how long each service took to execute, what spans of code were involved in that execution and how long they took, what errors occurred, and what the application logged during the entire trace.
Monitoring a sample Java application
As we mentioned earlier, the Java Agent is capable of monitoring a wide variety of Java frameworks and platforms. In this post, and for simplicity, we are going to focus only on Java Spring to do a practical exploration of Java monitoring with Elastic APM. The application we are going to build is purposely simple so we can concentrate on its monitoring rather than its functionality. All we are going to do is store data about friends in a MySQL database. We will create a Java Spring app to proxy this database and expose a couple of REST data access services. Dive in and follow the steps on your own! The blog is written with that goal in mind.
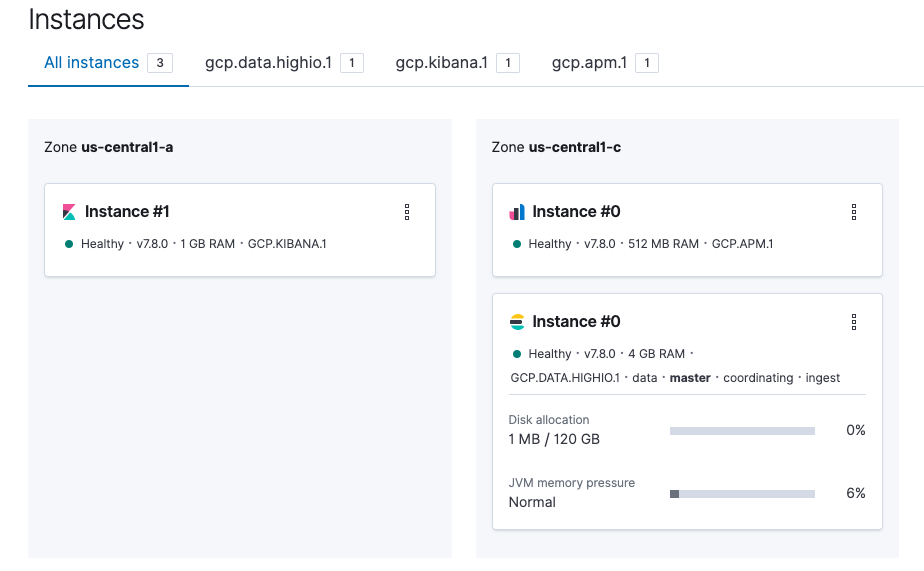
First, some prerequisites. You need an Elasticsearch cluster and an APM Server. The easiest way to get those two is to sign up for a free trial Elastic Cloud account and create a deployment.
This is the Elastic Cloud deployment we’ll use to monitor the Java apps developed in this post.
This example also requires a MySQL server to store the application data. You can use Docker Compose to get a MySQL server up and running.
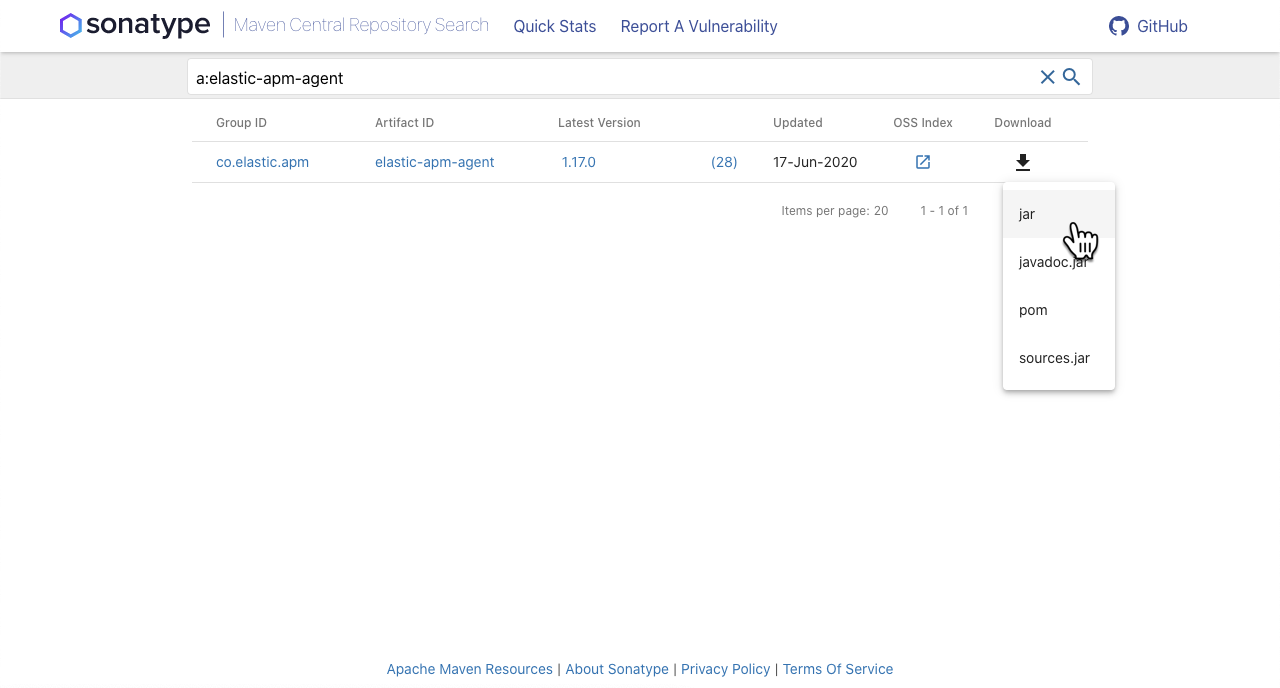
Next, download the Java Agent from Maven Central at https://search.maven.org/search?q=a:elastic-apm-agent. Download it as a jar:
Create the database
Create a MySQL database with these commands (we are just following the instructions at https://spring.io/guides/gs/accessing-data-mysql/ for how to proxy MySQL using a Spring app).
mysql> create database db_example;
mysql> create user 'springuser'@'%' identified by 'ThePassword';
mysql> grant all on db_example.* to 'springuser'@'%';
Setup the folders for our code
Create a folder called <code>java-monitoring to store the code and the agent. Create an <code>agent sub-folder and move the Java Agent you just downloaded to this location.
java-monitoring/
└── agent
    └── elastic-apm-agent-1.17.0.jar
Go ahead and cd into java-monitoring.
Build a Spring app that proxies a MySQL database
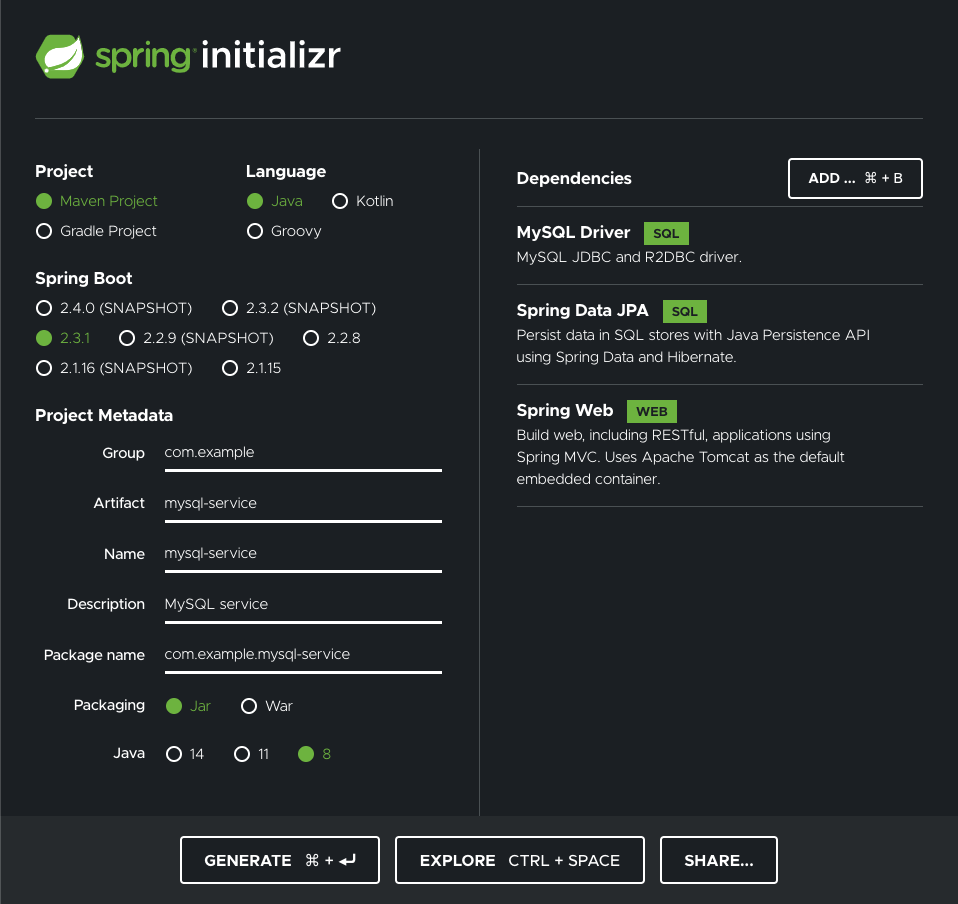
Go to the "spring initializr" at start.spring.io to generate a Spring application. We want to access a MySQL database, so add the MySQL Driver and Spring Data JPA as dependencies. We also want to expose REST endpoints to serve MySQL data, so add Spring Web as a dependency. Use mysql-service as the Artifact, MySQL service as the Description, and leave all the other defaults. Click GENERATE to generate and download the project.
Now, unzip the download into your java-monitoring folder.
Your project should now look like this:
java-monitoring/
├── agent
│   └── elastic-apm-agent-1.17.0.jar
└── mysql-service
    ├── HELP.md
    ├── mvnw
    ├── mvnw.cmd
    ├── pom.xml
    └── src
        ├── main
        │   ├── java
        │   │   └── com
        │   │       └── example
        │   │           └── mysqlservice
        │   │               └── MysqlServiceApplication.java
        │   └── resources
        │       ├── application.properties
        │       ├── static
        │       └── templates
        └── test
            └── java
                └── com
                    └── example
                        └── mysqlservice
                            └── MysqlServiceApplicationTests.java
Change directory into mysql-service and create a new file, Friend.java, in the same package as your application. That is, create the file in src/main/java/com/example/mysqlservice
package com.example.mysqlservice;
import javax.persistence.Entity;
import javax.persistence.GeneratedValue;
import javax.persistence.GenerationType;
import javax.persistence.Id;

@Entity
public class Friend {
 @Id
 @GeneratedValue(strategy=GenerationType.AUTO)
 private Integer id;
 private String name;

 public Integer getId() {
   return id;
 }

 public void setId(Integer id) {
   this.id = id;
 }

 public String getName() {
   return name;
 }

 public void setName(String name) {
   this.name = name;
 }

}
Friend is the Java object representation of the rows in the database.
Now add FriendRepository.java, the class that will provide CRUD operations on the database.
package com.example.mysqlservice;
import org.springframework.data.repository.CrudRepository;
import com.example.mysqlservice.Friend;

public interface FriendRepository extends CrudRepository<Friend, Integer> {
}
Next, we need a controller to handle REST calls to the service. Add MainController.java with the following code:
package com.example.mysqlservice;

import org.springframework.beans.factory.annotation.Autowired;
import org.springframework.stereotype.Controller;
import org.springframework.web.bind.annotation.GetMapping;
import org.springframework.web.bind.annotation.PostMapping;
import org.springframework.web.bind.annotation.RequestMapping;
import org.springframework.web.bind.annotation.RequestParam;
import org.springframework.web.bind.annotation.ResponseBody;

@Controller
@RequestMapping(path="/friend")
public class MainController {
 @Autowired
 private FriendRepository friendRepository;

 @PostMapping(path="/add")
 public @ResponseBody String addNewFriend (@RequestParam String name) {
   Friend friend = new Friend();
   friend.setName(name);
   friendRepository.save(friend);
   return "Saved";
 }

 @GetMapping(path="/all")
 public @ResponseBody Iterable<Friend> getAllFriends() {
   return friendRepository.findAll();
 }
}
To define the connection to the MySQL database, create the file application.properties in the src/main/resources folder with the following contents:
spring.jpa.hibernate.ddl-auto=update
spring.datasource.url=jdbc:mysql://${MYSQL_HOST:localhost}:3306/db_example
spring.datasource.username=springuser
spring.datasource.password=ThePassword
Now you can build and start the application from mysql-service.
mvn clean package
java -jar target/mysql-service-0.0.1-SNAPSHOT.jar
In a new terminal window you can try it out by adding a friend (or two) and verifying that they have made it into the database.
curl localhost:8080/friend/add -d name=John
curl localhost:8080/friend/add -d name=Jane
curl localhost:8080/friend/all
Now, the fun part. To instrument the application we just developed, all we need to do is run it with the -javaagent flag along with the address and credentials for the APM Server. We also need to add a service name to identify our application to the APM Server.
Stop the application and start it again as follows if your APM Server is on Elastic Cloud:
java -javaagent:../agent/elastic-apm-agent-1.17.0.jar \
 -Delastic.apm.service_name=mysqlservice \
 -Delastic.apm.server_urls=<YOUR_APM_SERVER_URL> \
 -Delastic.apm.secret_token=<YOUR_SECRET_TOKEN> \
 -Delastic.apm.application_packages=com.example \
 -jar target/mysql-service-0.0.1-SNAPSHOT.jar
That’s right! To get a great deal of information about your application you do not need to instrument the code or define a single dependency with the agent. You just run your application and the agent will know what to do. It is worth mentioning that there are other ways to instrument a Java application.
Go ahead and add a few more friends and retrieve them using the REST endpoints of your app. These interactions are now being monitored.
Monitoring the application in the APM app
Go over to Kibana and select the APM app on the left hand side of the UI. Your service should be listed as mysqlservice — the name we gave it when we ran the application as a jar file.
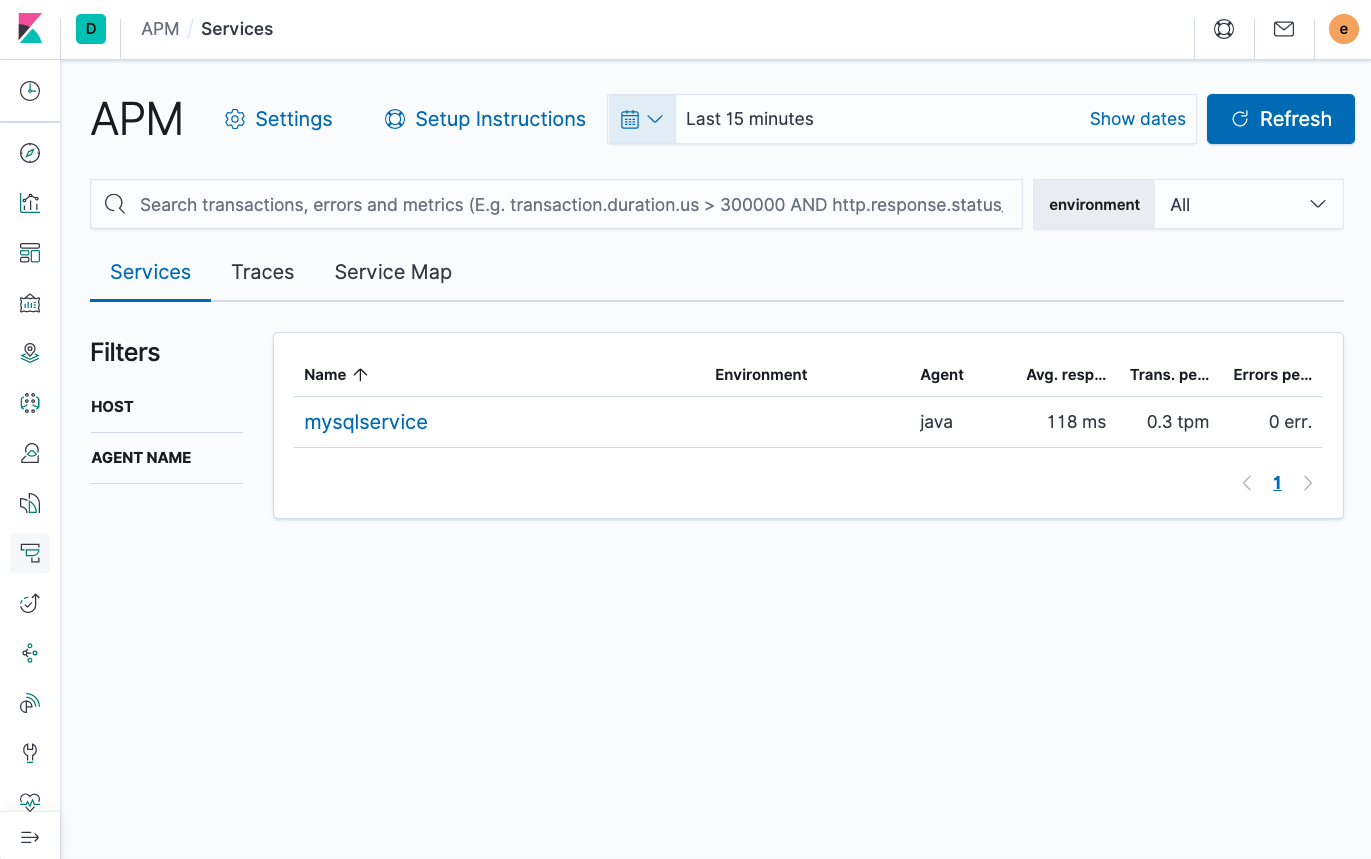
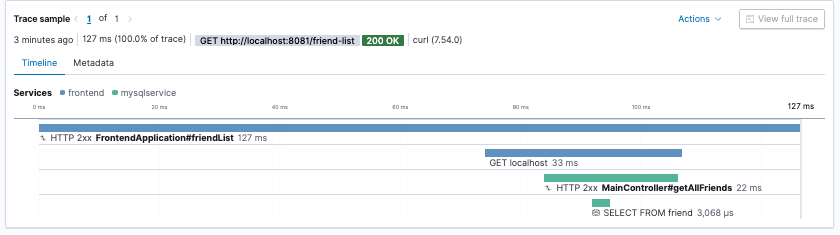
Click on mysqlservice to see a dashboard with metrics and transactions.
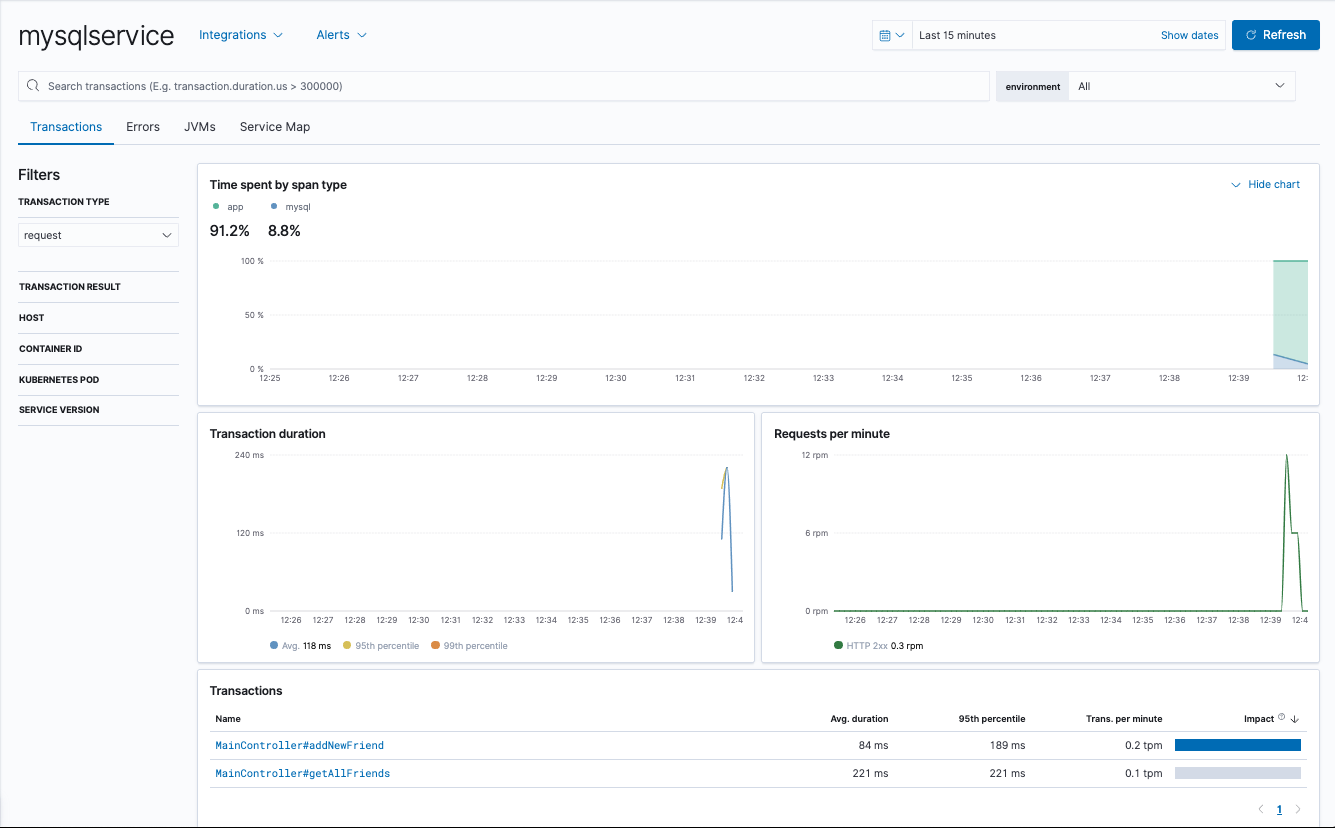
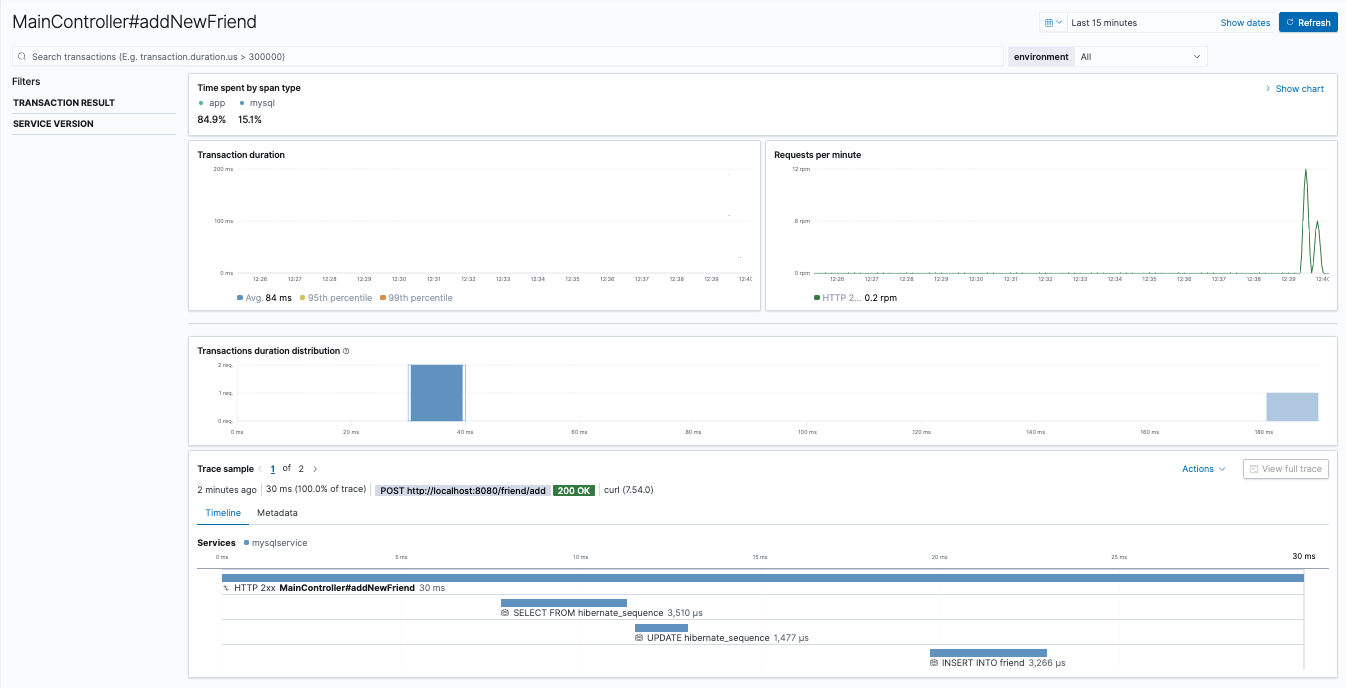
Click on the addNewFriend transaction. You can see how long it took, as well as the database calls that were made to insert the record.
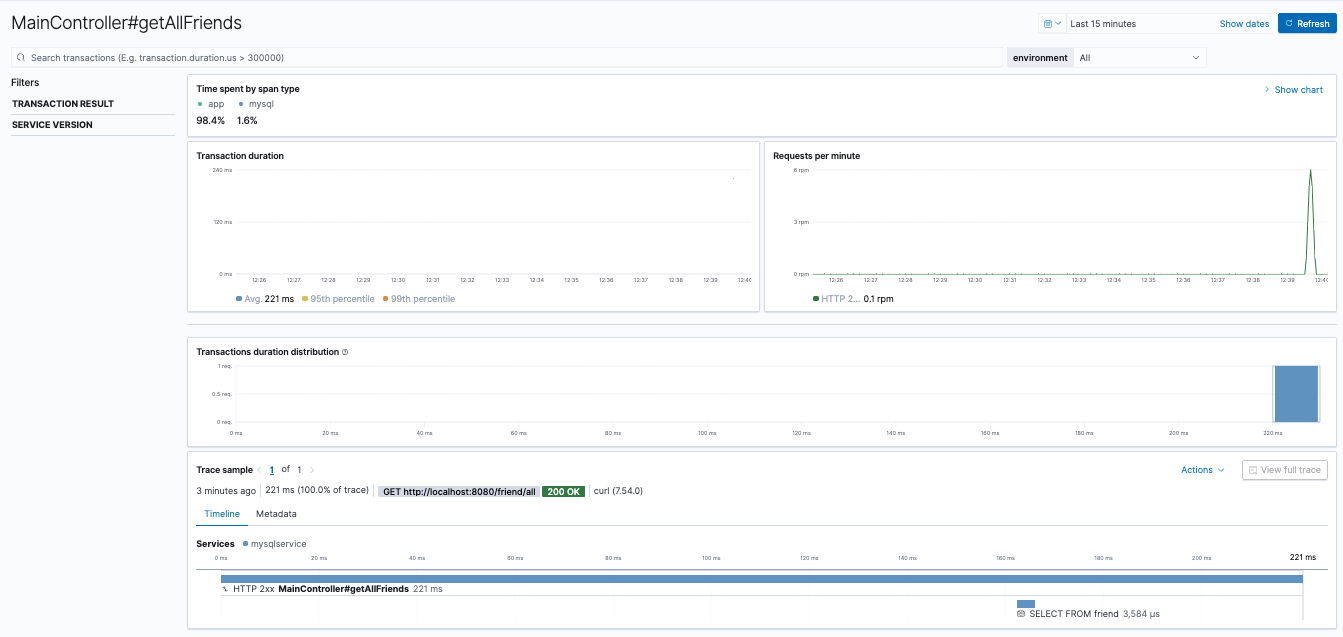
Go back and click on the getAllFriends transaction. Click on the bars in the transaction spans to get additional details. You can even see the SQL query generated by Java Spring.
Now generate an error by attempting to add a friend without providing their name:
curl localhost:8080/friend/add
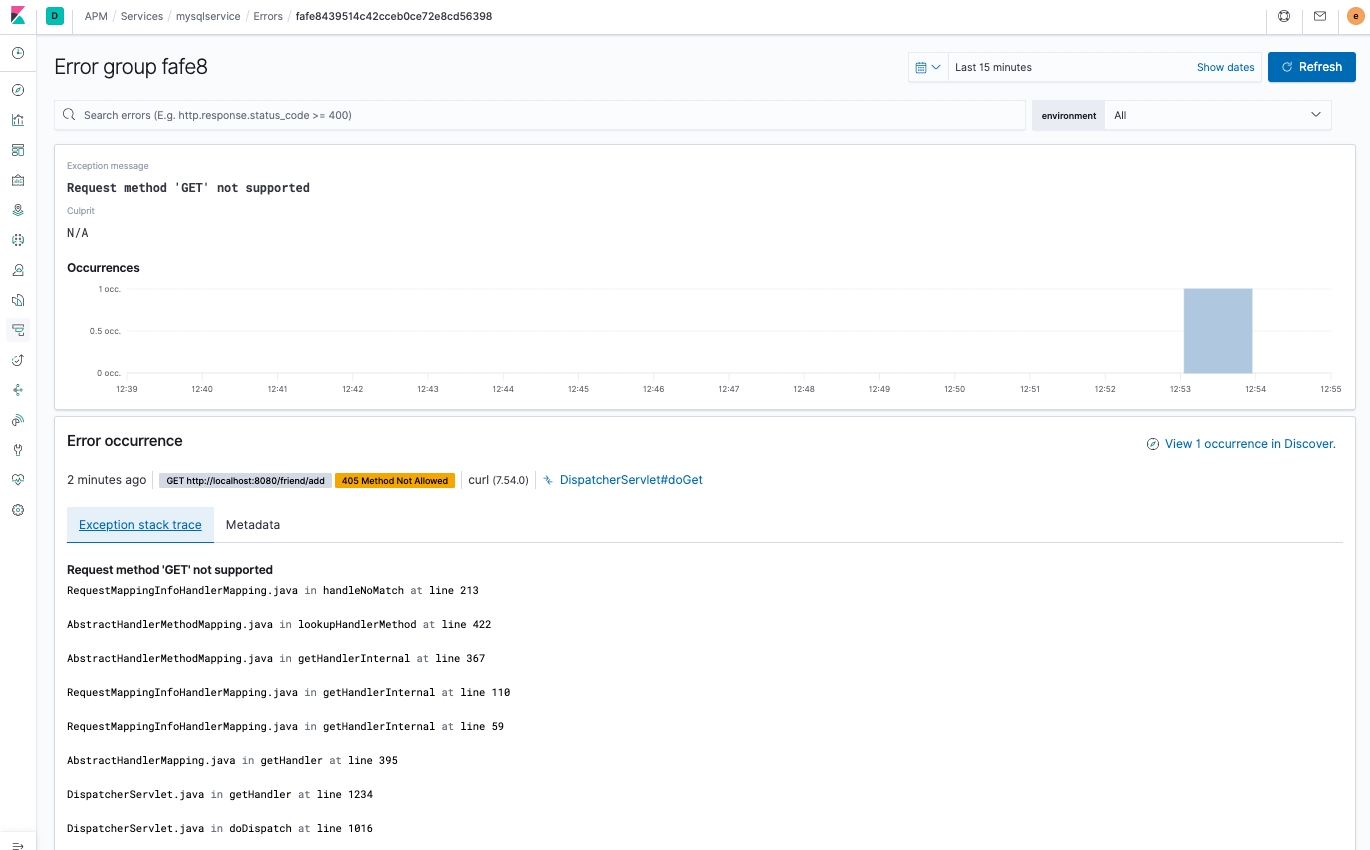
Go back to Kibana and find the error and what caused it. Make sure you refresh the Kibana screen or set it to refresh every 10 seconds or so.
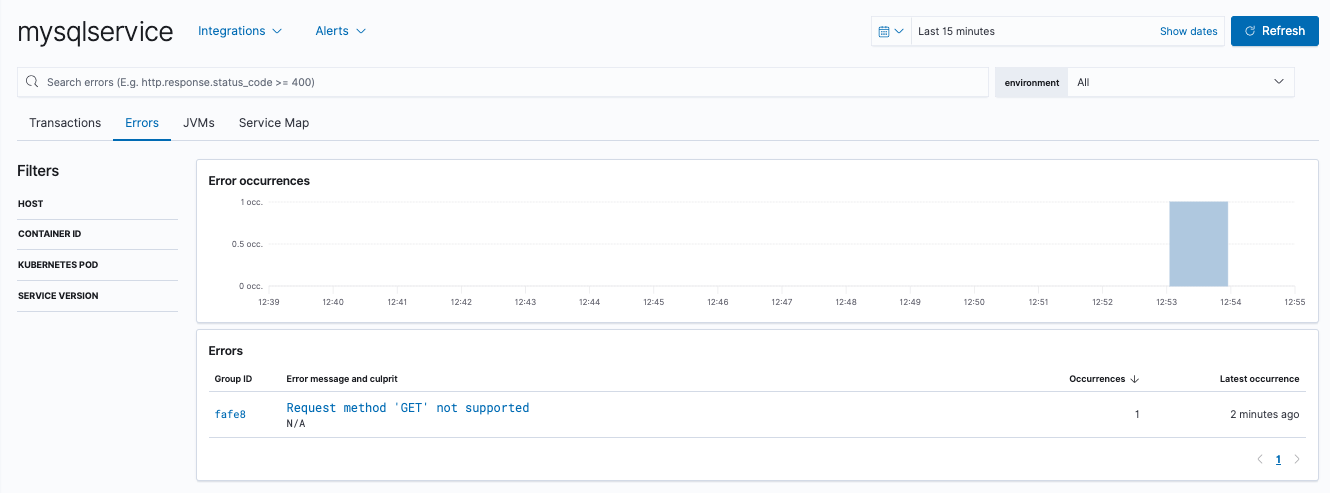
In this case, the error was caused by sending a GET request — something not handled by our application’s controller.
Try sending a POST request without data and find what the error is in that case.
curl -XPOST "http://localhost:8080/friend/add"
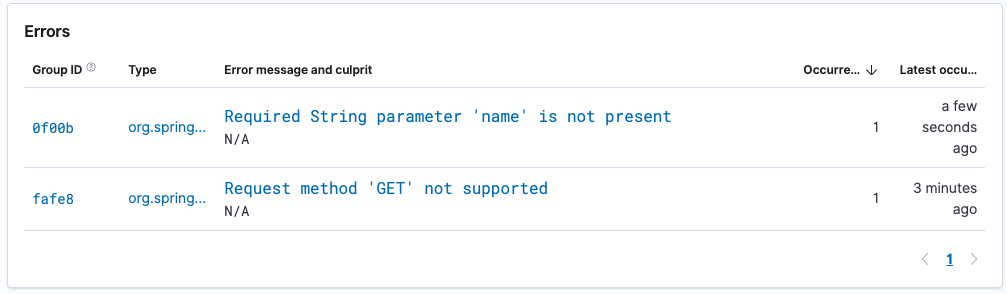
In this case, the http method was handled, but a required parameter was not supplied in the request. We can drill down and view the exception stack trace.
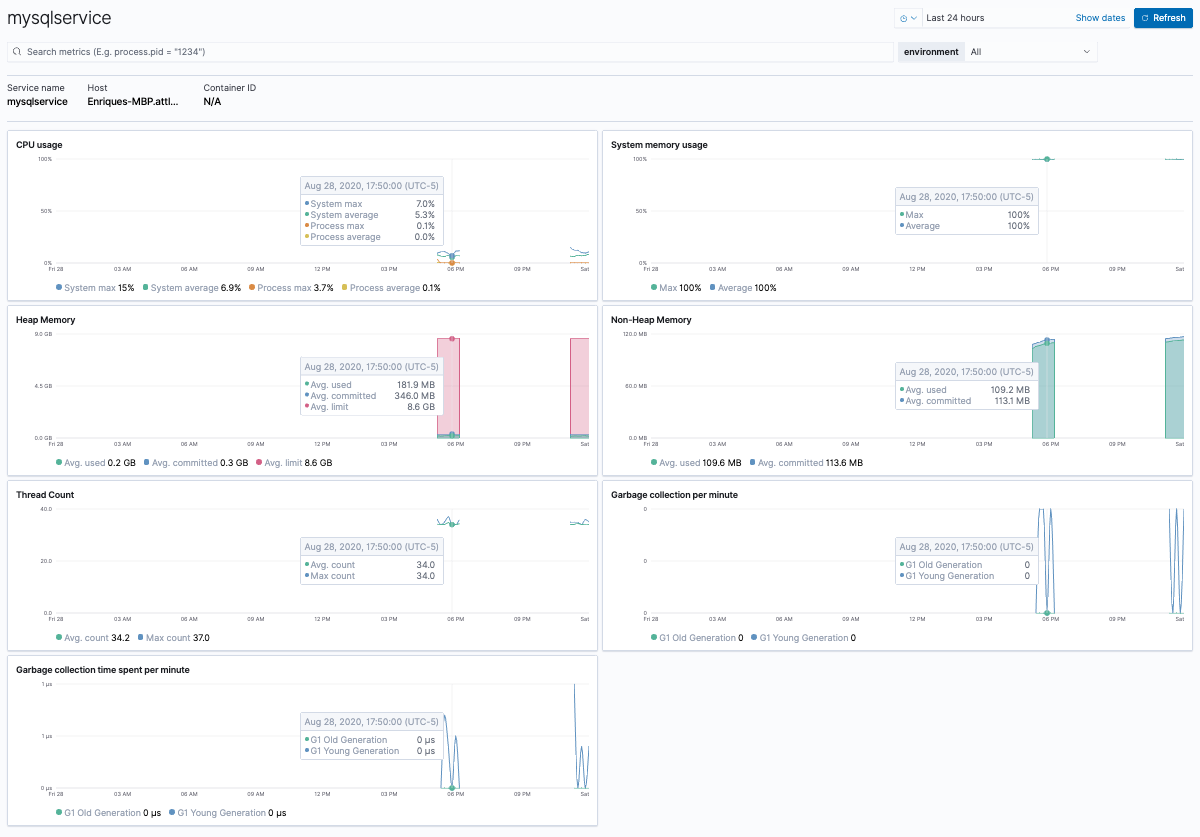
The performance of a Java application depends heavily on the JVM. As the application runs, we can monitor not just the code, but the JVM health during the period when the transaction ran. Go back to the mysqlservice transaction, click on the JVM tab, and then click on the JVM listed on the table. You will see JVM metrics, including CPU and memory usage, thread counts, and garbage collection statistics.
Thanks to the Java Agent and Elastic APM, we can see deep into a Java application and get timings of the services and database calls it makes during a transaction. We can also see any errors that have occurred and their stack traces. We can even observe the health of the JVM during the period of the transaction. All of this without having to recompile the application — there is even a way to attach the Java Agent to a running application without having to restart it!
Summary and what’s next
We have covered a fair amount of ground, but have barely started our journey monitoring Java applications. So far, we have instrumented a single microservice. This allowed us to observe transaction metrics and errors within that microservice. Throughout, we used the APM app in Kibana to navigate through transactions, spans, and errors. There is a lot more we can do to observe an application. We can correlate a transaction with the application logs belonging to it. We can instrument and monitor specific methods in the application we suspect of running too slow. We can instrument a multiservice application so we can observe a full trace and navigate through the individual service transactions. Finally, after we collect all the data we can squeeze out of a Java application, we can use the various Kibana apps, not just the APM app, to explore, analyze, and act on it. All of these topics, plus some additional ideas for your continued learning about Java monitoring with Elastic Observability, will be covered in the next blog post. So save the work you have done up to this point and stay tuned for the next part!