Elastic Observability in SRE and Incident Response
The case for service reliability
Software services are at the heart of modern business in the digital age. Just look at the apps on your smartphone. Shopping, banking, streaming, gaming, reading, messaging, ridesharing, scheduling, searching — you name it. Society runs on software services. The industry has exploded to meet demands, and people have many choices on where to spend their money and attention. Businesses must compete to attract and retain customers who can switch services with the swipe of a thumb.
Service reliability is a universal expectation. You would expect any service to be fast and functional, and if not you would "swipe left" and choose a service that respects your time. Amazon famously lost an estimated $1.2 million per minute during its downtime on Amazon Prime Day in 2018. But you don't need to be a tech giant to make the case for service reliability. Downtime and degradation can harm the reputation of any business long after the immediate loss of revenue. That is why businesses invest heavily in operations, spending an estimated $5.2 billion on DevOps software in 2018.
This blog explores the practice of site reliability engineering, the incident response lifecycle, and the role of Elastic Observability in maximizing reliability. The content is relevant to technical leaders and engineers who have the responsibility to ensure that a software service meets the expectations of its users. By the end, you should have a clear and basic understanding of how operations teams perform site reliability engineering and incident response, and how they achieve their objectives using a technology solution such as Elastic Observability.
What is SRE?
Site reliability engineering (SRE) is the practice of ensuring that a software service meets the performance expectations of its users. In short, SRE keeps services reliable. The responsibility is as old as "software as a service" itself. Recently engineers at Google coined the term "site reliability engineering" and codified their framework in what has become a widely influential book, Site Reliability Engineering. This blog borrows from the concepts of that book.
Site reliability engineers (SREs) are responsible for achieving service level objectives using indicators such as availability, latency, quality, and saturation. These types of variables directly influence the user experience of a service. Hence the business case for SREs: a satisfactory service generates revenue, and efficient operations control costs. To that end, SREs often have two jobs: managing incident response to protect service reliability; and instituting solutions and best practices by which the development and operations teams can optimize service reliability and reduce the cost of toil.
SREs often express the desired state of services in terms of SLAs, SLOs, and SLIs:
- Service Level Agreement (SLA) - "What does the user expect?" An SLA is a promise that a service provider makes to its users on the behavior of its service. Some SLAs are contractual and compel the service provider to compensate customers affected by a breach of the SLA. Others are implicit and based on observed user behavior.
- Service Level Objective (SLO) - "When do we take action?" An SLO is an internal threshold above which the service provider takes action to prevent a breach of an SLA. For example, if the service provider promises an SLA of 99% availability, then a stricter SLO of 99.9% availability might give them enough time to prevent a breach of the SLA.
- Service Level Indicator (SLI) - "What do we measure?" An SLI is an observable metric that describes the state of an SLA or SLO. For example, if the service provider promises an SLA of 99% availability, then a metric such as the percentage of successful pings to the service might serve as its SLI.
Here are some of the most common SLIs monitored by SREs:
- Availability measures the uptime of a service. Users expect a service to respond to requests. This is one of the most basic and important metrics to monitor.
- Latency measures the performance of a service. Users expect a service to respond to requests in a timely manner. What users perceive as "timely" varies by the type of request they submit.
- Errors measure the quality and correctness of a service. Users expect a service to respond to requests in a successful manner. What users perceive as "successful" varies by the type of request they submit.
- Saturation measures the resource utilization of services. This can indicate the need to scale resources to meet the demands of the service.
Everyone who develops and operates a service is responsible for its reliability, even if they don't carry the job title of Site Reliability Engineer. Traditionally this includes:
- The product team who leads the service.
- The development team who builds the service.
- The operations team who runs the infrastructure.
- The support team who escalates incidents for users.
- The on-call team who resolves incidents.
Organizations with complex services may have a dedicated team of SREs to lead the practice and mediate the other teams. For them, SREs are a bridge between "Dev" and "Ops." Ultimately, regardless of implementation, site reliability is a collective responsibility in the cycle of DevOps.
What is incident response?
Incident response, in the context of SRE, is an effort to bring a deployment from an undesired state back to its desired state. SREs understand the desired states, and they often manage the incident response lifecycle to maintain those desired states. Generally the lifecycle involves prevention, discovery, and resolution, with the end goal being to automate as much as possible. Let's double click on those.
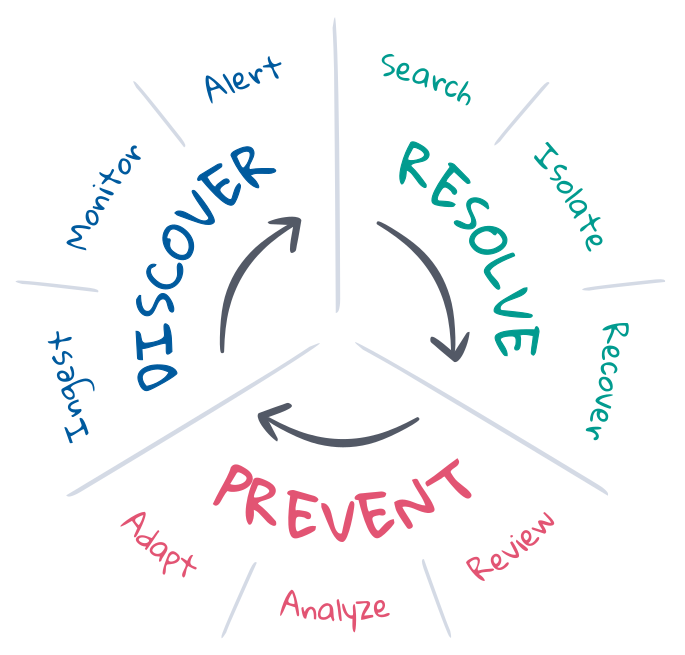
Prevention is the first and last step of incident response. Ideally incidents are prevented with test driven development in the CI/CD pipeline. But things don't always go as planned in production. SREs optimize prevention through planning, automation, and feedback. Before the incident, they define the criteria for desired state and implement the tooling needed to discover and resolve undesired state. After the incident, they hold a postmortem to review what happened and discuss how to adapt. Over the long run, they can analyze KPIs and use those insights to submit enhancement requests to the product, development, and operations teams.
Discovery is knowing when an incident might have occurred and then alerting the right channels to respond. Discovery should be automated to maximize incident response coverage, minimize the mean time to discover (MTTD), and protect the SLOs. Automation requires continuous observability into the state of the entire deployment, continuous monitoring of the desired state, and immediate alerting in the event of undesired state. The coverage and relevance of incident discovery depends largely on the definitions of desired state, although machine learning can help discover unexpected state changes that might indicate or explain incidents.
Resolution is bringing a deployment back to its desired state. Some incidents have automated solutions, such as autoscaling services when capacity is nearly saturated. But many incidents require human attention, especially when the symptoms are unrecognized or the cause is unknown. Resolution requires the right experts to investigate the root cause, isolate and reproduce the issue to prescribe a solution, and recover the desired state of the deployment. This is an iterative process that can rotate through many experts, investigations, and failed attempts. Search and communication are central to its success. Information shortens the cycles, minimizes the mean time to resolution (MTTR), and protects the SLOs.
Elastic in SRE and incident response
Elastic Observability drives the incident response lifecycle with observability, monitoring, alerting, and search. This blog introduces its ability to deliver continuous observability of full stack deployment state, continuous monitoring of SLIs for breaches of SLOs, automated alerts of breaches to the incident response team, and intuitive search experiences that lead the responders to a swift resolution. Collectively the solution minimizes the mean time to resolution (MTTR) to protect service reliability and customer loyalty.
Observability and data
You can't resolve an issue if you can't observe it. Incident response requires visibility into the full stack of the affected deployment over time. But distributed services are rife with complexity even for a single logical event, as illustrated below. Each component of the stack is a potential source of degradation or failure for everything downstream. Incident responders must consider, if not control for and reproduce, the state of each component during resolution. Complexity is the bane of productivity. It's impossible to resolve an incident within the limits of a strict SLA unless there is a single place to observe the state of everything over time.
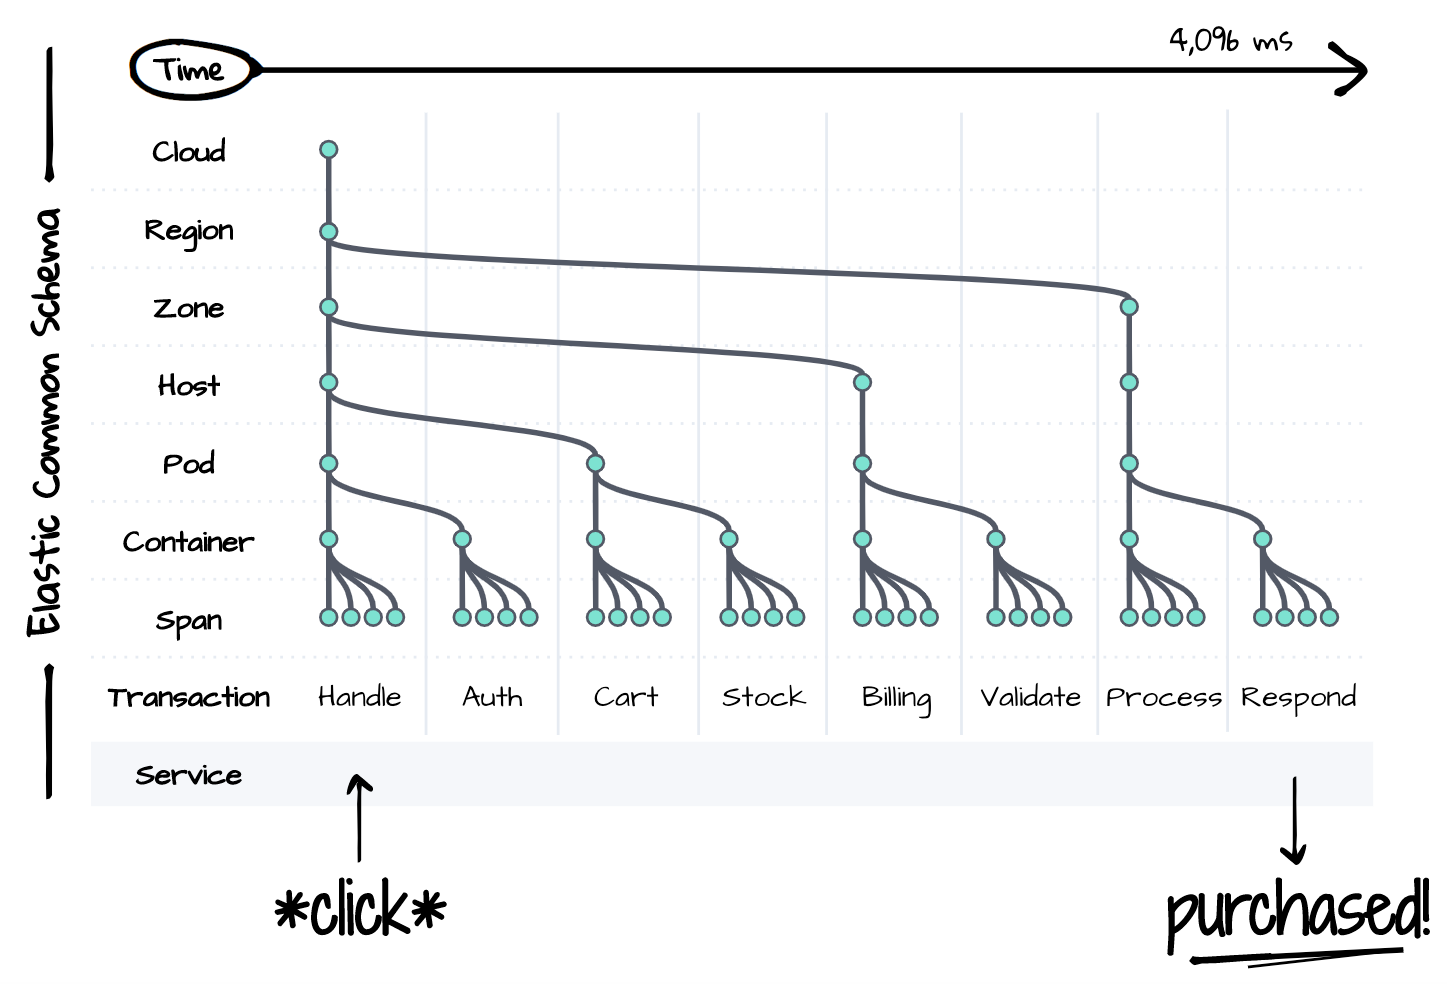
The Elastic Common Schema (ECS) is our answer to the complexity problem. ECS is an open source data model specification for observability. It standardizes the naming conventions, data types, and relationships of modern distributed services and infrastructure. The schema presents a unified view of the entire deployment stack over time using data that once traditionally existed in silos. Traces, metrics, and logs at each layer of the stack coexist in this one schema to enable a seamless search experience during incident response.
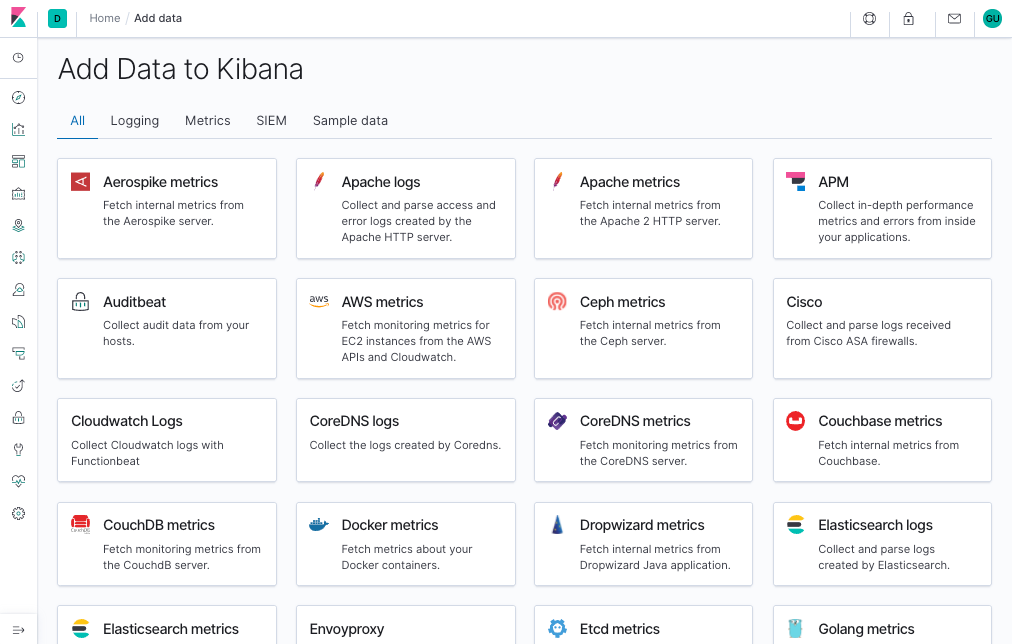
ECS standardization makes it possible to maintain observability with little effort. Elastic's APM and Beats agents automatically capture traces, metrics, and logs from your deployments, conform the data to the common schema, and ship the data to a central search platform for future investigation. Integrations with popular data sources such as cloud platforms, containers, systems, and application frameworks make it easy to onboard and manage data as your deployments grow more complex.
Every deployment stack is unique to its business. That is why you can extend ECS to optimize your incident response workflow. Project names of services and infrastructure help responders find what they're looking for — or know what they're looking at. Commit IDs of applications help developers find the origin of bugs as they existed in the version control system at build time. Feature flags offer insights on the state of canary deployments or the results of A/B tests. Anything that helps describe your deployments, execute your workflows, or fulfill your business requirements can be embedded in the schema.
Monitoring, alerting, and actions
Elastic Observability automates the incident response lifecycle by monitoring, discovering, and alerting on the essential SLIs and SLOs. The solution covers four areas of monitoring: Uptime, APM, Metrics, and Logs. Uptime monitors availability by sending external heartbeats to the service endpoints. APM monitors latency and quality by measuring and capturing events directly from within the applications. Metrics monitors saturation by measuring infrastructure resource utilization. Logs monitors correctness by capturing messages from systems and services.
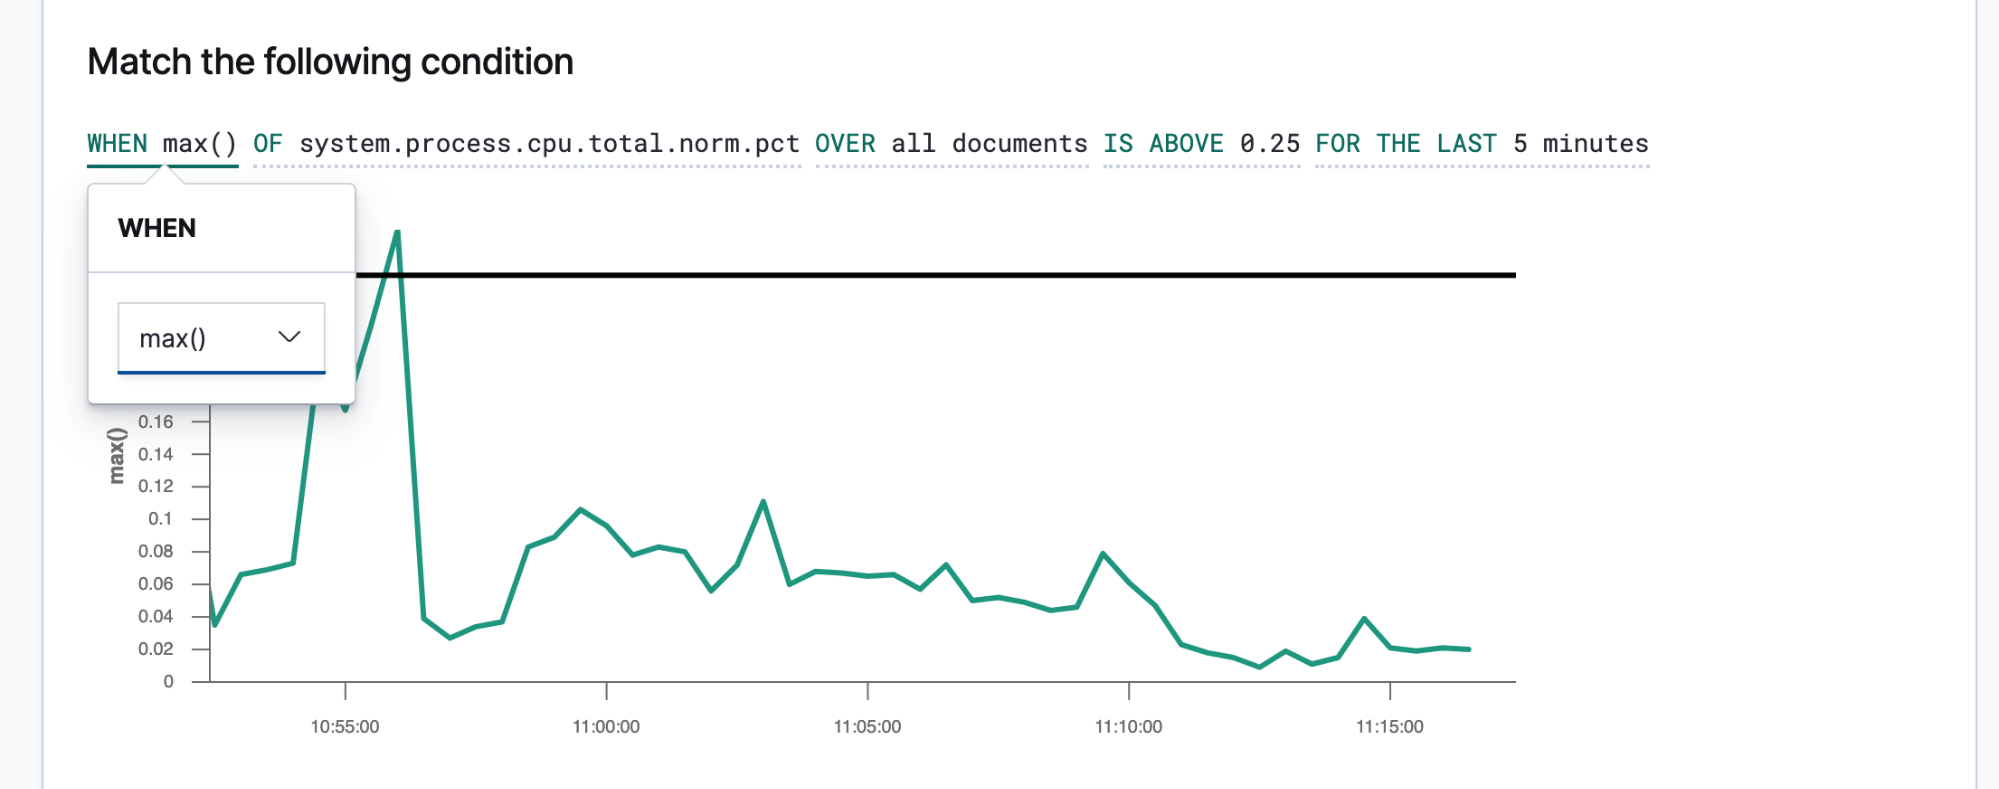
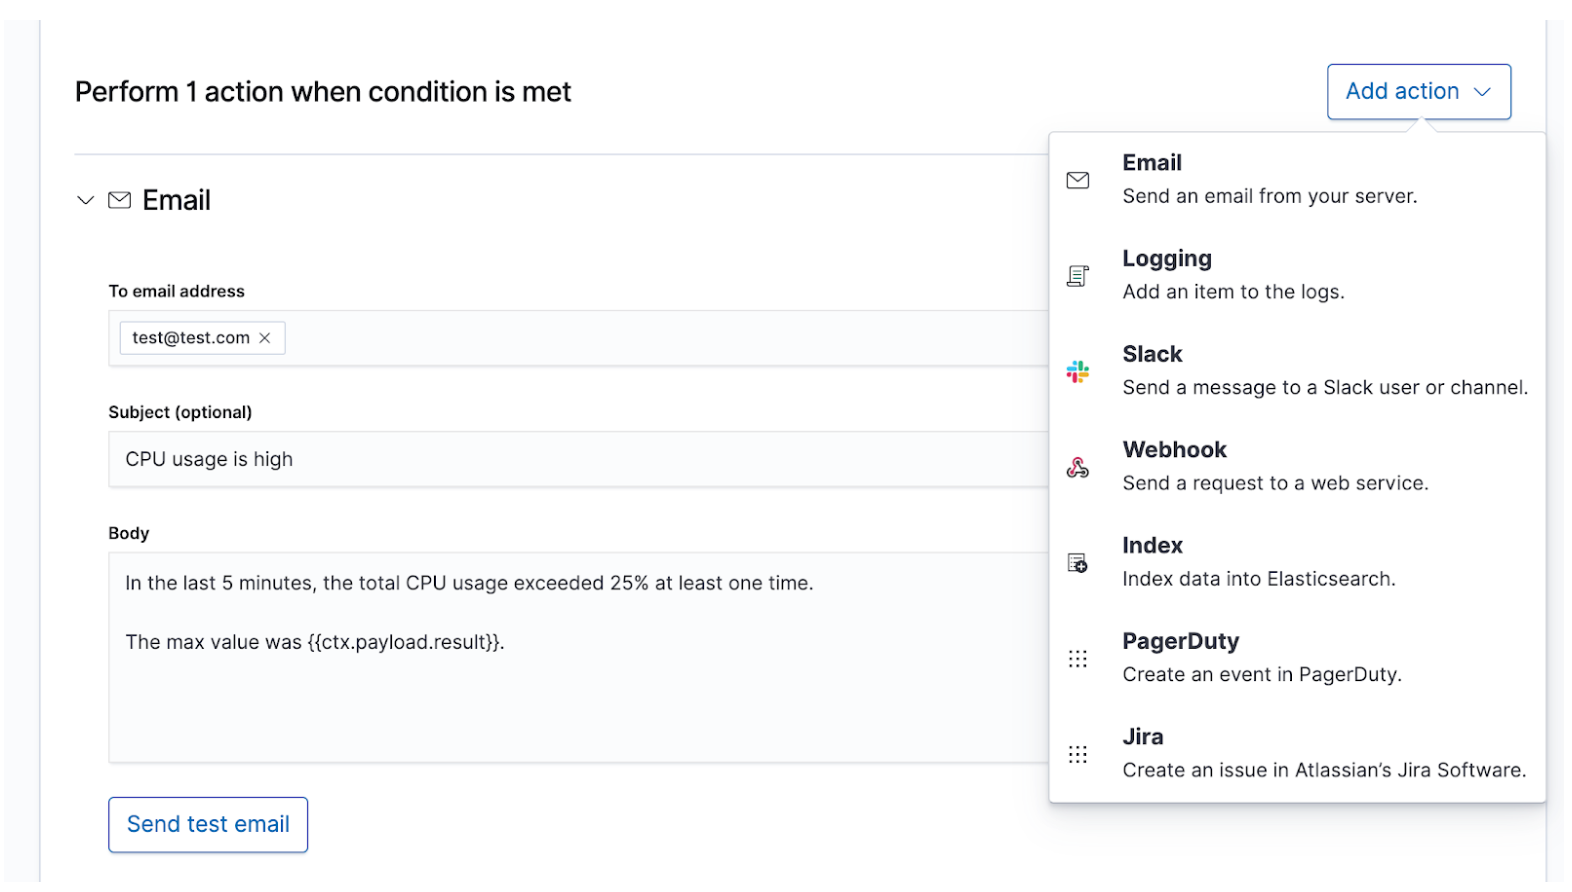
Once you know your SLIs and SLOs, you can define them as alerts and actions to share the right data with the right people whenever an SLO is breached. Elastic alerts are scheduled queries that trigger actions when the results meet some conditions. Those conditions are expressions of metrics (SLIs) and thresholds (SLOs). Actions are messages delivered to one or more channels, such as a paging system or issue tracking system, to signal the start of an incident response process.
Alerts that are succinct and actionable will guide the responders toward a rapid resolution. Responders need to have enough information to reproduce the state of the environment and the observed issue. You should create a message template that provides those details to the responders. Here are some details to consider including:
- Title - "What is the incident?"
- Severity - "What is the priority of the incident?"
- Rationale - "What is the business impact of this incident?"
- Observed state - "What happened?"
- Desired state - "What was supposed to happen?"
- Context - "What was the state of the environment?" Use data from the alert to describe the time, cloud, network, operating system, container, process, and other context of the incident.
- Links - "Where do I go next?" Use data from the alert to create links that take the responders to dashboards, error reports, or other useful destinations.
Higher severity incidents that require immediate human attention should alert the on-call incident response team through real-time channels such as PagerDuty or Slack. An example would be downtime for a service that requires at least 99% availability. This SLA permits less than 15 minutes of downtime per day, which already is less time than what the incident response team might need to resolve the issue. Lower severity incidents that require eventual human attention could create a ticket in an issue tracking system such as JIRA. An example would be a rise in latency or error rates for services that don't directly impact revenue. You may choose to alert multiple destinations at once, each with its own message contents, for the purpose of record keeping or overcommunication.
Investigation and search
What happens after paging the on-call team with an alert? The path to resolution will vary by incident, but some things are certain. There will be people with different skills and experiences working under pressure to solve an unclear problem quickly and correctly, while dealing with a firehose of data. They will need to find the reported symptoms, reproduce the issue, investigate the root cause, apply a solution, and see if it resolves the issue. They may need to make a few attempts. They may discover they went down a rabbit hole. The entire effort requires caffeine answers. Information is what drives incident response from uncertainty to resolution.
Incident response is a search problem. Search delivers prompt and relevant answers to questions. A good search experience is more than just "the search bar" — the entire user interface anticipates your questions and guides you to the right answers. Think back to your last experience of online shopping. As you browse the catalog, the application anticipates the intent of your clicks and searches to give you the best recommendations and filters, which influences you to spend more and spend sooner. You never write a structured query. You might not even know what you're looking for, and yet you find it quickly. The same principles apply to incident response. The design of the search experience has great influence on the time to resolve an incident.
Search is key to rapid incident response not just because the technology is fast, but because the experience is intuitive. Nobody has to learn the syntax of a query language. Nobody has to reference a schema. Nobody has to be perfect like a machine. Just search, and you will find what you are looking for in seconds. Did you mean to search for something else? Search can give you guidance. Want to search by a specific field? Start typing and the search bar will suggest fields. Curious about a spike on a chart? Click the spike and the rest of the dashboard will show what happened during the spike. Search is fast and forgiving, and when done right it gives incident responders the power to act quickly and correctly despite their human imperfections.
Elastic Observability presents a search experience for incident response that anticipates the questions, expectations, and objectives of incident responders. The design offers a familiar experience for each of the traditional data silos — Uptime, APM, Metrics, Logs — and then guides responders across those experiences to see the full stack of the deployment. This is possible because the data itself exists in a common schema, not in silos. Effectively the design answers the initial questions of availability, latency, errors, and saturation, and then navigates to the root cause using whichever experience is right for it.
Let's walk through some examples of this experience.
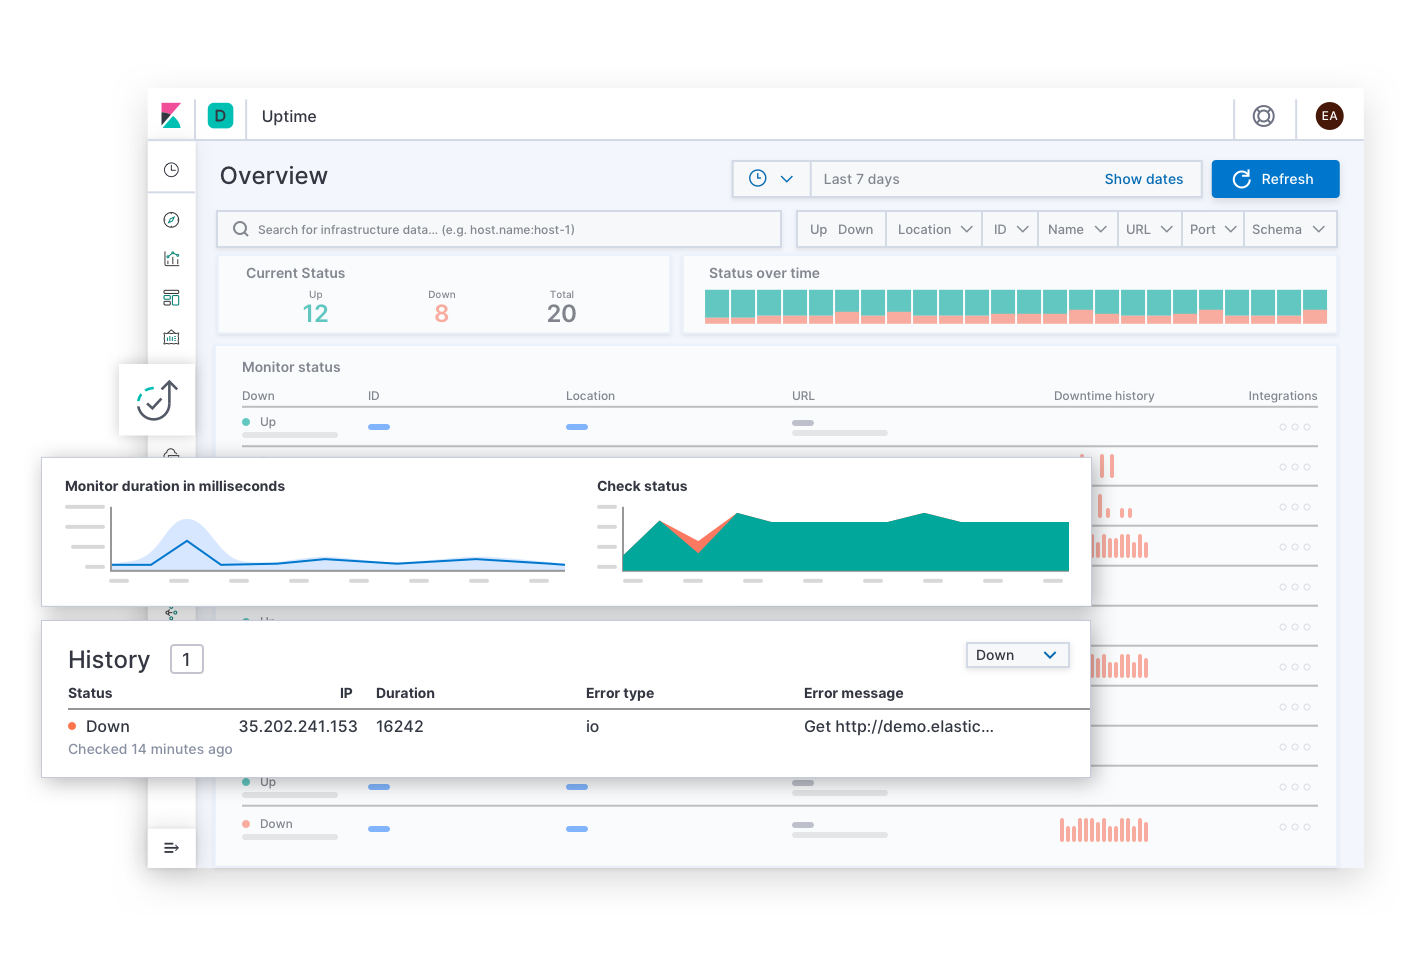
Elastic Uptime answers the basic questions on service availability such as, "Which services are down? When was a service down? Was the uptime monitoring agent down?" Alerts for availability SLOs might take the incident responder to this page. After finding the symptoms of an unavailable service, the responder can follow links to explore the traces, metrics, or logs of the affected service and its deployment infrastructure at the time of failure. As the responder navigates, the context of the investigation remains filtered on the affected service. This helps the responder drill down to the root cause of downtime for that service.
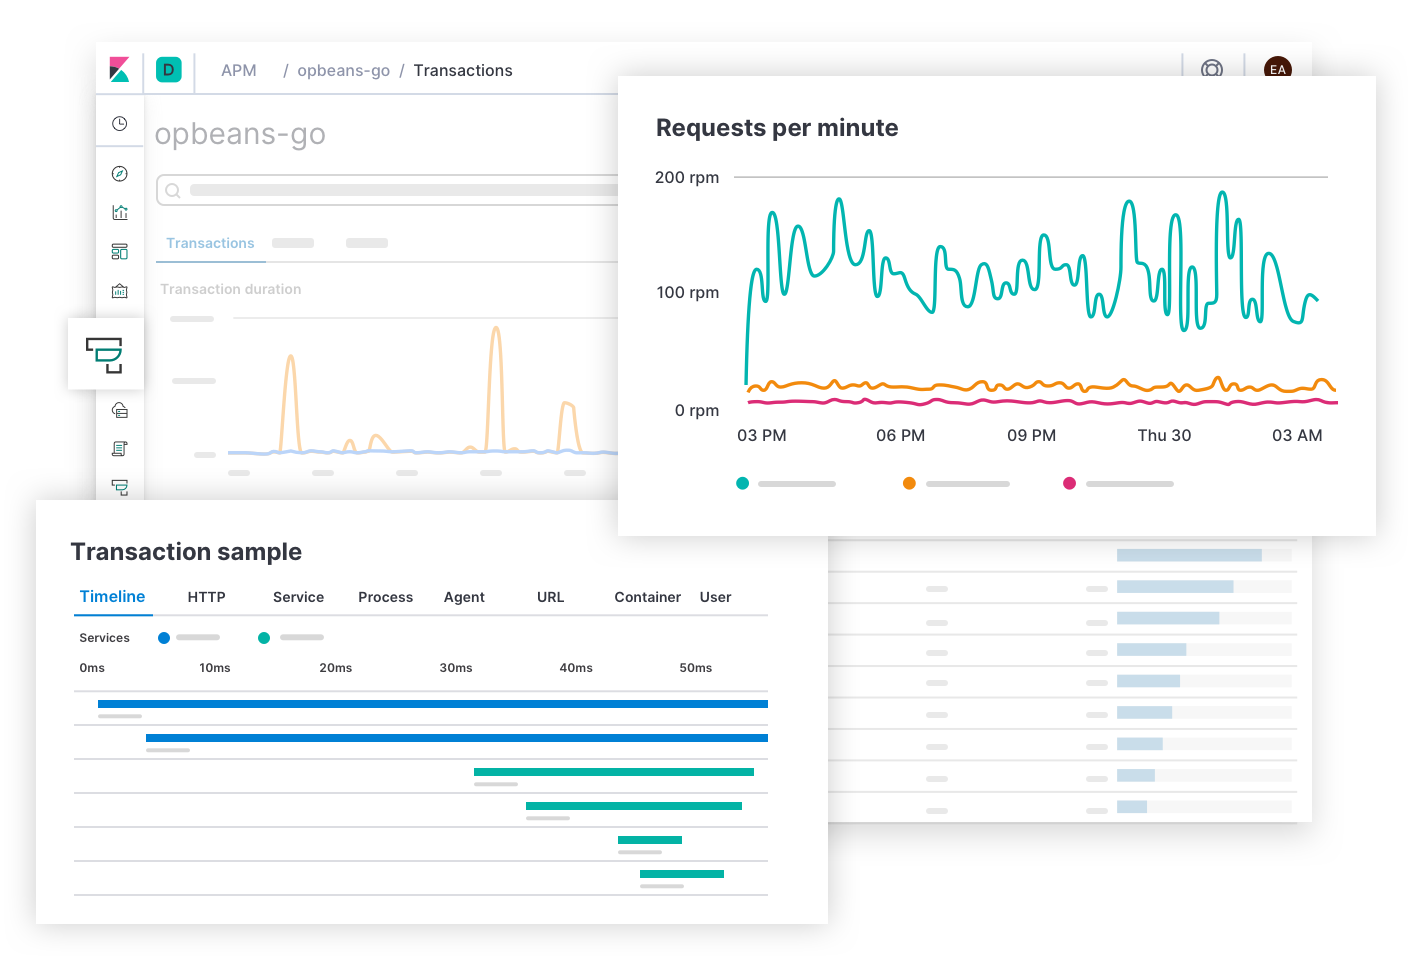
Elastic APM answers questions on service latency and errors such as, "Which endpoints have the greatest negative impact on user experience? Which spans are slowing down transactions? How do I trace the transactions of distributed services? Where in the source code are any errors? How can I reproduce an error in a development environment that matches the production environment?" Alerts for latency and error SLOs might take the incident responder to this page. The APM experience gives application developers the information they need to find, reproduce, and fix bugs. Responders can explore the cause of any latency by navigating lower in the stack to view the metrics of the deployment infrastructure of an affected service.
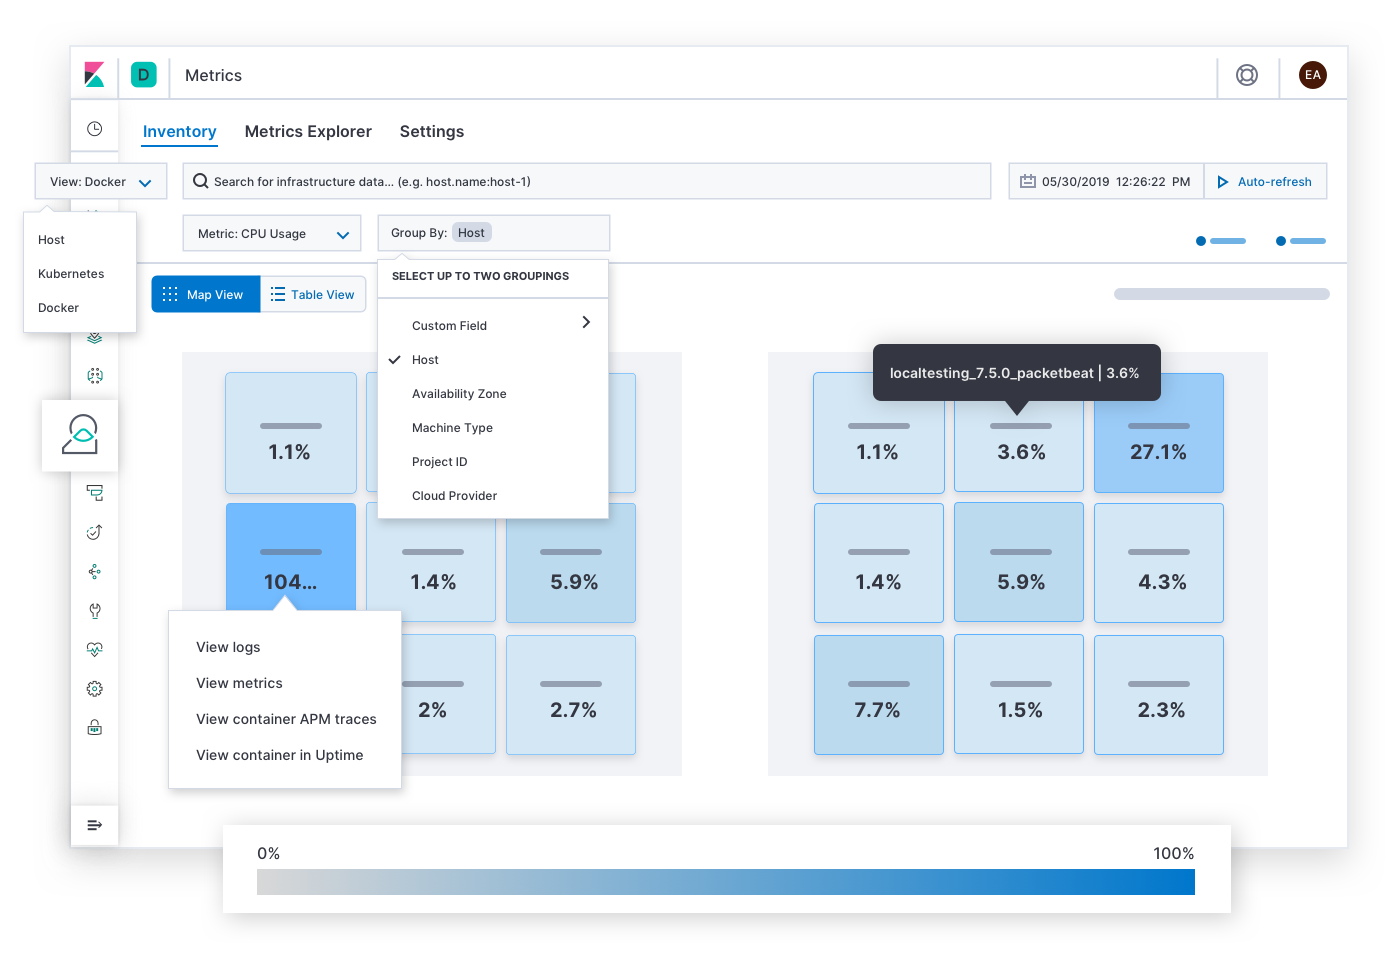
Elastic Metrics answers questions on resource saturation such as, "Which hosts, pods, or containers have high or low consumption of memory? Storage? Compute? Network traffic? What if I group them by cloud provider, geographic region, availability zone, or some other value?" Alerts for saturation SLOs might take the incident responder to this page. After finding symptoms of congestion, hot spots, or brownouts, the responder can expand the historical metrics and logs of the affected infrastructure, or drill down to explore the behavior of services running on them.
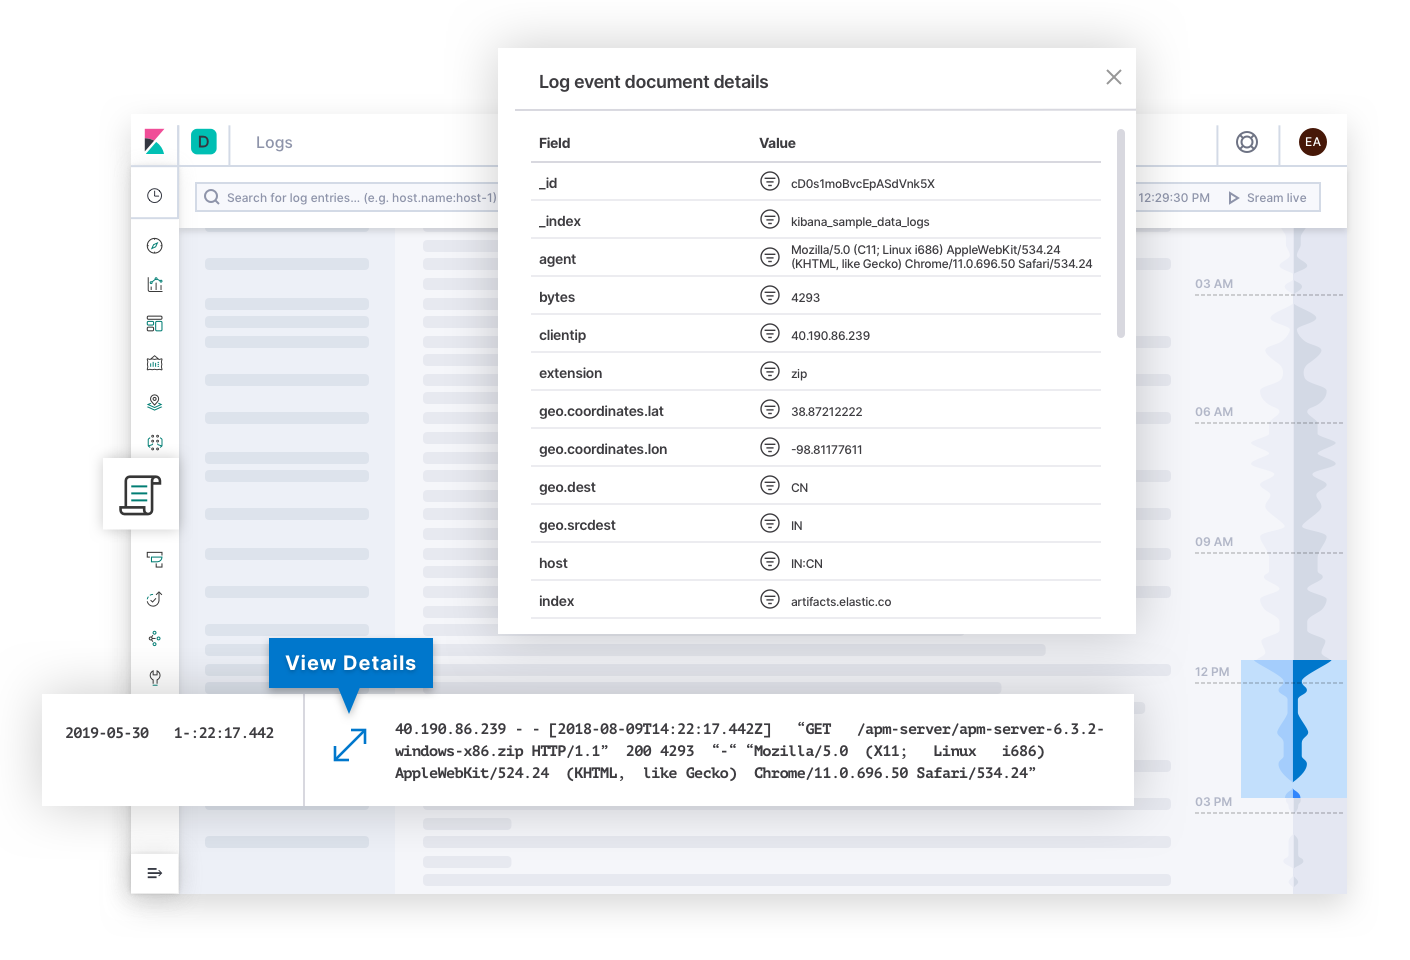
Elastic Logs answers questions on the source of truth for events emitted by systems and applications. Alerts on quality or correctness SLOs might take the incident responder to this page. Logs might explain the root cause of failure and become the final destination of the investigation. Or they might explain the cause of other symptoms that eventually lead the responder toward the root cause. Behind the scenes, the technology can categorize logs and discover trends in the text to give incident responders signals that can explain changes to the state of a deployment.
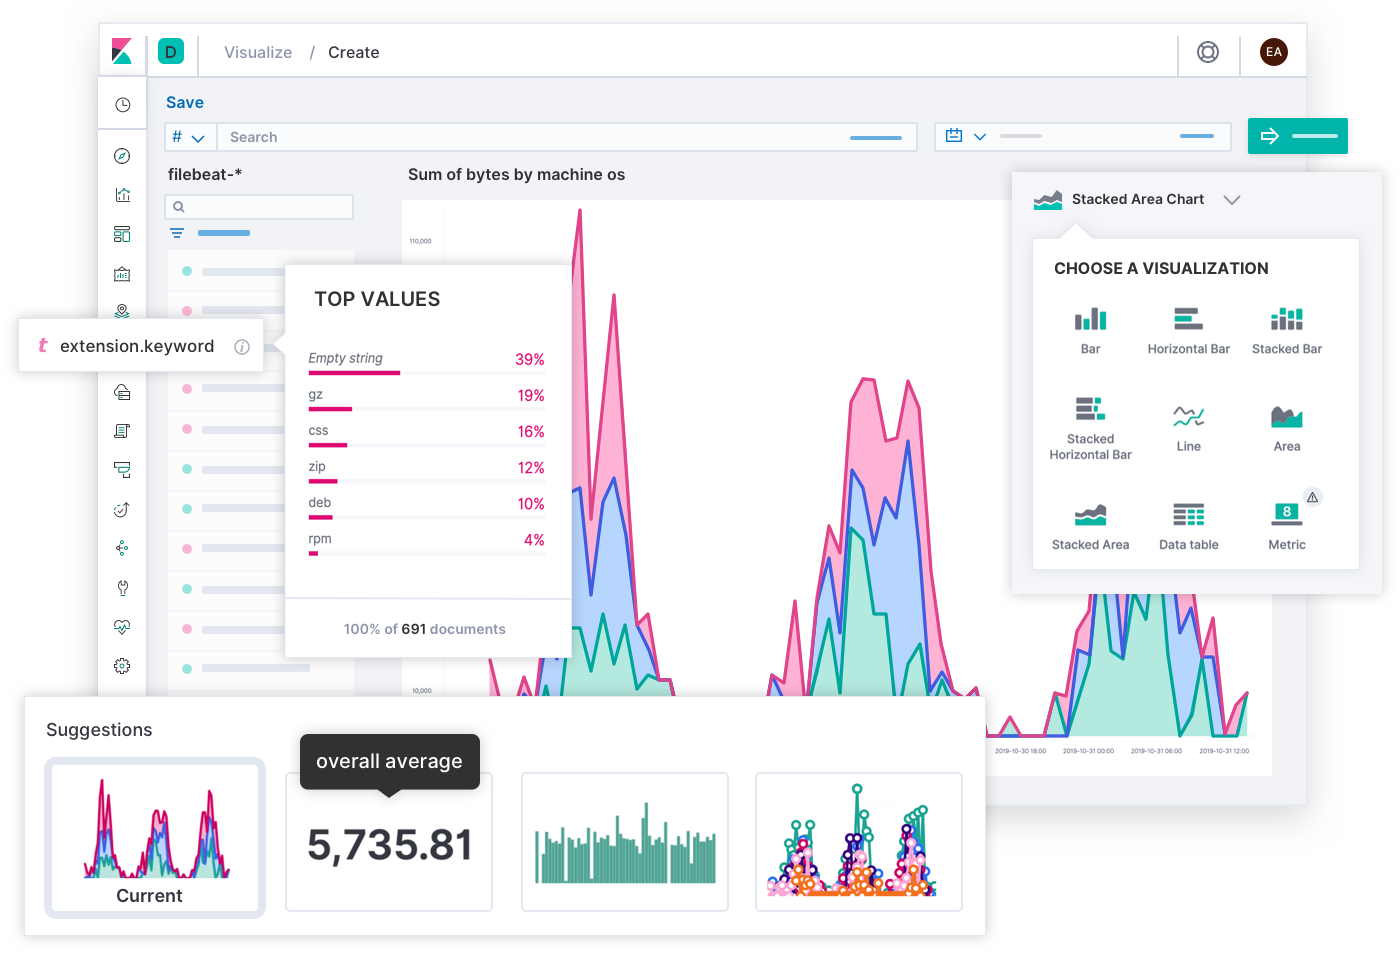
The engineers at Elastic designed a widely applicable search experience for observability thanks to the input of thousands of customers and community members. Ultimately, SREs are the experts of their own deployments, and you might envision a different experience that is optimal to the unique needs of your operation. That is why you can build your own custom dashboards and visualizations using any data in Elastic, and share them with anyone who should use them. It's as simple as drag and drop.
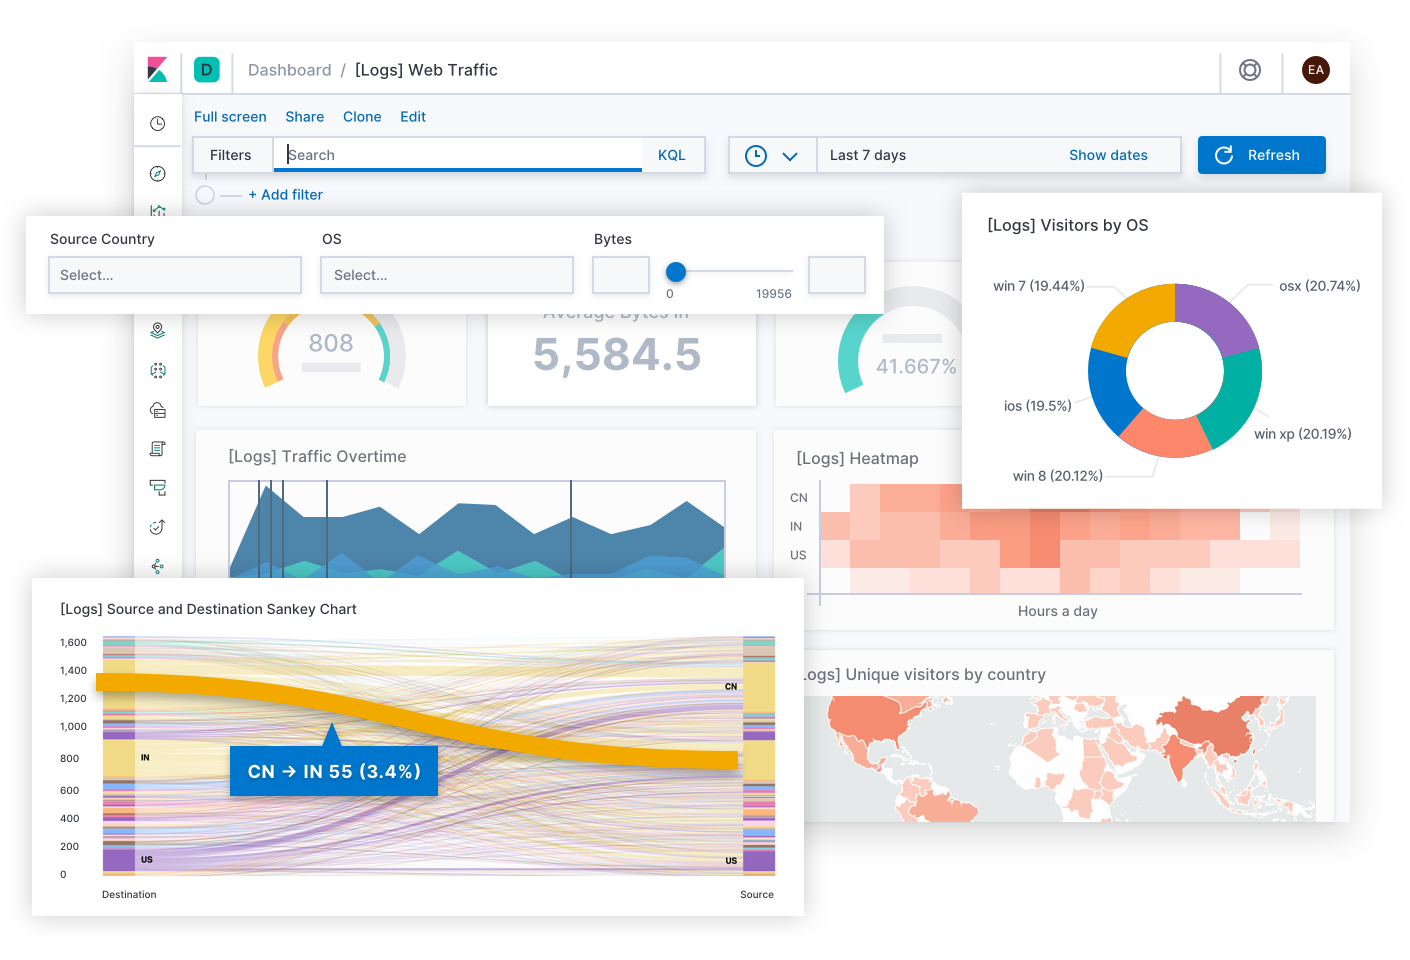
Beyond the daily toil, Canvas is a creative medium to express KPIs across teams or up the leadership chain. Think of these as infographics that tell business stories, rather than dashboards that solve technical issues. What better way to show today's user experience than a grid of SLOs disguised as happy and sad faces? What better way to explain today's remaining error budget than a banner that says, "You have 12 minutes to test code in production! (Please don't do this.)" When you know your audience, Canvas lets you frame a complex situation into a meaningful story they can follow.
Examples
Let's see a few practical examples of Elastic Observability. Each scenario starts with an alert for a different SLI, and each has a unique path to resolution that might involve people from different teams. Elastic helps the incident response teams progress toward a swift resolution under diverse circumstances.
Availability: Why is the service down?
Elastic pages the on-call team after detecting an unresponsive service that requires 99% availability. Ramesh from the operations team takes command. He clicks a link to see the uptime history. He verifies that the monitoring agent is healthy, so the alert is unlikely to be a false positive. He navigates from the affected service to see the metrics of its host, and then groups the metrics by hosts and containers. No containers on the host are reporting metrics. "The issue must be higher in the stack." He regroups the data by availability zones and hosts. Other hosts are healthy in the affected zone. But when he filters by hosts running a replica of the affected service, the hosts report nothing. "Why are hosts failing only for this one service?" He shares a link to the dashboard on the #ops channel in Slack. An engineer says she recently updated the playbook that configures the hosts that run that service. She rolls back the changes, and then the metrics stream into view. The bleeding stops. They resolved the issue in 12 minutes — still within the 99% SLA. Later the engineer will review the host logs to troubleshoot why her changes brought the host down, and then make a proper change.
Latency: Why is the service slow?
Elastic creates a ticket in the issue tracking system after detecting anomalous latency in multiple services. The application developers hold a meeting to review sample traces to find spans that contribute most to the latency. They see a pattern of latency for services that interface with a data validation service. Sandeep, the developer who leads that service, digs into its spans. The spans are reporting long running queries to the database, which are corroborated by an anomalous log rate from the slowlog. He inspects the queries and reproduces them in a local environment. The statements were joining unindexed columns, which had gone unnoticed until a recent bulk insertion of data caused a slowdown. His table optimization improves the service latency, but not to its required SLO. He shifts his investigation by comparing the sample trace to an earlier version of his service using contextual filters. There are new spans processing the query results. He follows the stack trace in his local environment to a method that evaluates a set of regular expressions for each query result. He adjusts the code to precompile the patterns before the loop. After committing his changes, the latencies of the services return to their SLOs. Sandeep marks the issue as resolved.
Errors: Why is the service raising errors?
Esther is a software developer who leads the account registration service for an online retailer. She receives a notification from her team's issue tracking system. The issue says that Elastic detected an excessive error rate from the production registration service in the Singapore region, which could be jeopardizing new business. She clicks a link in the issue description which takes her to an error group for an unhandled "Unicode Decode Error" in the form submission endpoint. She opens a sample and finds details on the culprit including the file name, the line of code where the error was thrown, the stack trace, context about the environment, and even the commit hash of the source code when the application was built. She sees the registration form inputs with some data redacted to comply with privacy regulations. She notices that the inputs contain Vietnamese Unicode characters. She reproduces the issue on her local machine using all of this information. After fixing the Unicode handler she commits her changes. The CI/CD pipeline runs her tests, which pass, and then deploys the updated application in production. Esther marks the issue as resolved and continues with her normal work.
Saturation: Where is capacity about to fill up?
Elastic creates a ticket in the issue tracking system after detecting an anomaly in memory usage, listing the cloud region as an influencer. An operator clicks a link to see regional memory usage over time. The Berlin region shows a sudden spike indicated by a red dot, after which the usage climbs slowly over time. She forecasts that memory will run out soon if this continues. She views the recent memory metrics of all pods worldwide. Pods in Berlin clearly stand out as more saturated than other regions. She narrows the search by grouping pods by service name and filtering by Berlin. One service stands out — the product recommendation service. She expands the search to see replicas of this service worldwide. Berlin shows the highest memory usage and the greatest numbers of replica pods. She drills down to the transactions of this service in Berlin. She shares a link to this dashboard with the application developer who leads the service. The developer reads the context of the transactions. He sees a custom label for a feature flag that was rolled out only to Berlin for an A/B test. He optimizes the service to perform lazily loading instead of eager loading of a data set that grows over time. The CI/CD pipeline deploys his updated service, memory usage returns to normal, and the operator marks the issue as resolved. There is no indication that this issue affected the business, but the forecast suggested that it would have if they hadn't detected the spike.
Case studies
There is no shortage of success stories to prove the value of Elastic Observability. One great example is Verizon Communications, an American telecommunications conglomerate and a constituent of the Dow Jones Industrial Average (DJIA). In its 2019 Annual Report to the SEC, Verizon listed "network quality, capacity, and coverage" and "quality of customer service" among the top competitive risks to its business. During that year, 69.3% of its $130.9 billion in total revenue came from its wireless segment doing business as Verizon Wireless. An infrastructure operations team at Verizon Wireless stated that by replacing their legacy monitoring solution with Elastic they "reduced MTTR from 20–30 minutes to 2–3 minutes" which "translates directly to providing outstanding service for their customers." Service reliability, incident response, and the Elastic Stack are foundational to the competitive positioning of this business and others who must deliver a reliable service.
What's next?
Here are the steps you can take to maximize reliability and inspire confidence in your software services: