How to instrument a polyglot microservices application with Elastic APM
One of the challenges introduced by microservices architectures is the ability to understand how the application performs and where most time is spent. The Elastic Stack and Elastic APM can provide observability for modern, microservice-based solutions as well as monolithic applications.
Application Performance Monitoring (APM) combines different technologies to provide a deep, transparent and holistic view of what each service component is doing, where, when, and for how long. APM shows how services interact, follows transactions as they transverse the entire system, and lets you see bottlenecks. These rich analytics enable us to spot, debug, and fix issues quicker, resulting in improved user experience and business efficiency.
As a bonus, APM data stored in Elasticsearch is just another index — the combination and correlation of application metrics with other operational data becomes easy and accessible.
Observability and APM tools can be DevOps culture catalysts for organizations of different shapes and sizes. They bring together development, operations, security, product, and other teams trying to understand and improve their applications — each from their own point of view.
In this blog post we use an example application to demonstrate how to instrument a microservices application using Elastic APM, with a focus on distributed tracing.
Here’s a high-level view of the application architecture:
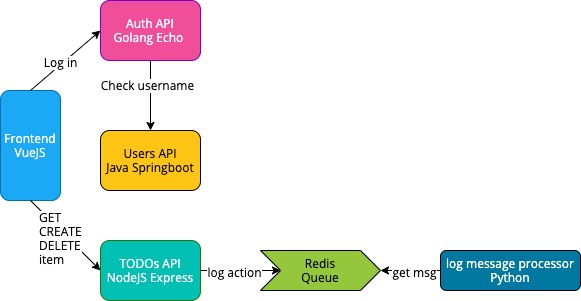
Although a contrived and basic example application, it goes beyond “hello world” examples built for “evaluating various instruments (monitoring, tracing, you name it)...” The original project was forked, and had a few modifications and updates applied. It was then instrumented using the Elastic APM.
Clearly, there’s more than one way to configure the agents and instrument an application with Elastic APM. What’s presented below is one option out of many — it does not claim to be the best or a unique way of setting things up, but rather demonstrates the flexibility a good observability solution provides.
Overview
The application is made up of five services:
- Frontend is a VueJS application and provides the UI.
- Auth API is written in Go and provides authorization functionality.
- TODOs API is written with NodeJS using the express framework. It provides CRUD functionality for the todo records. Also, it logs "create" and "delete" operations to a Redis queue, so they can be later processed by Log Message Processor.
- Users API is a Spring Boot project written in Java and provides user profiles.
- Log Message Processor is a queue processor written in Python. It reads messages from Redis queue and prints them to stdout.
In total, the app comprises six docker containers:
docker ps
CONTAINER ID        IMAGE                   COMMAND                  CREATED             STATUS              PORTS                    NAMES
6696f65b1759        frontend                "docker-entrypoint.s..."   6 hours ago         Up 58 seconds       0.0.0.0:8080->8080/tcp   microservice-app-example_frontend_1
6cc8a27f10f5        todos-api               "docker-entrypoint.s..."   6 hours ago         Up 58 seconds       8082/tcp                 microservice-app-example_todos-api_1
3e471f2163ca        log-message-processor   "python3 -u main.py"       6 hours ago         Up 58 seconds                                microservice-app-example_log-message-processor_1
bc1f09716288        auth-api                "/bin/sh -c /go/src/..."   6 hours ago         Up 58 seconds       8081/tcp                 microservice-app-example_auth-api_1
7144abac0d7c        users-api               "java -jar ./target/..."   6 hours ago         Up 59 seconds       8083/tcp                 microservice-app-example_users-api_1
84416563c37f        redis                   "docker-entrypoint.s..."   6 hours ago         Up 59 seconds       6379/tcp                 microservice-app-example_redis-queue_1
How to set up and run the lab
Prerequisites
The demo uses the Elastic Stack with APM on ESS. If you don’t have an Elasticsearch Service account you can set up a free trial. It comes with an APM server included as default.
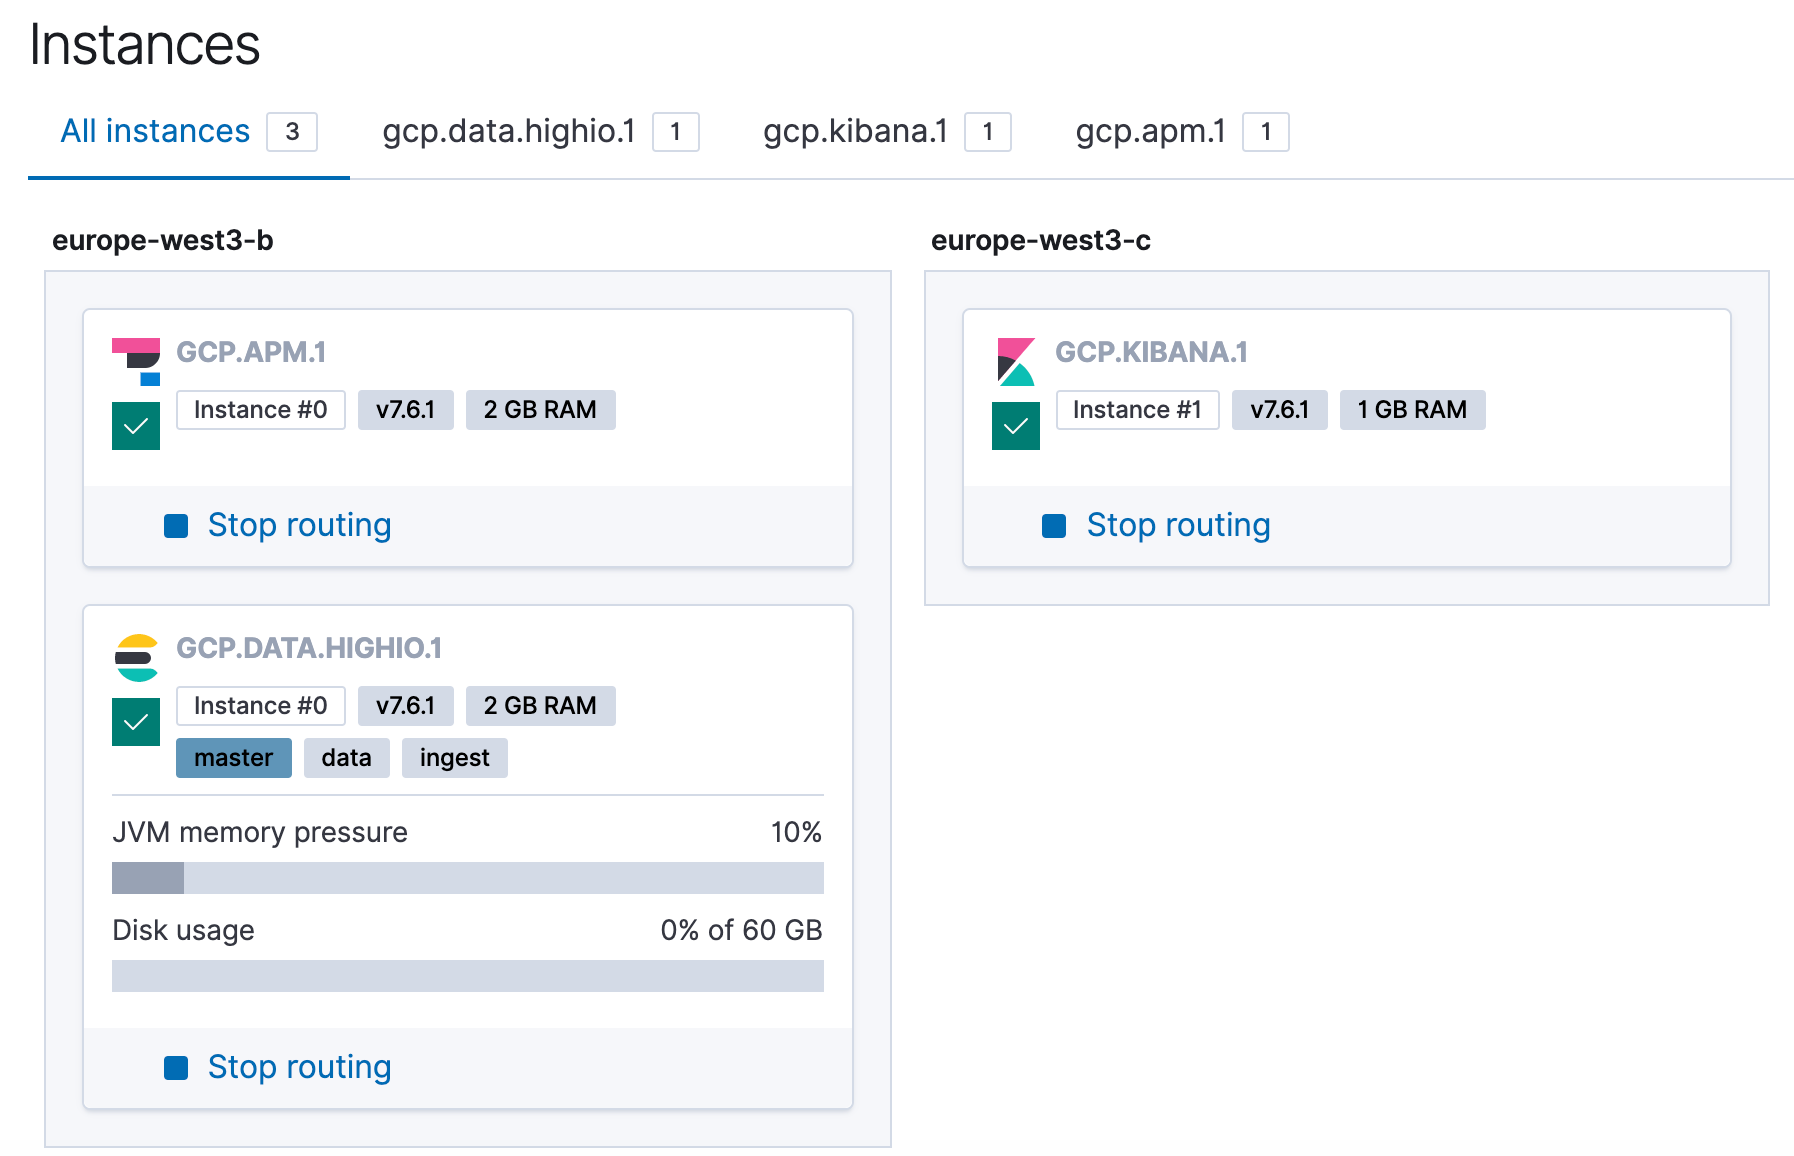
This demo was run and tested on both 7.5.0 and 7.6.1. Here’s a view of the instances of the simple test cluster that was used.
The latest version of APM agents installed are being installed at build time.
The project is built and run using docker-compose, so you’d need that installed on your local machine.
Configuration
To get the example application running on our local machine and configures to send APM data to the Elasticsearch Service cluster, we need to:
Clone the project:
git clone https://github.com/nephel/microservice-app-example.git
Create a file called .env at the root directory of the project with the contents:
cd microservice-app-example
vi .env
Add the token and server URL values for the APM server, that correspond to our environment:
TOKEN=XXXX
SERVER=XXXX
The values can be obtained from this page on the Admin console:
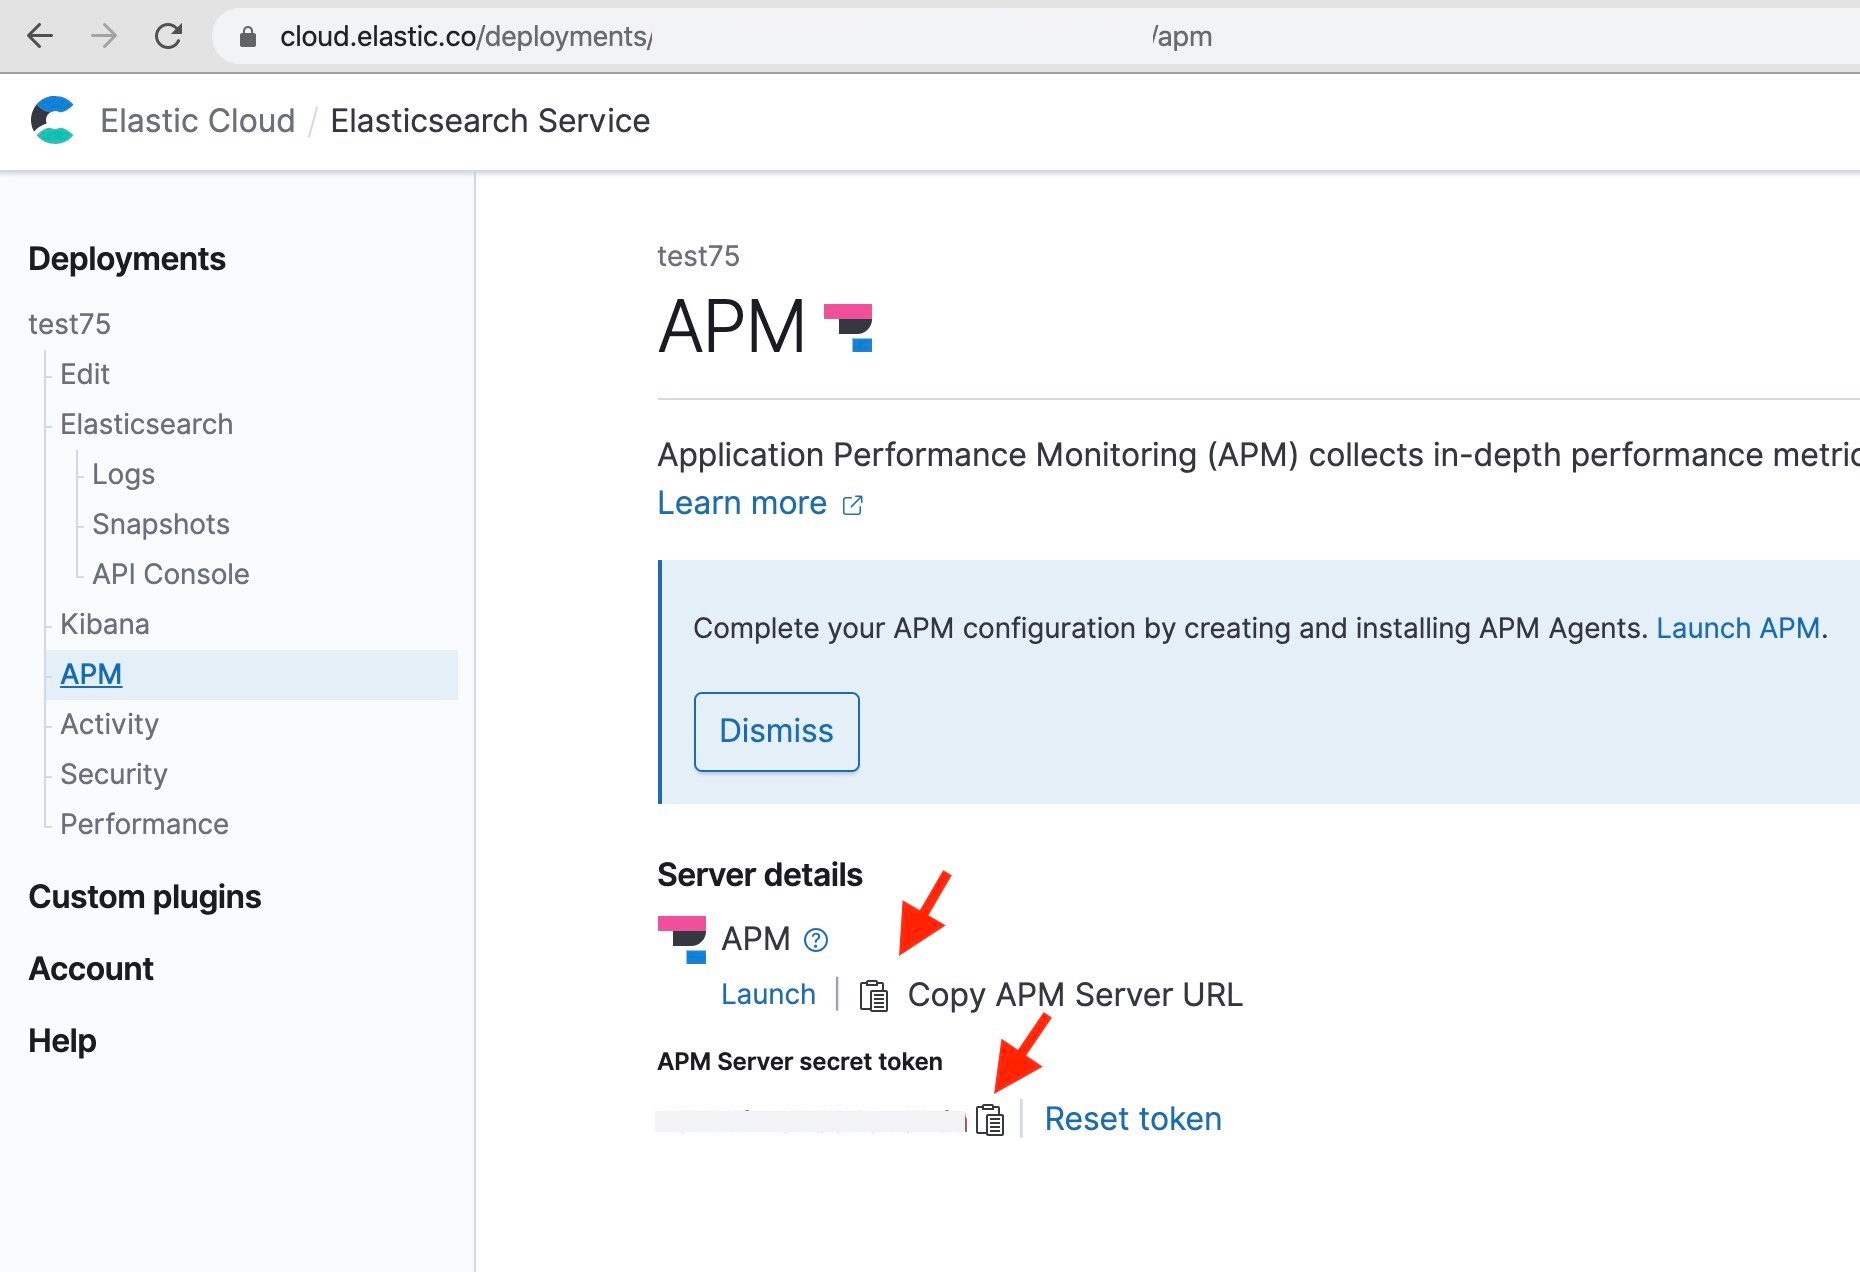
The values are passed as environment variables to each docker container from the docker-compose.yaml file, e.g.:
ELASTIC_APM_SECRET_TOKEN: "${TOKEN}"
ELASTIC_APM_SERVER_URL: "${SERVER}"
Running the project
To start the cloned project, run docker-compose up --build in the project’s root directory. This will create all the containers and their dependencies, and start sending application trace data to the APM server.
The first time the application with all its microservices and their dependencies is built with docker-compose, it will take a moment.
The configuration for APM and the microservices, has been left in verbose debug mode. This is intentional, as it was helpful when setting up and testing. If you find it too verbose, it can be changed in the docker-compose.yaml file.
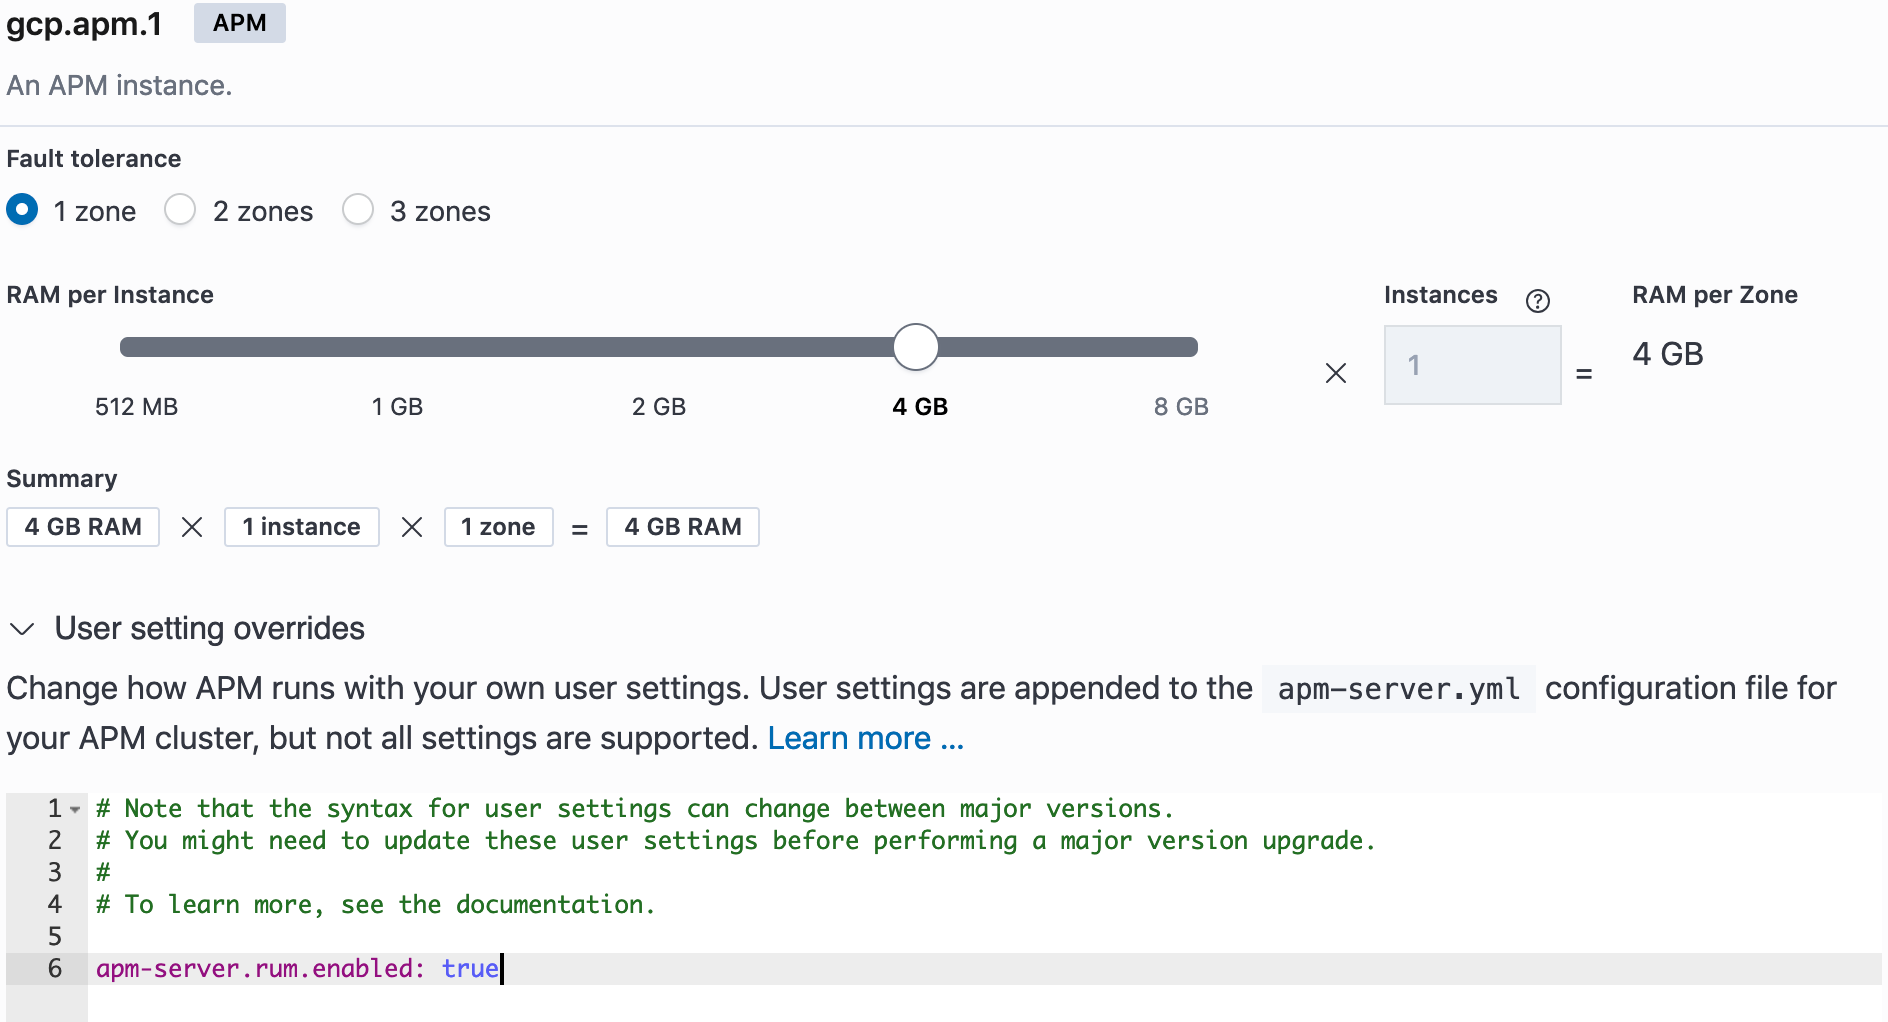
On the APM server config side we need to enable RUM with
apm-server.rum.enabled: true
in the User setting overrides:
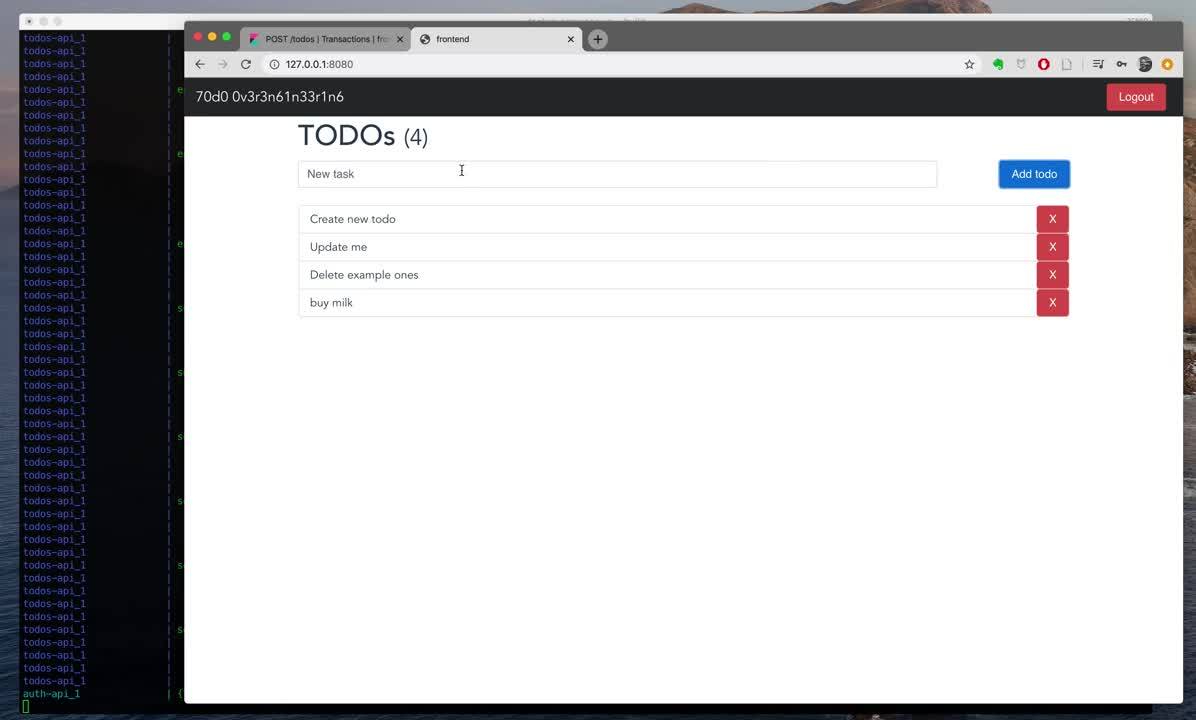
To generate some APM data we need to access the application and generate some traffic and requests. To do that, browse to http://127.0.0.1:8080, log in, add some items to the to do list of each user and delete some items, then log out and re-log in with a different user and repeat.
Note that the username/passwords are:
- admin/admin
- johnd/foo
- janed/ddd
Here is a short video showing how to bring up the app with docker-compose and the interaction with the app and Kibana APM UI:
The microservices and their instrumentation
Here is a view of the five services as they appear in the APM UI:
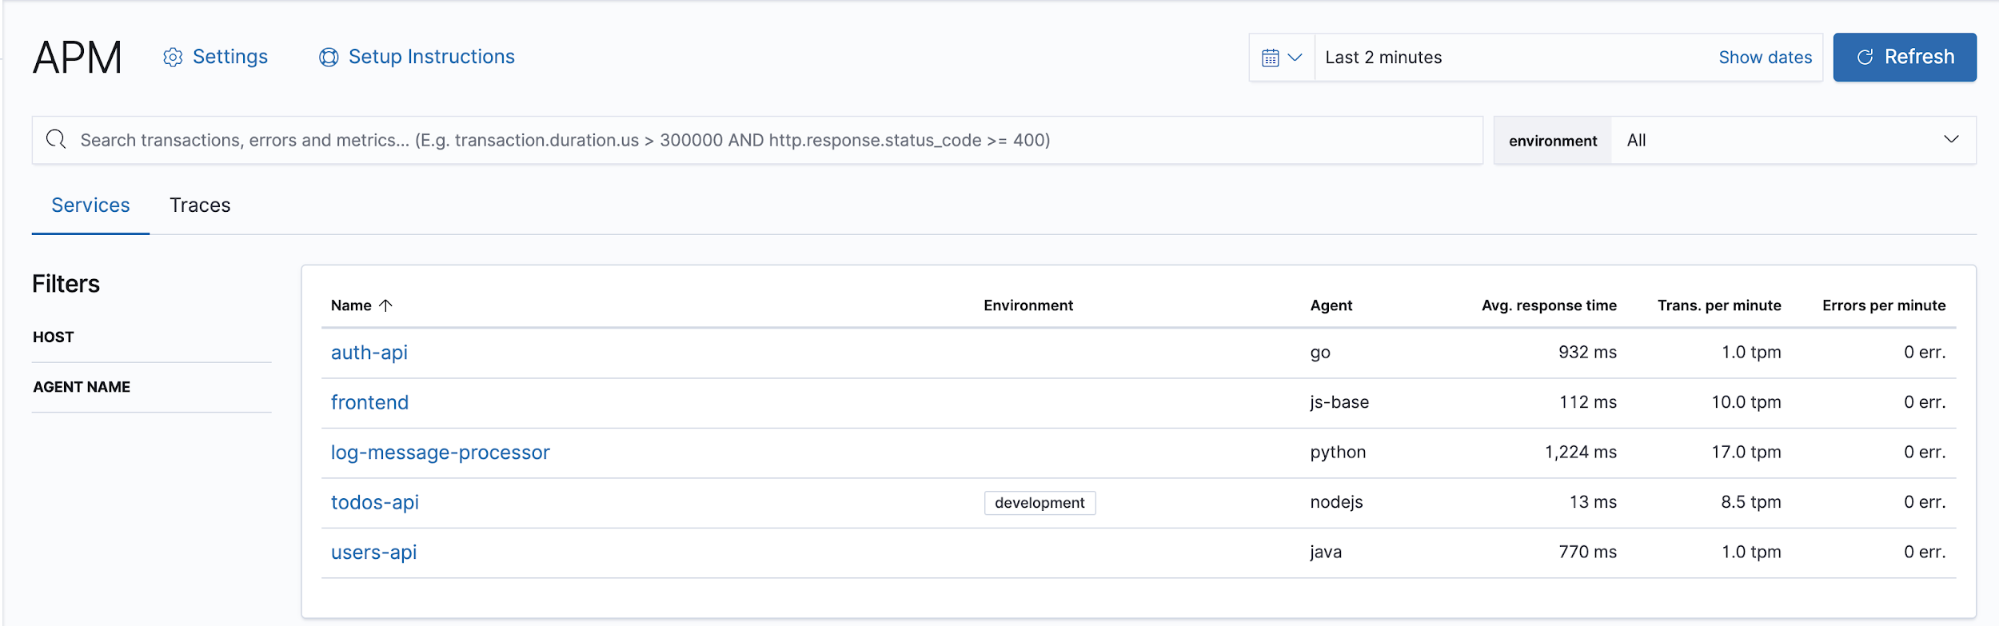
Each service shows up in the list, with high-level transaction, environment, and language information. Now let’s take a look how each microservice was instrumented, and what we see at the Kibana APM UI for each.
Frontend Vue JS
The technology used for the frontend is https://vuejs.org/ which is supported by the Elastic Real User Monitoring (RUM) agent.
The @elastic/apm-rum-vue package is installed via npm by adding to the frontend/Dockerfile:
COPY package.json ./
RUN npm install
RUN npm install --save @elastic/apm-rum-vue
COPY . .
CMD ["sh", "-c", "npm start" ]
The package is imported and configured in the frontend/src/router/index.js, like so:
...
import { ApmVuePlugin } from '@elastic/apm-rum-vue'
Vue.use(Router)
const router = new Router({
  mode: 'history',
  routes: [
    {
      path: '/login',
      name: 'login',
      component: require('@/components/Login.vue')
    },
    {
      path: '/',
      alias: '/todos',
      name: 'todos',
      component: require('@/components/Todos.vue'),
      beforeEnter: requireLoggedIn
    }
  ]
})
const ELASTIC_APM_SERVER_URL = process.env.ELASTIC_APM_SERVER_URL
Vue.use(ApmVuePlugin, {
  router,
  config: {
    serviceName: 'frontend',
    serverUrl: ELASTIC_APM_SERVER_URL,
    serviceVersion: '',
    logLevel: 'debug'
  }
})
...
...
export default router
In addition to the auto instrumented spans, additional component specific custom spans are also added for the various components, e.g. in the frontend/src/components/Login.vue, the following was added:
...
      span: null
    }
  },
  created () {
    this.span = this.$apm.startSpan('component-login', 'custom')
  },
  mounted () {
    this.span && this.span.end()
  }
...
Both page load and route-change events are captured as transactions with the path of the route as its name.
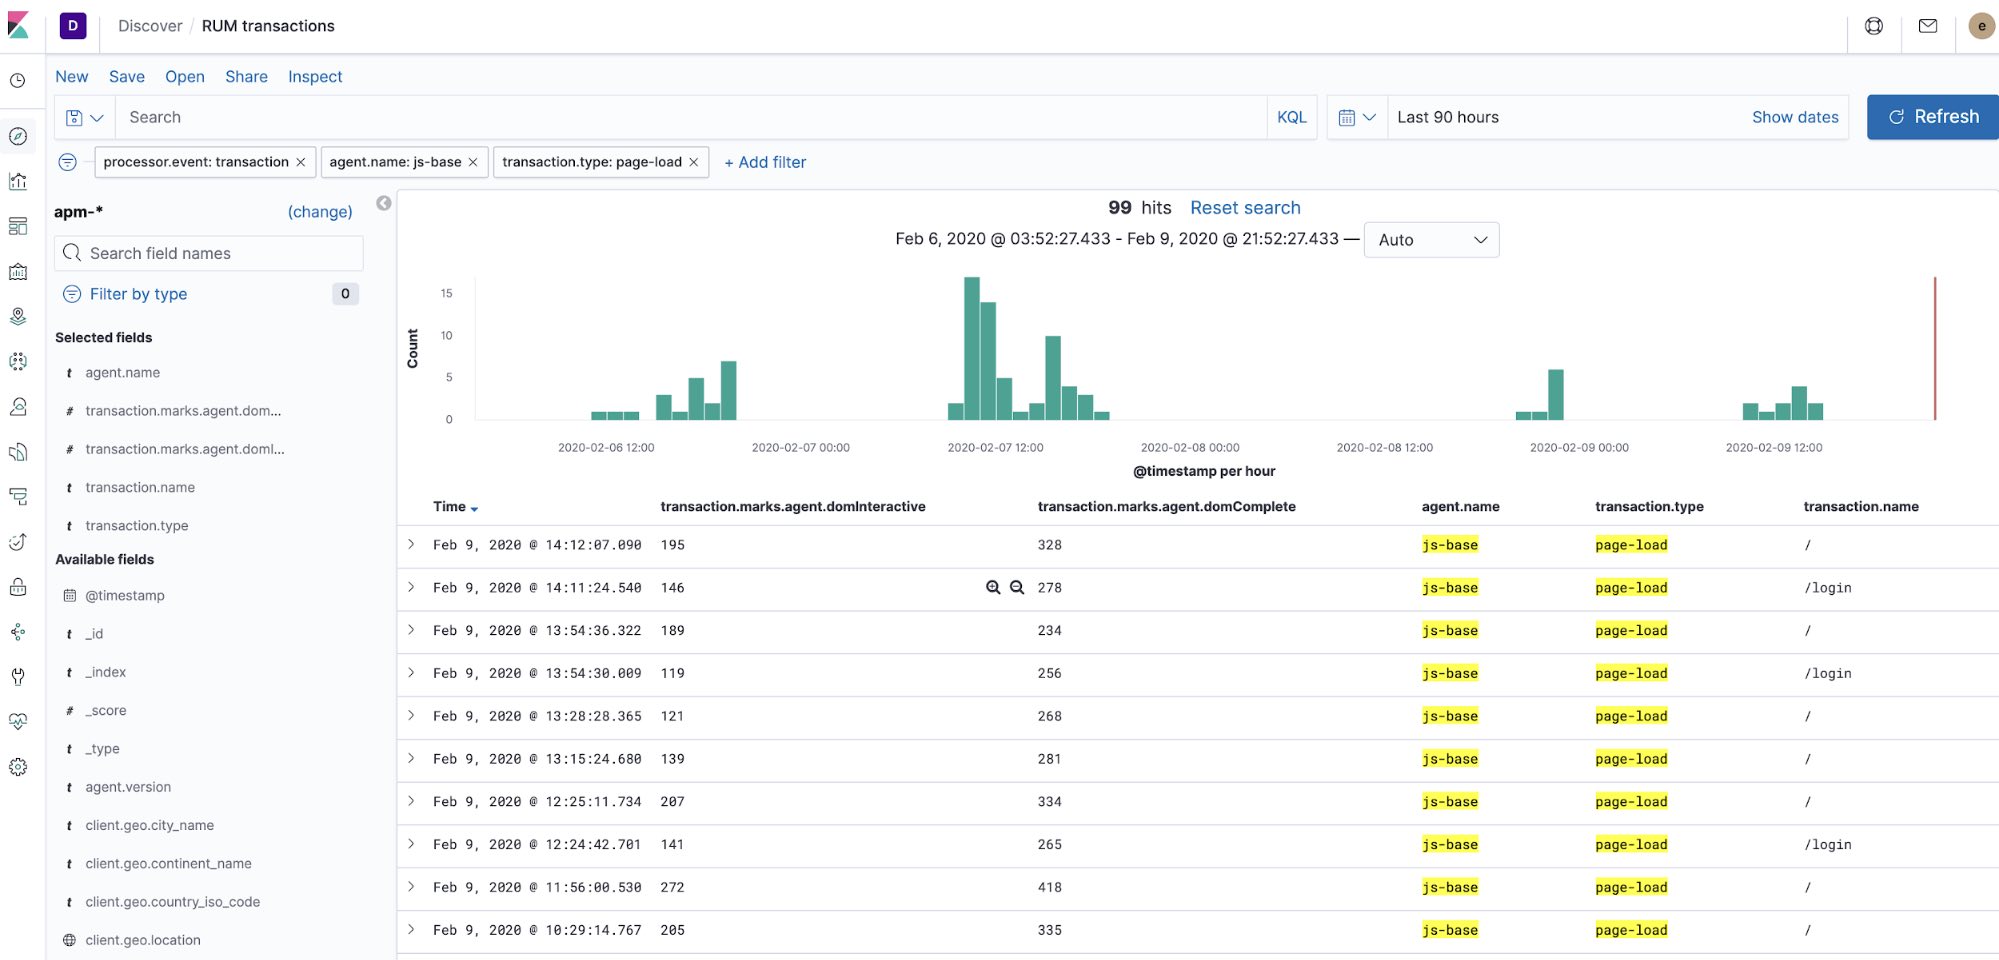
This is what we see when inspecting the APM related indices and docs, filtering for page load transactions:
A page load event and transaction can be created at any time by reloading the page without cache (e.g. Command-Shift-R on Mac).
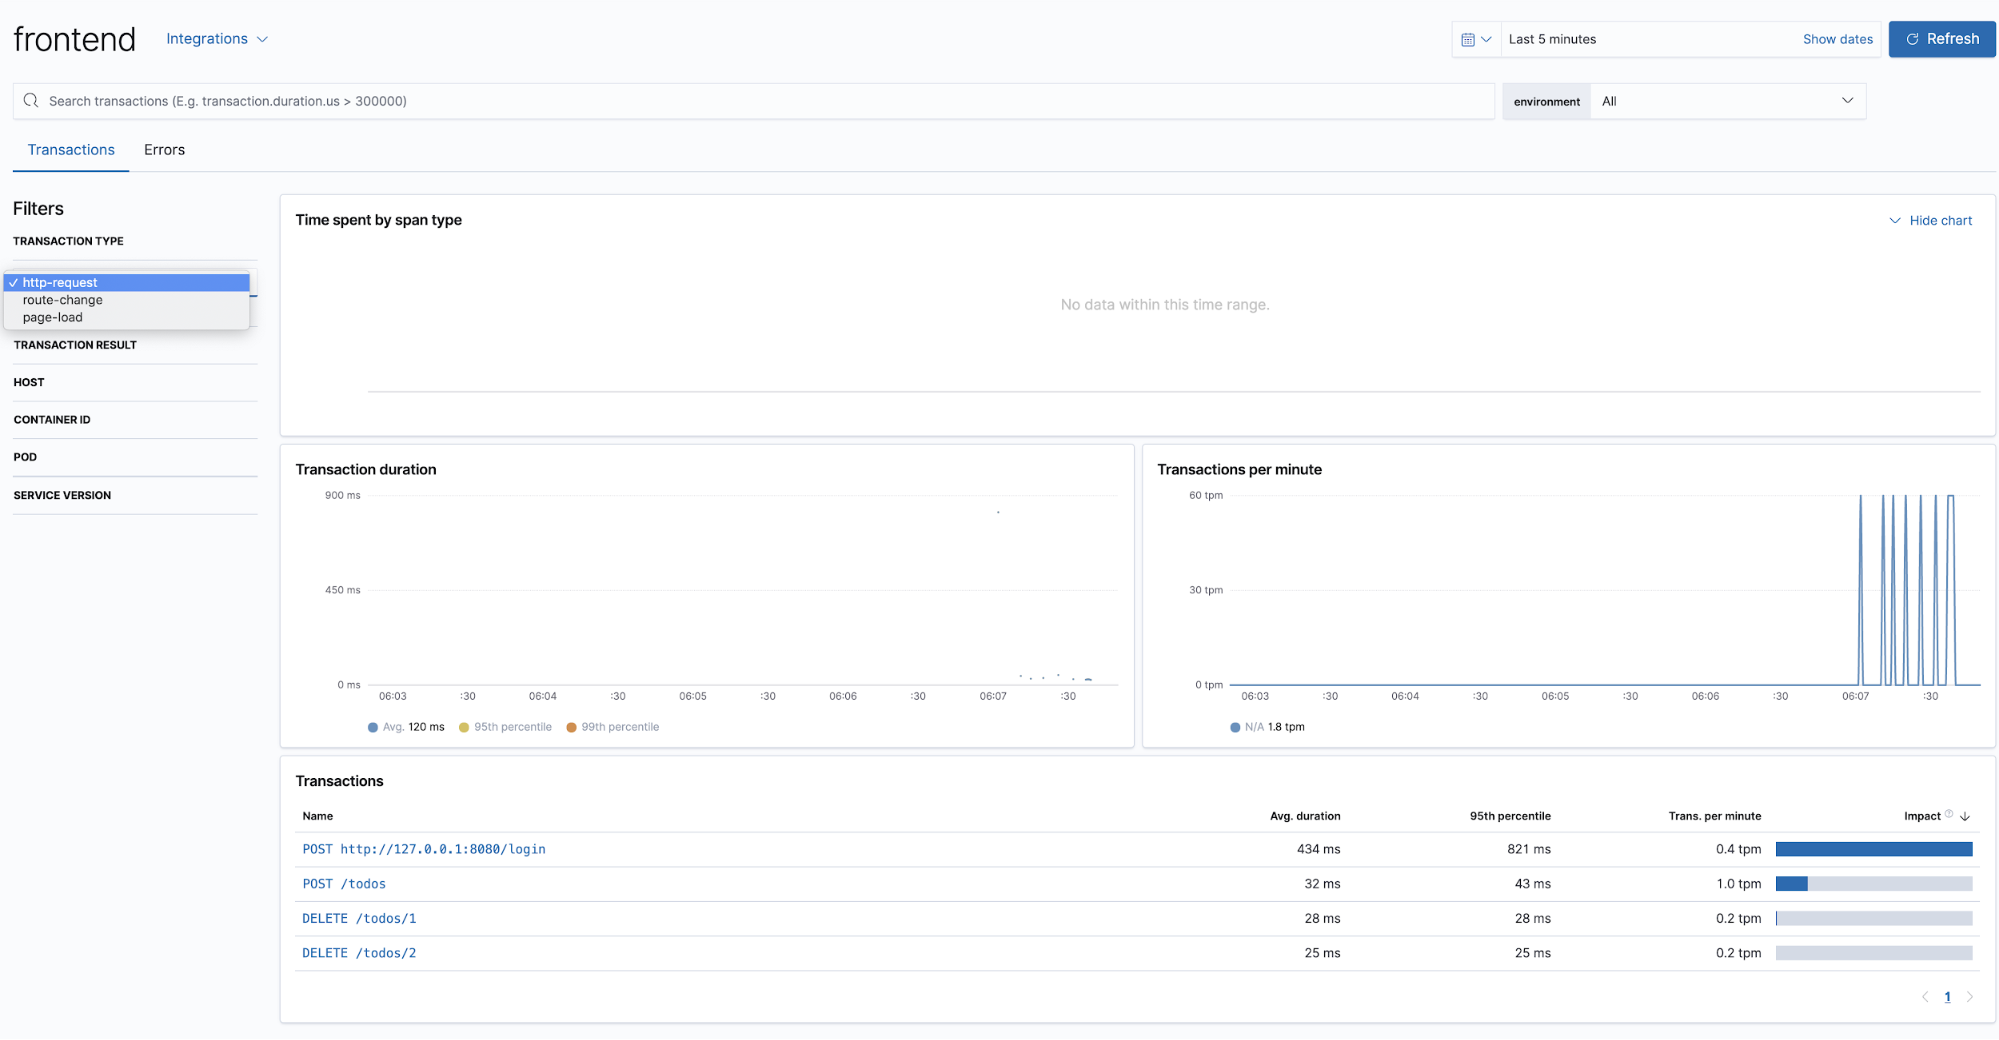
This is a view of the transactions we see for the frontend service — note the drop-down allowing us to filter on transaction type:
Auth API Golang Echo
This microservice is implemented in Golang using the echo framework version 3, which is supported by the Elastic APM Go agent.
The main changes and additions are done in the auth-api/main.go file, where the Elastic APM agent along with the two modules apmecho and apmhttp are imported:
...
        "go.elastic.co/apm"
        "go.elastic.co/apm/module/apmecho"
        "go.elastic.co/apm/module/apmhttp"
        "github.com/labstack/echo/middleware"
...
The instrumentation for the echo middleware is done in line 48, below:
...
 28 func main() {
 29         hostport := ":" + os.Getenv("AUTH_API_PORT")
 30         userAPIAddress := os.Getenv("USERS_API_ADDRESS")
 31
 32         envJwtSecret := os.Getenv("JWT_SECRET")
 33         if len(envJwtSecret) != 0 {
 34                 jwtSecret = envJwtSecret
 35         }
 36
 37         userService := UserService{
 38                 Client:         apmhttp.WrapClient(http.DefaultClient),
 39                 UserAPIAddress: userAPIAddress,
 40                 AllowedUserHashes: map[string]interface{}{
 41                         "admin_admin": nil,
 42                         "johnd_foo":   nil,
 43                         "janed_ddd":   nil,
 44                 },
 45         }
 46
 47         e := echo.New()
 48         e.Use(apmecho.Middleware())
 49
 50         e.Use(middleware.Logger())
 51         e.Use(middleware.Recover())
 52         e.Use(middleware.CORS())
 53
 54         // Route => handler
 55         e.GET("/version", func(c echo.Context) error {
 56                 return c.String(http.StatusOK, "Auth API, written in Go\n")
 57         })
 58
 59         e.POST("/login", getLoginHandler(userService)
...
This microservice makes outgoing HTTP requests to the users-api microservice, implemented in the auth-api/user.go file.
The wrapping of the HTTP client is done on line 38, above, tracing the outgoing request with distributed tracing as the request moves from one microservice to another.
More info can be found in this blog post and related documentation:
Tracing outgoing HTTP requests
To trace an outgoing HTTP request, you must instrument the HTTP client, and ensure the enclosing request context is propagated to the outgoing request. The instrumented client will use this to create a span, and also to inject headers into the outgoing HTTP request. Let’s see how that looks in practice
...
If this outgoing request is handled by another application instrumented with Elastic APM, you will end up with a “distributed trace” — a trace (collection of related transactions and spans) that crosses services. The instrumented client will inject a header identifying the span for the outgoing HTTP request, and the receiving service will extract that header and use it to correlate the client span with the transaction it records.
Additionally, spans for the echo transaction were added covering the login process:
...
func getLoginHandler(userService UserService) echo.HandlerFunc {
        f := func(c echo.Context) error {
                span, _ := apm.StartSpan(c.Request().Context(), "request-login", "app")
                requestData := LoginRequest{}
                decoder := json.NewDecoder(c.Request().Body)
                if err := decoder.Decode(&requestData); err != nil {
                        log.Printf("could not read credentials from POST body: %s", err.Error())
                        return ErrHttpGenericMessage
                }
                span.End()
                span, ctx := apm.StartSpan(c.Request().Context(), "login", "app")
                user, err := userService.Login(ctx, requestData.Username, requestData.Password)
                if err != nil {
                        if err != ErrWrongCredentials {
                                log.Printf("could not authorize user '%s': %s", requestData.Username, err.Error())
                                return ErrHttpGenericMessage
                        }
                        return ErrWrongCredentials
                }
                token := jwt.New(jwt.SigningMethodHS256)
                span.End()
                // Set claims
                span, _ = apm.StartSpan(c.Request().Context(), "generate-send-token", "custom")
                claims := token.Claims.(jwt.MapClaims)
                claims["username"] = user.Username
                claims["firstname"] = user.FirstName
                claims["lastname"] = user.LastName
                claims["role"] = user.Role
                claims["exp"] = time.Now().Add(time.Hour * 72).Unix()
                // Generate encoded token and send it as response.
                t, err := token.SignedString([]byte(jwtSecret))
                if err != nil {
                        log.Printf("could not generate a JWT token: %s", err.Error())
                        return ErrHttpGenericMessage
                }
                span.End()
Users-api SpringBoot
The service uses Spring Boot, which is supported by the Java agent. Spring Boot is very straightforward to instrument out of the box.
The agent is installed using the programmatic API setup for self attach, in users-api/src/main/java/com/elgris/usersapi/UsersApiApplication.java:
...
import co.elastic.apm.attach.ElasticApmAttacher;
@SpringBootApplication
public class UsersApiApplication {
        public static void main(String[] args) {
                ElasticApmAttacher.attach();
                SpringApplication.run(UsersApiApplication.class, args);
        }
}
...
In users-api pom.xml, the following was added:
                <dependency>
                        <groupId>co.elastic.apm</groupId>
                        <artifactId>apm-agent-attach</artifactId>
                        <version>[1.14.0,)</version>
               </dependency>
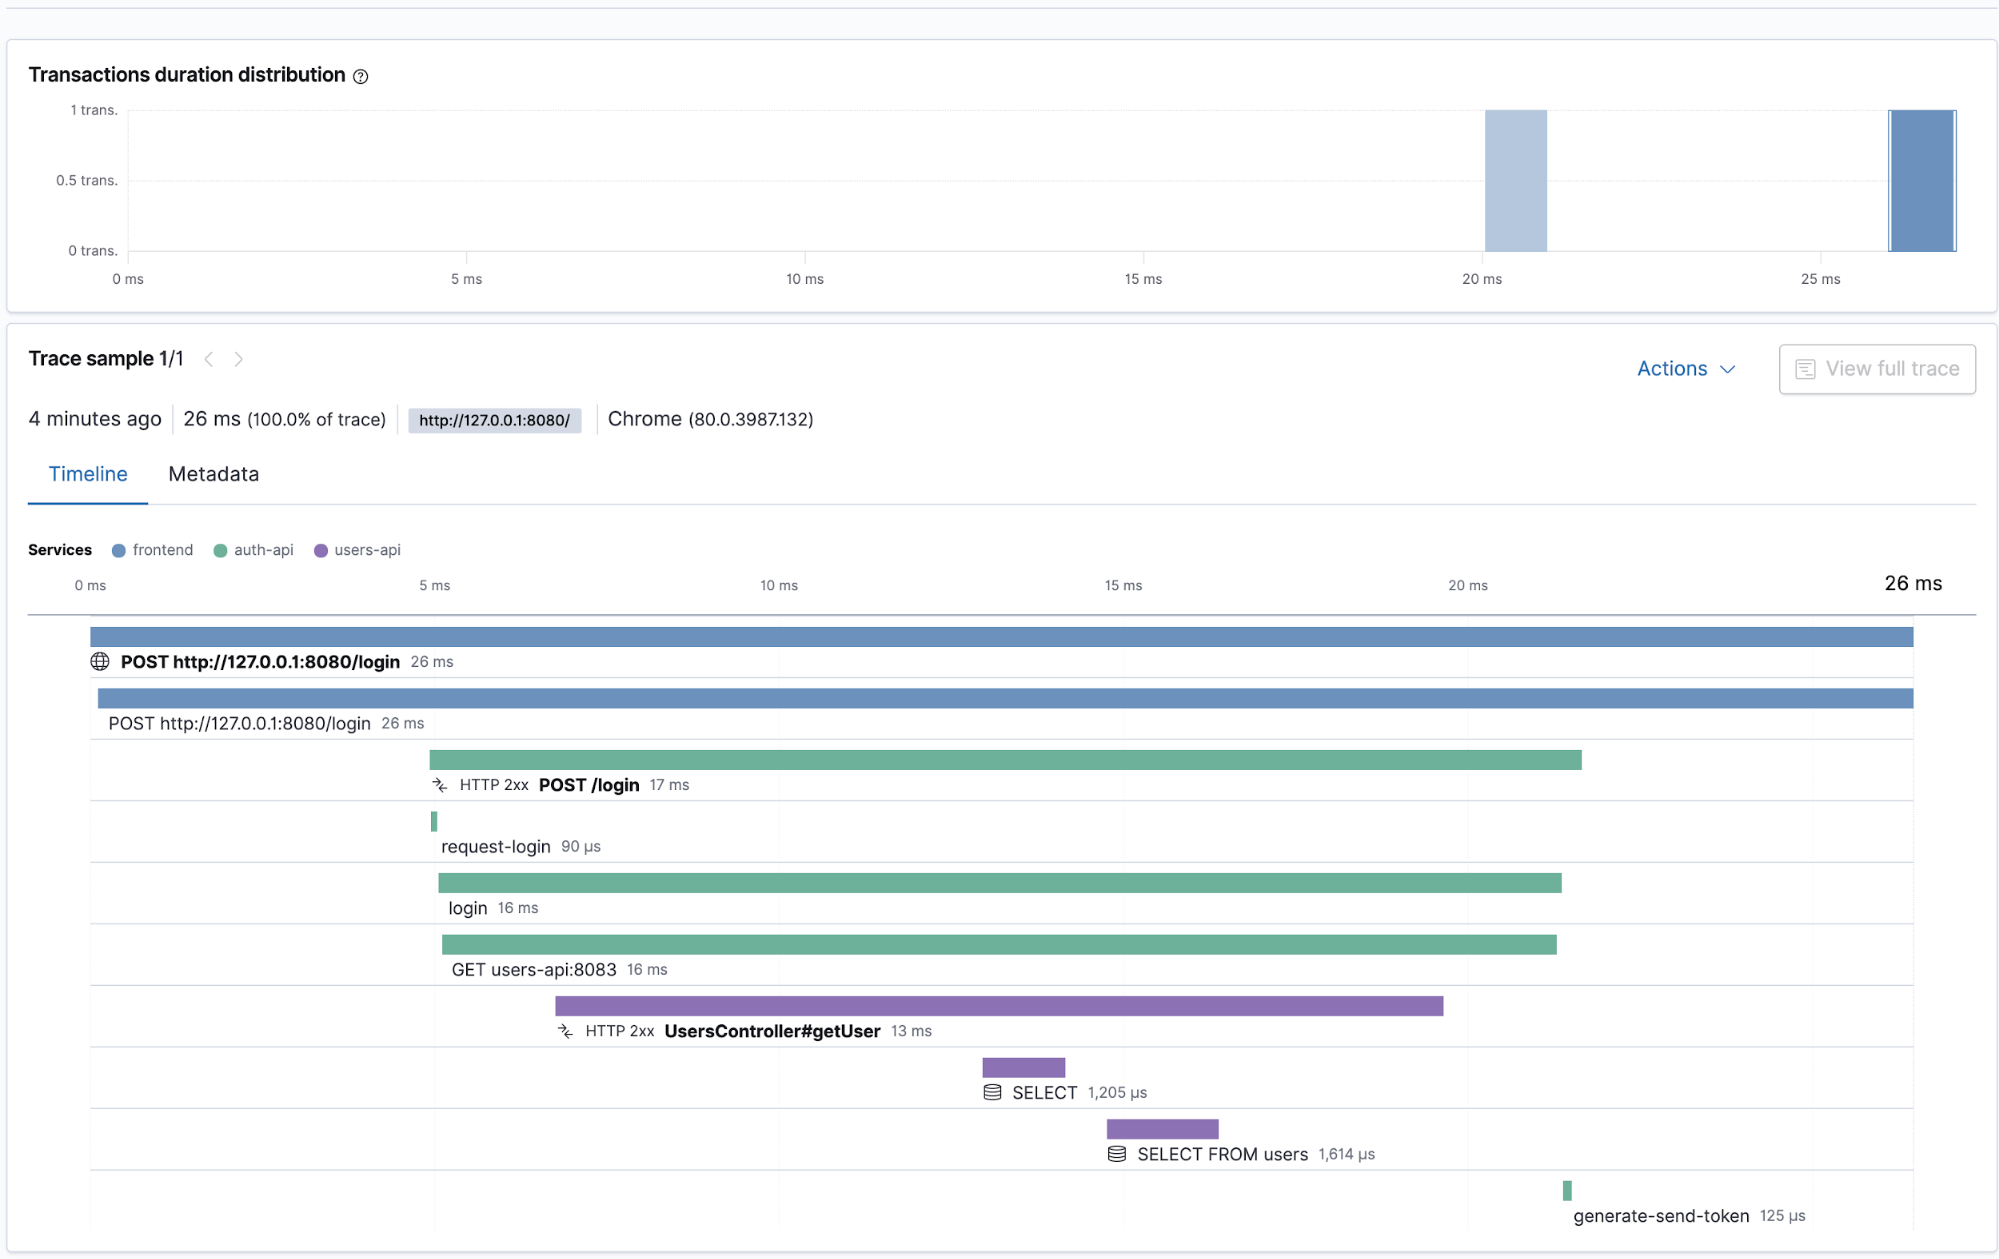
Below is an example of distributed tracing with the transactions and spans for the login process. We see the trace that comprises the transactions and spans as the flow though the microservices. From the frontend form, to the POST request to the auth-API for authentication, which in turn makes a GET request out to the users-API for the user profile retrieval:
Todos-api NodeJS Express
The “todo” service uses the Express framework, which is supported by the Elastic APM Node.js agent.
The agent is installed by adding this in the Dockerfile:
RUN npm install elastic-apm-node --save
To initialize the agent, the following is added in the todos-api/server.js:
...
const apm = require('elastic-apm-node').start({
  // Override service name from package.json
  // Allowed characters: a-z, A-Z, 0-9, -, _, and space
  serviceName: 'todos-api',
  // Use if APM Server requires a token
  secretToken: process.env.ELASTIC_APM_SECRET_TOKEN,
  // Set custom APM Server URL (default: http://localhost:8200)
  serverUrl: process.env.ELASTIC_APM_SERVER_URL,
})
....
Custom spans are added in the todos-api/todoController.js for actions such as creating and deleting tasks in the todo app:
...
    create (req, res) {
        // TODO: must be transactional and protected for concurrent access, but
        // the purpose of the whole example app it's enough
        const span = apm.startSpan('creating-item')
        const data = this._getTodoData(req.user.username)
        const todo = {
            content: req.body.content,
            id: data.lastInsertedID
        }
        data.items[data.lastInsertedID] = todo
        data.lastInsertedID++
        this._setTodoData(req.user.username, data)
        if (span) span.end()
        this._logOperation(OPERATION_CREATE, req.user.username, todo.id)
        res.json(todo)
    }
    delete (req, res) {
        const data = this._getTodoData(req.user.username)
        const id = req.params.taskId
        const span = apm.startSpan('deleting-item')
        delete data.items[id]
        this._setTodoData(req.user.username, data)
        if (span) span.end()
        this._logOperation(OPERATION_DELETE, req.user.username, id)
        res.status(204)
        res.send()
    }
...
The logs are sent via the Redis queue to the Python microservice:
...
_logOperation(opName, username, todoId) {
 var span = apm.startSpan('logging-operation')
 this._redisClient.publish(
   this._logChannel,
   JSON.stringify({
     opName,
     username,
     todoId,
     spanTransaction: span.transaction
   }),
   function(err) {
     if (span) span.end()
     if (err) {
       apm.captureError(err)
     }
   }
 )
}
...
As can be seen above, the data sent to Redis includes the opName and username, along with the span.transaction information, which points to the parent transaction object.
Here’s a sample of the spanTransaction as captured in the verbose log output:
'spanTransaction':
{
   "id":"4eb8801911b87fba",
   "trace_id":"5d9c555f6ef61f9d379e4a67270d2eb1",
   "parent_id":"a9f3ee75554369ab",
   "name":"GET unknown route (unnamed)",
   "type":"request",
   "subtype":"None",
   "action":"None",
   "duration":"None",
   "timestamp":1581287191572013,
   "result":"success",
   "sampled":True,
   "context":{
      "user":{
         "username":"johnd"
      },
      "tags":{
      },
      "custom":{
      },
      "request":{
         "http_version":"1.1",
         "method":"GET",
         "url":{
            "raw":"/todos",
            "protocol":"http:",
            "hostname":"127.0.0.1",
            "port":"8080",
            "pathname":"/todos",
            "full":"http://127.0.0.1:8080/todos"
         },
         "socket":{
            "remote_address":"::ffff:172.20.0.7",
            "encrypted":False
         },
         "headers":{
            "accept-language":"en-GB,en-US;q=0.9,en;q=0.8",
            "accept-encoding":"gzip, deflate, br",
            "referer":"http://127.0.0.1:8080/",
            "sec-fetch-mode":"cors",
            "sec-fetch-site":"same-origin",
            "elastic-apm-traceparent":"00-5d9c555f6ef61f9d379e4a67270d2eb1-a9f3ee75554369ab-01",
            "user-agent":"Mozilla/5.0 (Macintosh; Intel Mac OS X 10_15_3) AppleWebKit/537.36 (KHTML, like Gecko) Chrome/79.0.3945.130 Safari/537.36",
            "authorization":"Bearer eyJhbGciOiJIUzI1NiIsInR5cCI6IkpXVCJ9.eyJleHAiOjE1ODE1NDYzOTEsImZpcnN0bmFtZSI6IkpvaG4iLCJsYXN0bmFtZSI6IkRvZSIsInJvbGUiOiJVU0VSIiwidXNlcm5hbWUiOiJqb2huZCJ9.Kv2e7E70ysbVvP-hKlG-RJyfKSibmiy8kCO-xqm3P6g",
            "x-requested-with":"XMLHttpRequest",
            "accept":"application/json, text/plain, */*",
            "connection":"close",
            "host":"127.0.0.1:8080"
         }
      },
      "response":{
         "status_code":200,
         "headers":{
         }
      }
   },
   "sync":False,
   "span_count":{
      "started":5
   }
}
Among other things, it includes the 'elastic-apm-traceparent':'00-5d9c555f6ef61f9d379e4a67270d2eb1-a9f3ee75554369ab-01'.
This information will be used by the Python microservice to link this transaction to the parent trace. This will ensure that we have distributed tracing for the todo app requests as they traverse the frontend, todos-api, and are then logged via the Python processor.
Log-message-processor Python
The log-message-processor service is not using any framework e.g. django or flask, but rather is written in Python3 as a simple consumer that listens for new messages in Redis queue.
In the log-message-processor/requirements.txt this line is added:
elastic-apm
In the log-message-processor/main.py
The agent is imported along with TraceParent from the elasticapm.utils.disttracing
...
import elasticapm
from elasticapm.utils.disttracing import TraceParent
from elasticapm import Client
client = Client({'SERVICE_NAME': 'python'})
...
The decorator option was used in order to capture the spans of the log_message function:
...
@elasticapm.capture_span()
def log_message(message):
    time_delay = random.randrange(0, 2000)
    time.sleep(time_delay / 1000)
    print('message received after waiting for {}ms: {}'.format(time_delay, message))
...
The transactions start and end around the logging. The parent id of the trace is read by the elastic-apm-transparent header (sent via the Redis queue) using the TraceParent API:
...
if __name__ == '__main__':
    redis_host = os.environ['REDIS_HOST']
    redis_port = int(os.environ['REDIS_PORT'])
    redis_channel = os.environ['REDIS_CHANNEL']
    pubsub = redis.Redis(host=redis_host, port=redis_port, db=0).pubsub()
    pubsub.subscribe([redis_channel])
    for item in pubsub.listen():
        try:
            message = json.loads(str(item['data'].decode("utf-8")))
        except Exception as e:
            log_message(e)
            continue
        spanTransaction = message['spanTransaction']
        trace_parent1 = spanTransaction['context']['request']['headers']['elastic-apm-traceparent']
        print('trace_parent_log: {}'.format(trace_parent1))
        trace_parent = TraceParent.from_string(trace_parent1)
        client.begin_transaction("logger-transaction", trace_parent=trace_parent)
        log_message(message)
        client.end_transaction('logger-transaction')
...
Please note that while the TraceParent functionality is about to be formally documented and it is mentioned in this Discuss topic, and tested here.
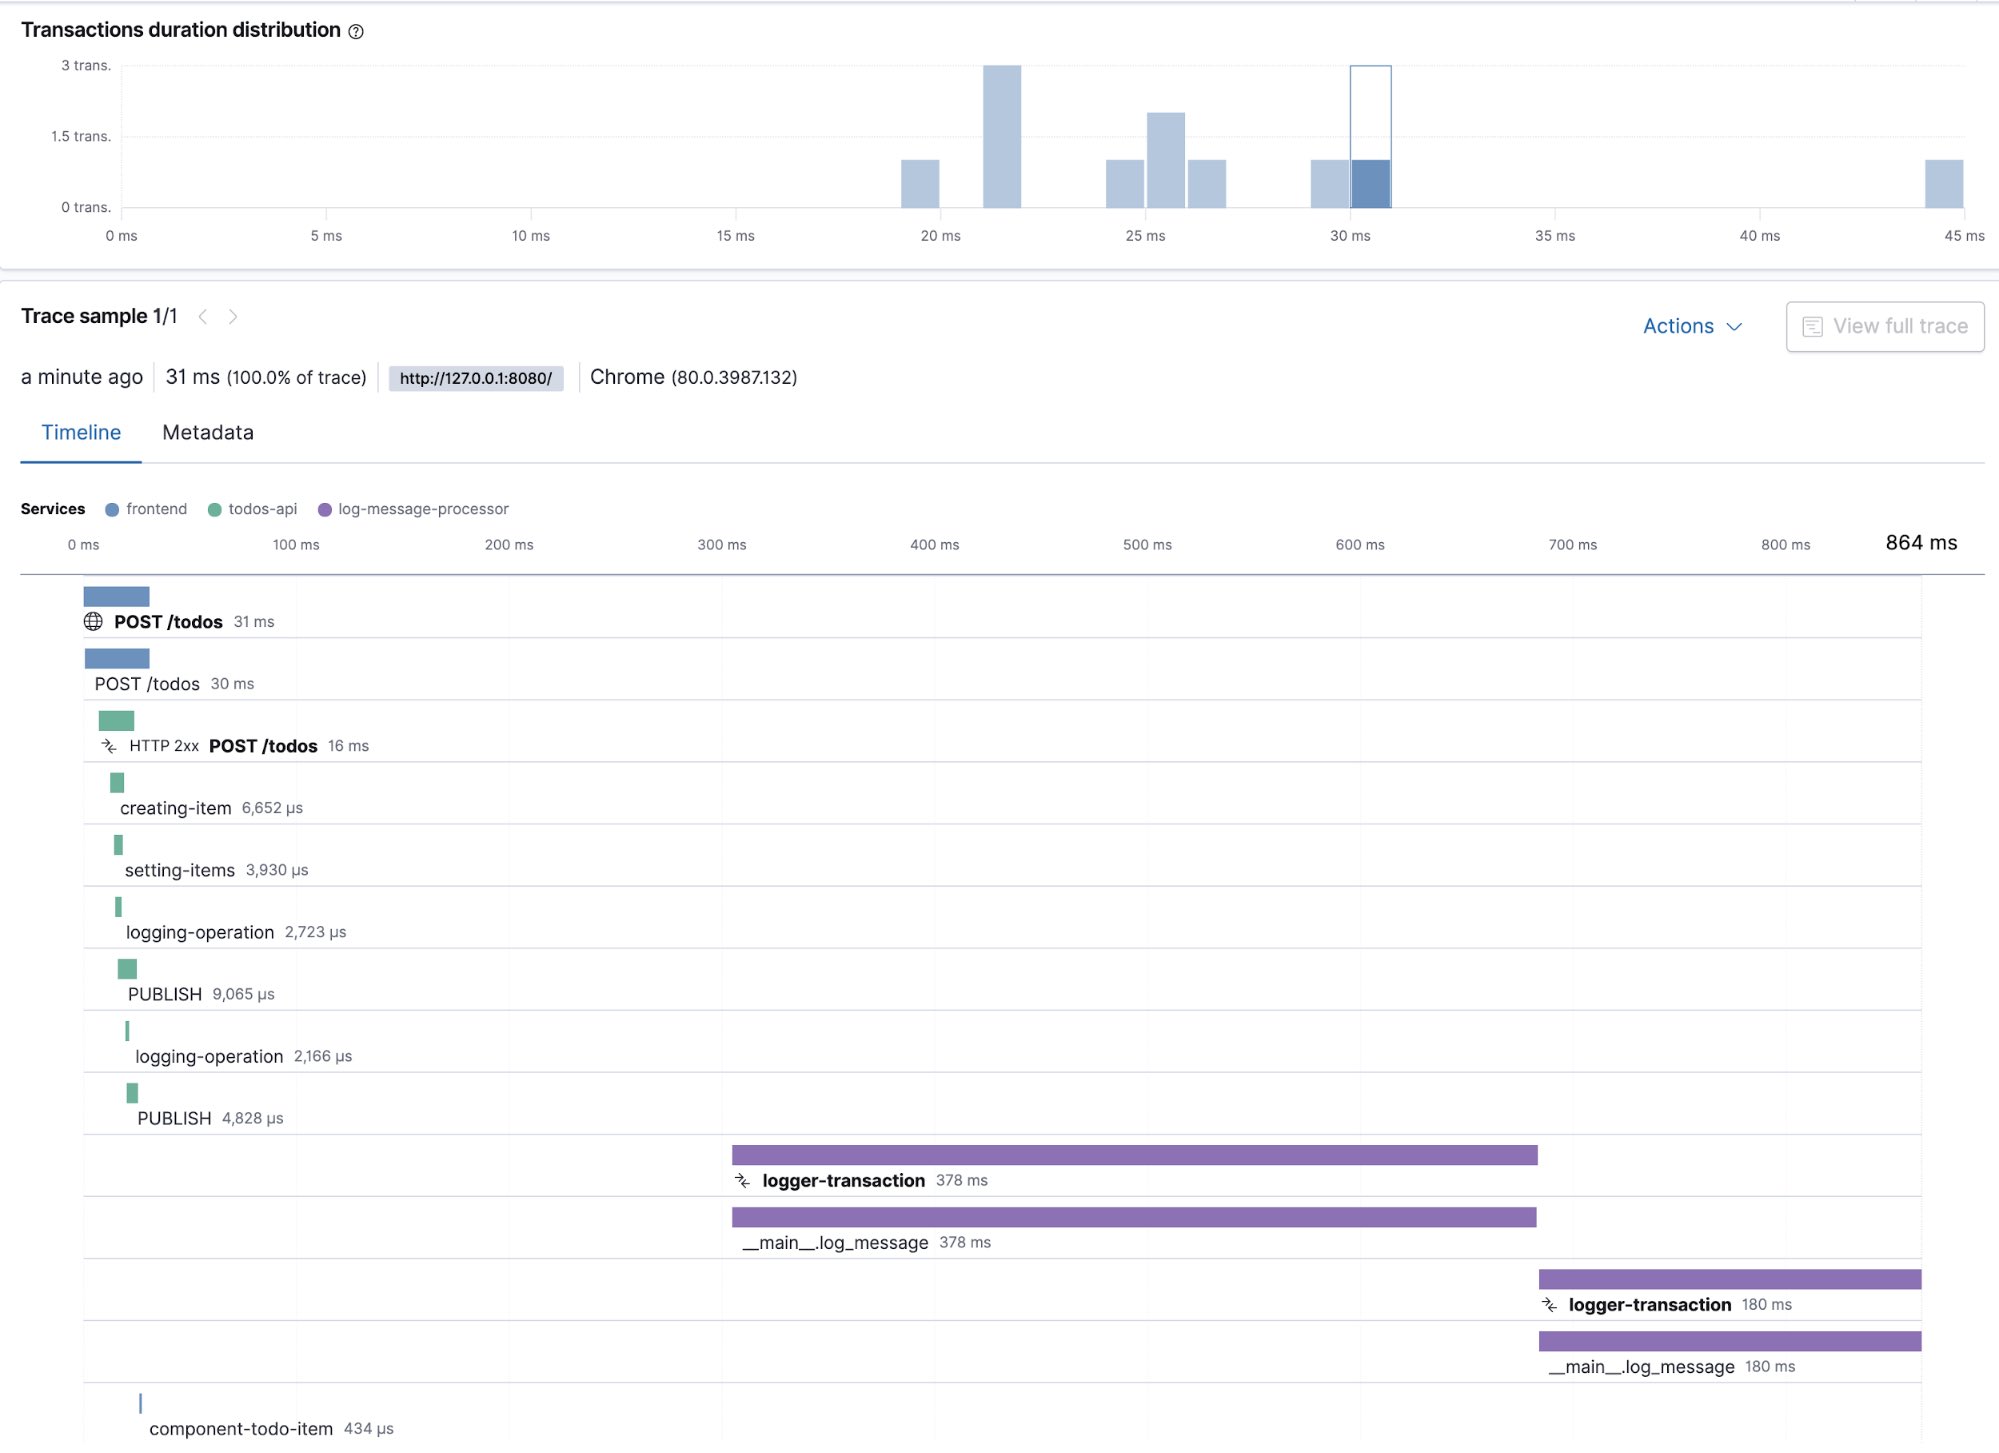
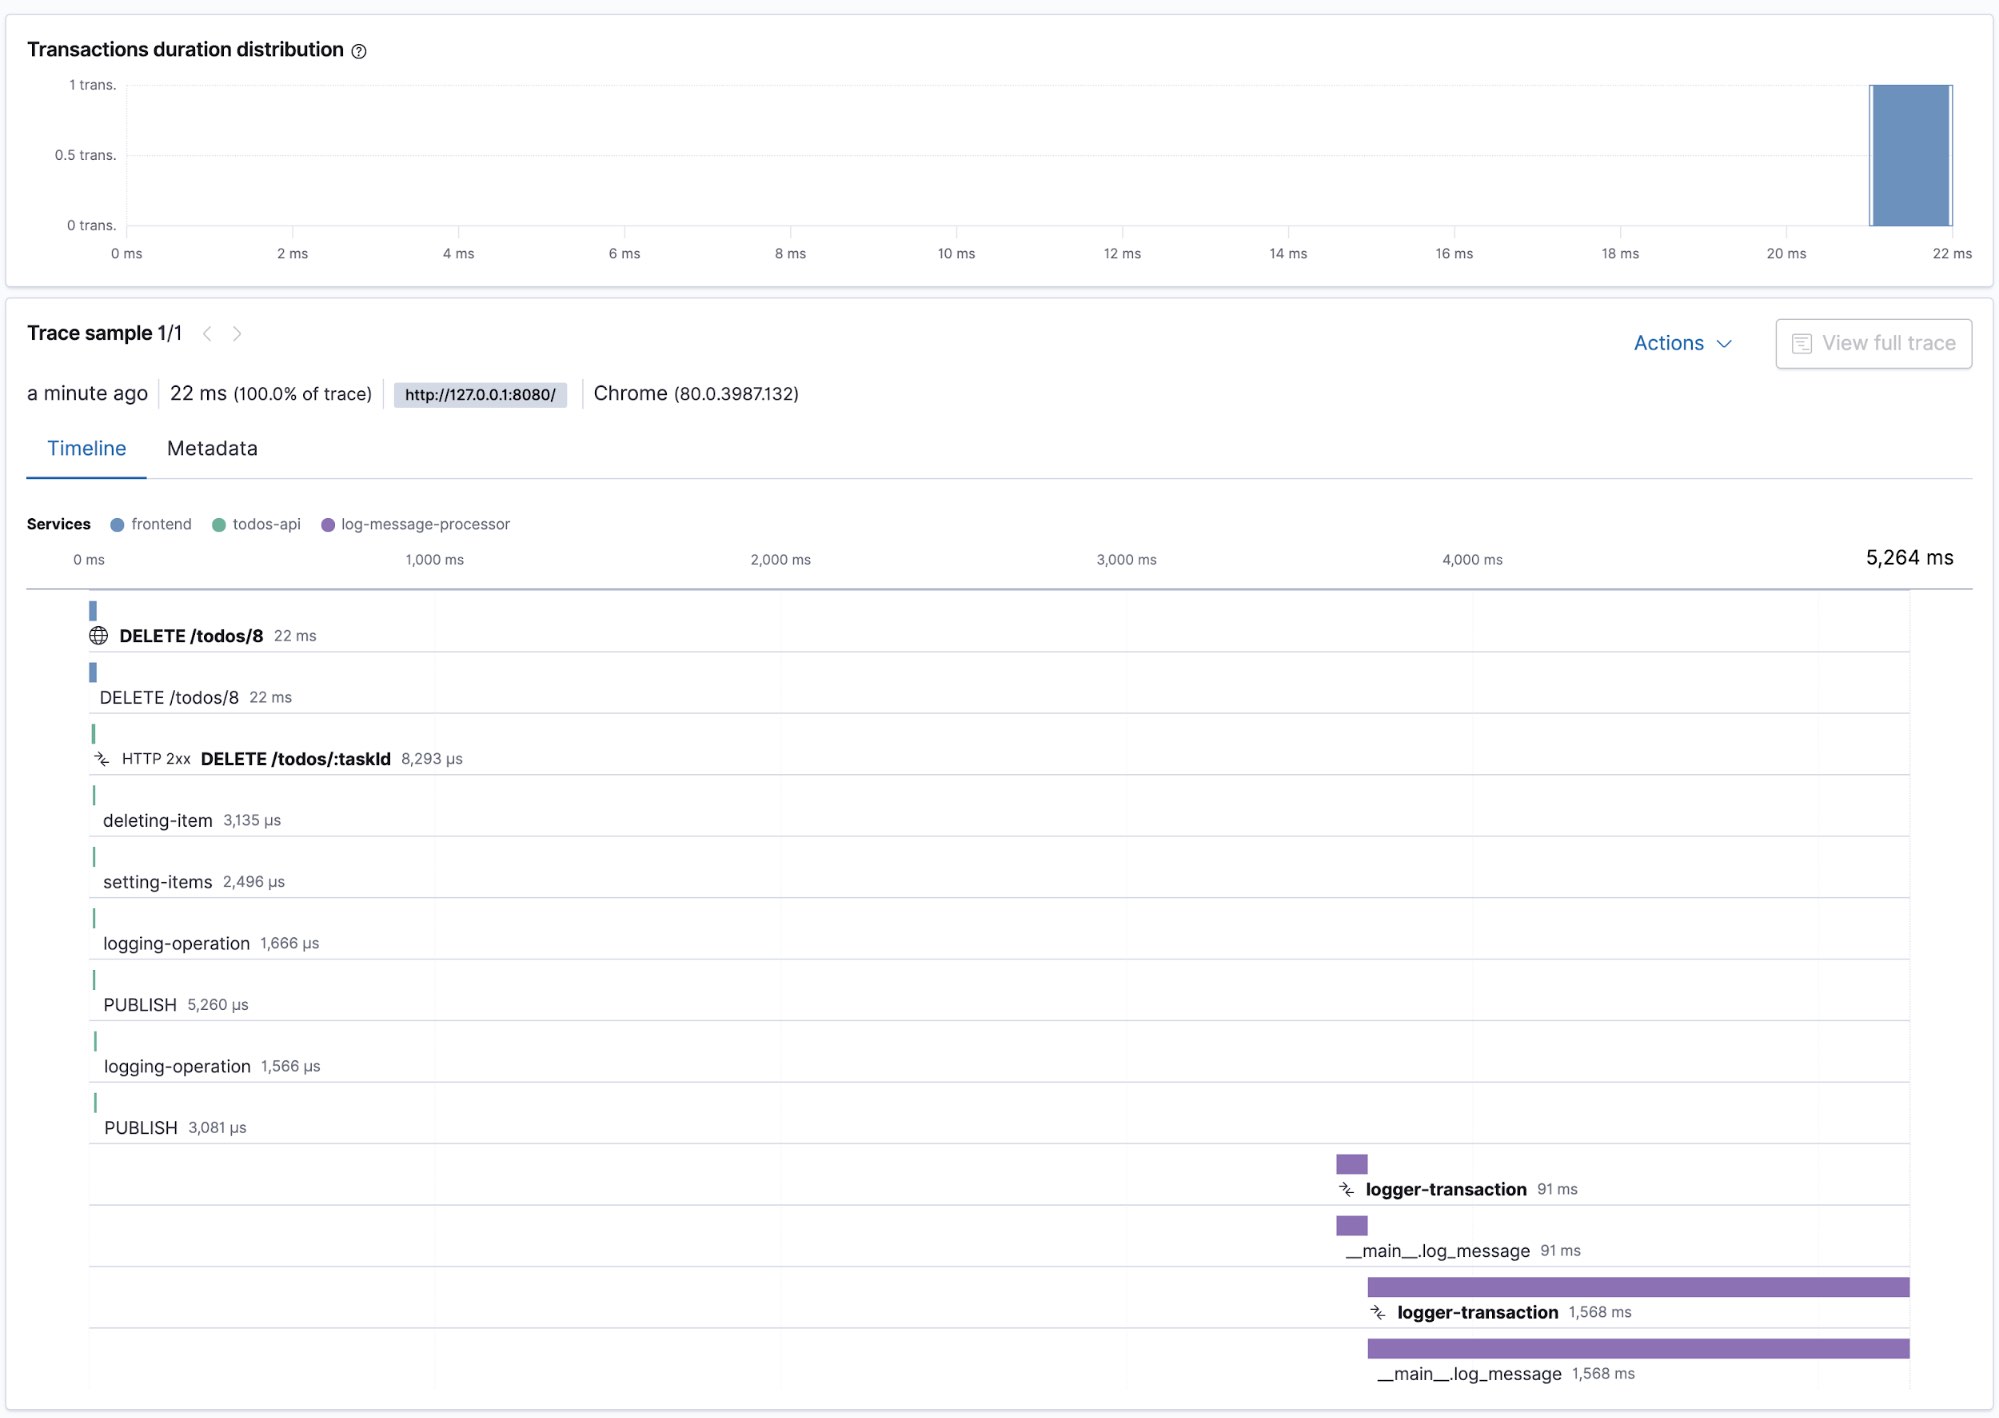
The screenshots below are examples of distributed traces and the underlying transactions and spans. They show the creation and deletion process for the todo items, as it flows through the microservices. From the frontend to the POST request to the todos-api and its related spans for creation and logging, as well as subsequent log-message-processor transactions and spans.
Conclusion and next steps
We’ve witnessed first hand how to go about instrumenting a microservices application using different languages and frameworks.
There are many areas we did not explore, for example the Elastic APM app in Kibana also offers information of errors and metrics.
Furthermore, the Elastic APM allows you to correlate with the logs gathered from the applications. This means you can easily inject trace information into your logs, allowing you to explore logs in the Logs app, then jump straight into the corresponding APM traces — all while preserving the trace context.
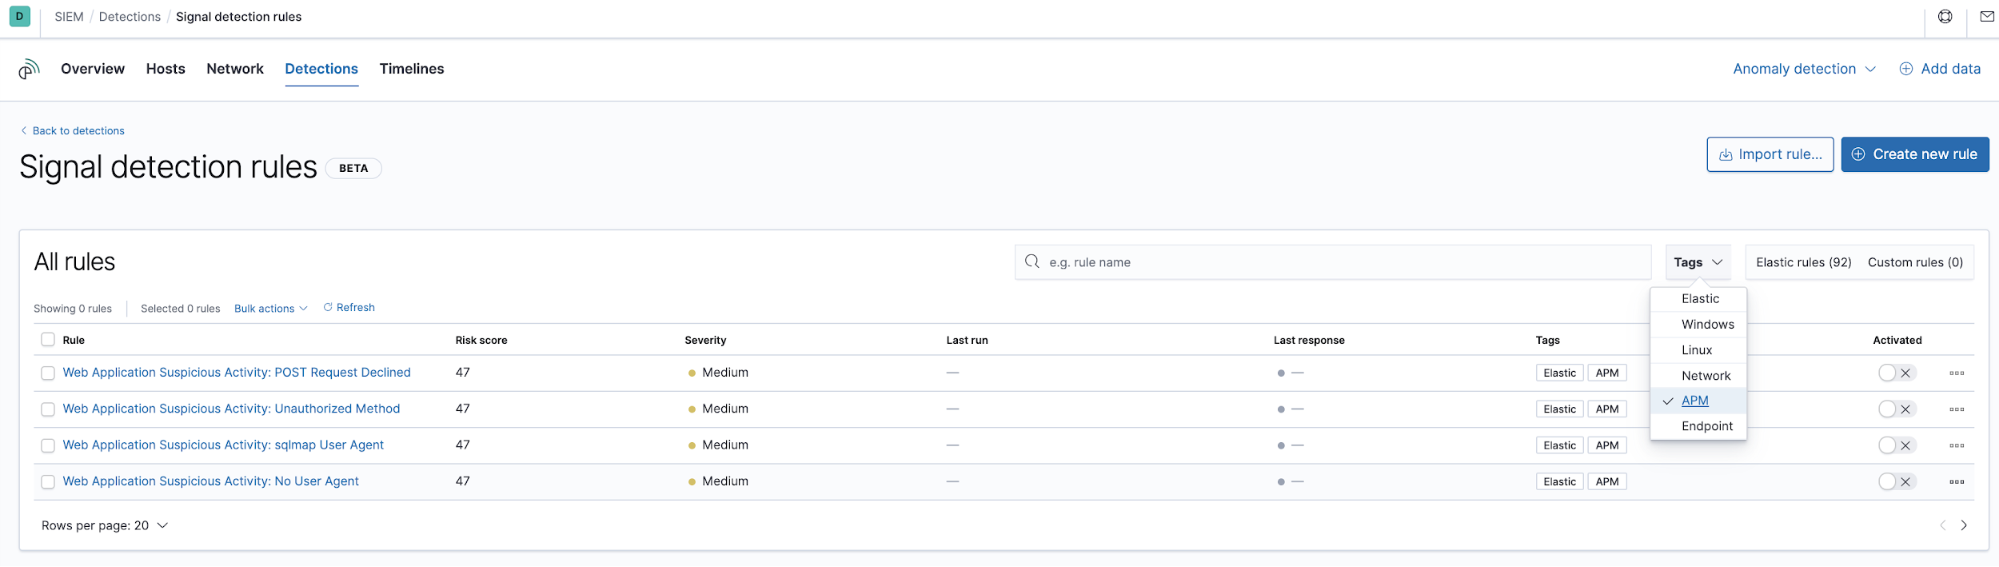
Additionally, data collected by APM are also available in the SIEM app:
Another area of interest is using APM data with the machine learning capabilities of the Elastic stack in order to e.g. calculate anomaly scores on transaction response times.
Any questions on any of the above, feel free to get in touch with Elastic or submit them on the Discuss forum platform.