Getting started with adding a new security data source in your Elastic SIEM: Part 1
Editor’s Note — August 19, 2020: The Elastic SIEM solution mentioned in this post is now referred to as Elastic Security. The broader Elastic Security solution delivers SIEM, endpoint security, threat hunting, cloud monitoring, and more. If you're looking for more specific information on Elastic Security for SIEM use cases, visit our SIEM solution page.
What I love about our free and open Elastic SIEM is how easy it is to add new data sources. I’ve learned how to do this firsthand, and thought it’d be helpful to share my experience getting started.
Last October, I joined Elastic Security when Elastic and Endgame combined forces. Working with our awesome security community, I’ve had the opportunity to add new data sources for our users to complement our growing catalog of integrations.
This blog post is the first in a two-part series that describes how to get started adding new data sources to your SIEM. In this post, we’ll show you how to ingest a new data source in just a few minutes. In part two, we’ll show you how our community contributes new data sources. If you’d like to follow along, sign up to use the SIEM app for free on Elastic Cloud today.
Overview
Adding your data with Elastic Common Schema (ECS) is exciting because it gives you the benefit of our prebuilt SIEM detections curated by our Intelligence and Analytics team. These detections work right out of the box to stop attacks hidden in your data.
Recently, users in our community Slack workspace asked us about adding CrowdStrike Falcon endpoint data into the Elastic SIEM. We exchanged emails and walked through the simple steps together. Within a few short minutes, we were up and running with events in ECS.

Before we walk through the simple two-step process to ingest CrowdStrike data, let’s first review the architecture we use to collect data into the SIEM. Our solutions use open source data shippers, called Beats, to collect security data from popular sources like GCP, Microsoft 365, Okta, AWS, firewalls, and many others. The catalog grows with each new release. In the example that follows, we’ll use Filebeat. It can be used to collect data from log files.
To convert data to ECS, first we ship it to Elasticsearch via Beats. Fields are translated to ECS with ingest pipelines in Elasticsearch just before it’s stored. With data in ECS, our users can:
- Leverage powerful SIEM workflows
- Deploy our prebuilt detections
- Write their own detection rules to stop attacks
- Open a new case and conduct investigations
- Protect their environment at speed and scale
- Leverage other workflows, like Lens or Discover
It’s a compelling alternative to other products. And it’s free and open.
Accessing your CrowdStrike data
To add CrowdStrike Falcon event data, we need to answer two questions:
- How do we get the data from the Falcon platform?
- How is the data formatted?
CrowdStrike makes available to its users a SIEM connector to export data from the Falcon platform. This connector is installed and runs as a service on a Linux server. It collects streaming API event data from the Falcon platform and stores it in a log file in JSON format. The log file path is /var/log/crowdstrike/falconhoseclient/output.
Here is an example of an alert from this file streamed from the CrowdStrike Falcon platform.
|
|
Now we can answer our two questions. We’ll use Filebeat to collect data and decode it into JSON from the Falcon SIEM connector log file. And we’ll use an Elasticsearch ingest pipeline to convert relevant fields to ECS.
Step 1: Update the Filebeat configuration
We’ll use Filebeat on the same Linux server where we’re running the SIEM connector. It’s a good idea to set up the connector and Filebeat to run as a service using something like systemd. Run the setup command to initialize Filebeat with Elasticsearch and configure Filebeat to communicate securely with Elasticsearch if you’re in production.
Let’s first configure where to collect the data from the log file by modifying the Filebeat configuration in /etc/filebeat/filebeat.yml to add the path to this file.
|
|
Make sure type is log and enabled is true.
Now let’s read and decode the JSON data. Structured logging with Filebeat is easy, and when JSON objects span multiple lines, we use the multiline option. Add the following options to the same section of the configuration.
|
|
These configuration options collect encoded JSON objects as a string spanning multiple lines.
Next, we need to decode the string into JSON. We’ll do this with a Filebeat processor. The entire JSON object is currently encoded in the message field as a string. When we decode it, we’ll move the object to a new namespace called crowdstrike. Then we’ll drop the original message before we send the data to Elasticsearch to avoid duplication.
|
|
The decode_json_field processor decodes the string in the message field and stores the results in the crowdstrike field. The drop_fields processor removes the message field.
You can refer to the complete Filebeat configuration referenced at the end of this post.
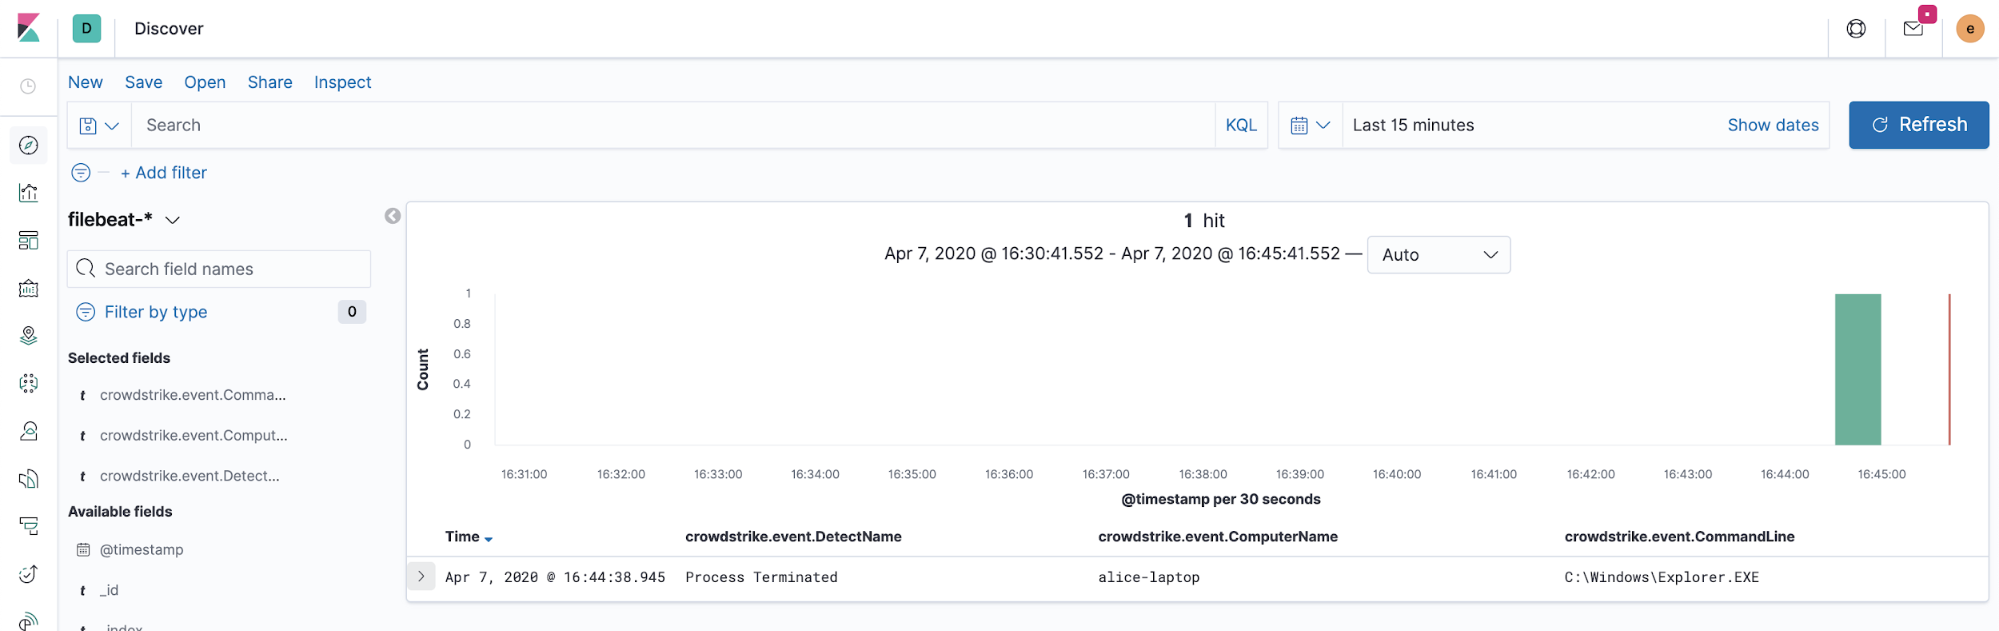
Now might be a good time to start the Filebeat service and collect a new alert event to test that our configuration is working. You should expect to see something like the following in Discover when a new alert is generated in the Falcon platform.
Now that we know we can collect the data in JSON, it’s time to convert a few fields to ECS. Let’s move on to the second and final step.
Step 2: Add an ingest pipeline to convert fields to ECS
Let’s map CrowdStrike fields to ECS. Here is a straightforward mapping of the original fields in the CrowdStrike Falcon alert data to ECS from a spreadsheet.
| source_field | destination_field |
| crowdstrike.metadata.eventCreationTime | |
| crowdstrike.event.PatternDispositionDescription | |
| crowdstrike.event.Severity | |
| crowdstrike.event.FalconHostLink | |
| crowdstrike.event.MD5String | |
| crowdstrike.event.SHA256String | |
| crowdstrike.event.ComputerName | |
| crowdstrike.event.DetectDescription | |
| crowdstrike.event.CommandLine | |
| crowdstrike.event.FileName | |
| crowdstrike.event.DetectName | |
| crowdstrike.event.Tactic | |
| crowdstrike.event.Technique | |
| crowdstrike.event.MachineDomain | |
| crowdstrike.event.UserName | |
| crowdstrike.event.SensorId |
Next, we need to create an Elasticsearch ingest pipeline to convert the fields to ECS. It’s easy to do by following the documentation, but it’s even easier and much faster to create an ingest pipeline using ecs-mapper. Just export your mapping from a spreadsheet to a CSV file and run this command.
|
|
This command generates three files. It creates an ingest pipeline for Elasticsearch, a mutate filter if you’re using Logstash, and Filebeat processors if you wish to do the conversion in Filebeat.
Let’s edit the elasticsearch.json pipeline and add a few more processors. First, let’s set a few more event fields to map these Falcon alerts into the malware alert category in the SIEM.
|
|
Let’s also discard any other messages that aren’t alerts. If we want to add more event types, we can expand our ECS mapping and conditionally set the event categorization fields. But don’t worry, if you want to collect more event types, use our CrowdStrike Filebeat module.
|
|
Now we’re ready to install the ingest pipeline in Elasticsearch. You can make the API call conveniently in Kibana from the Dev Tools Console. It will persist reboots.
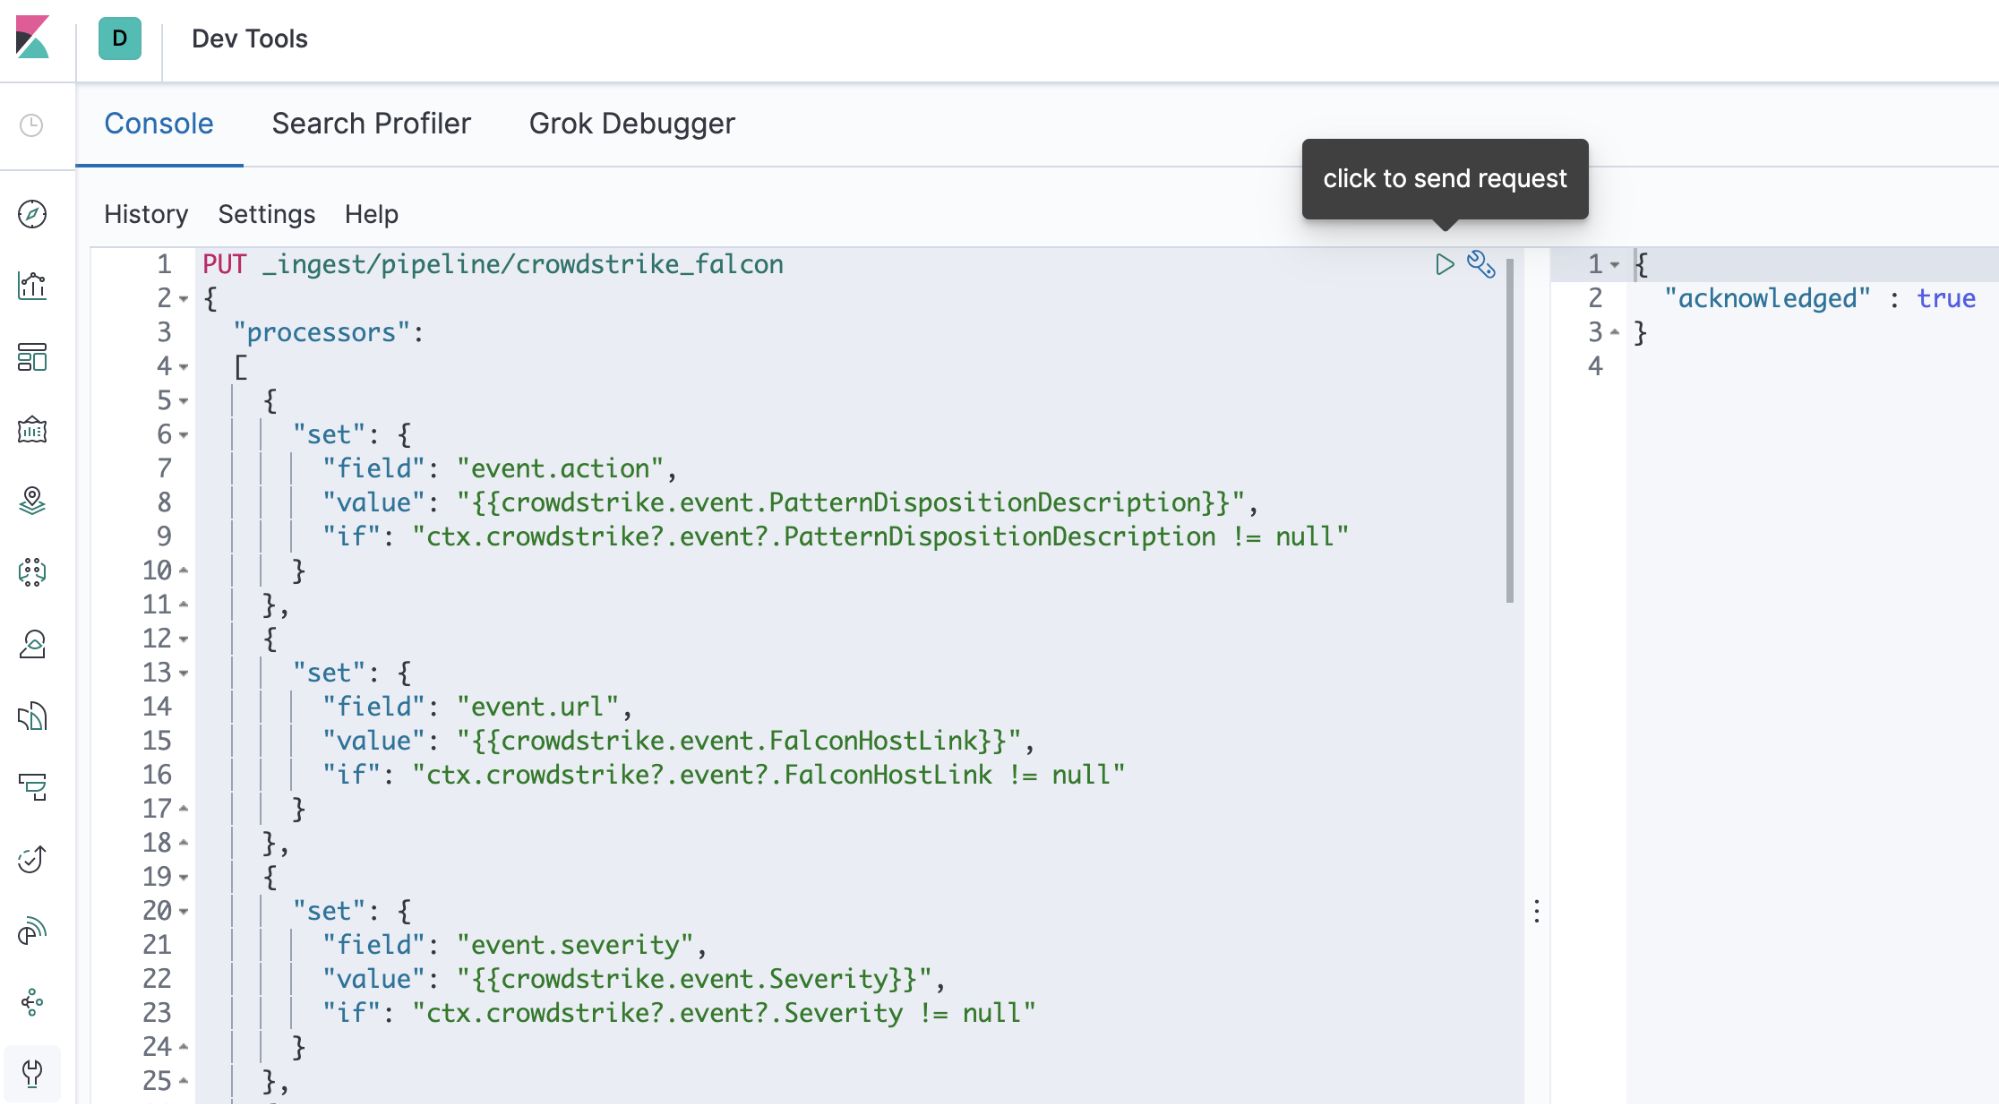
Copy the list of processors from the array in the ingest pipeline file and paste it inside the following body of the API call. We’ll call our ingest pipeline crowdstrike_falcon.
|
|
Once we’ve sent the request, let’s update the Filebeat configuration to use our new crowdstrike_falcon pipeline.
|
|
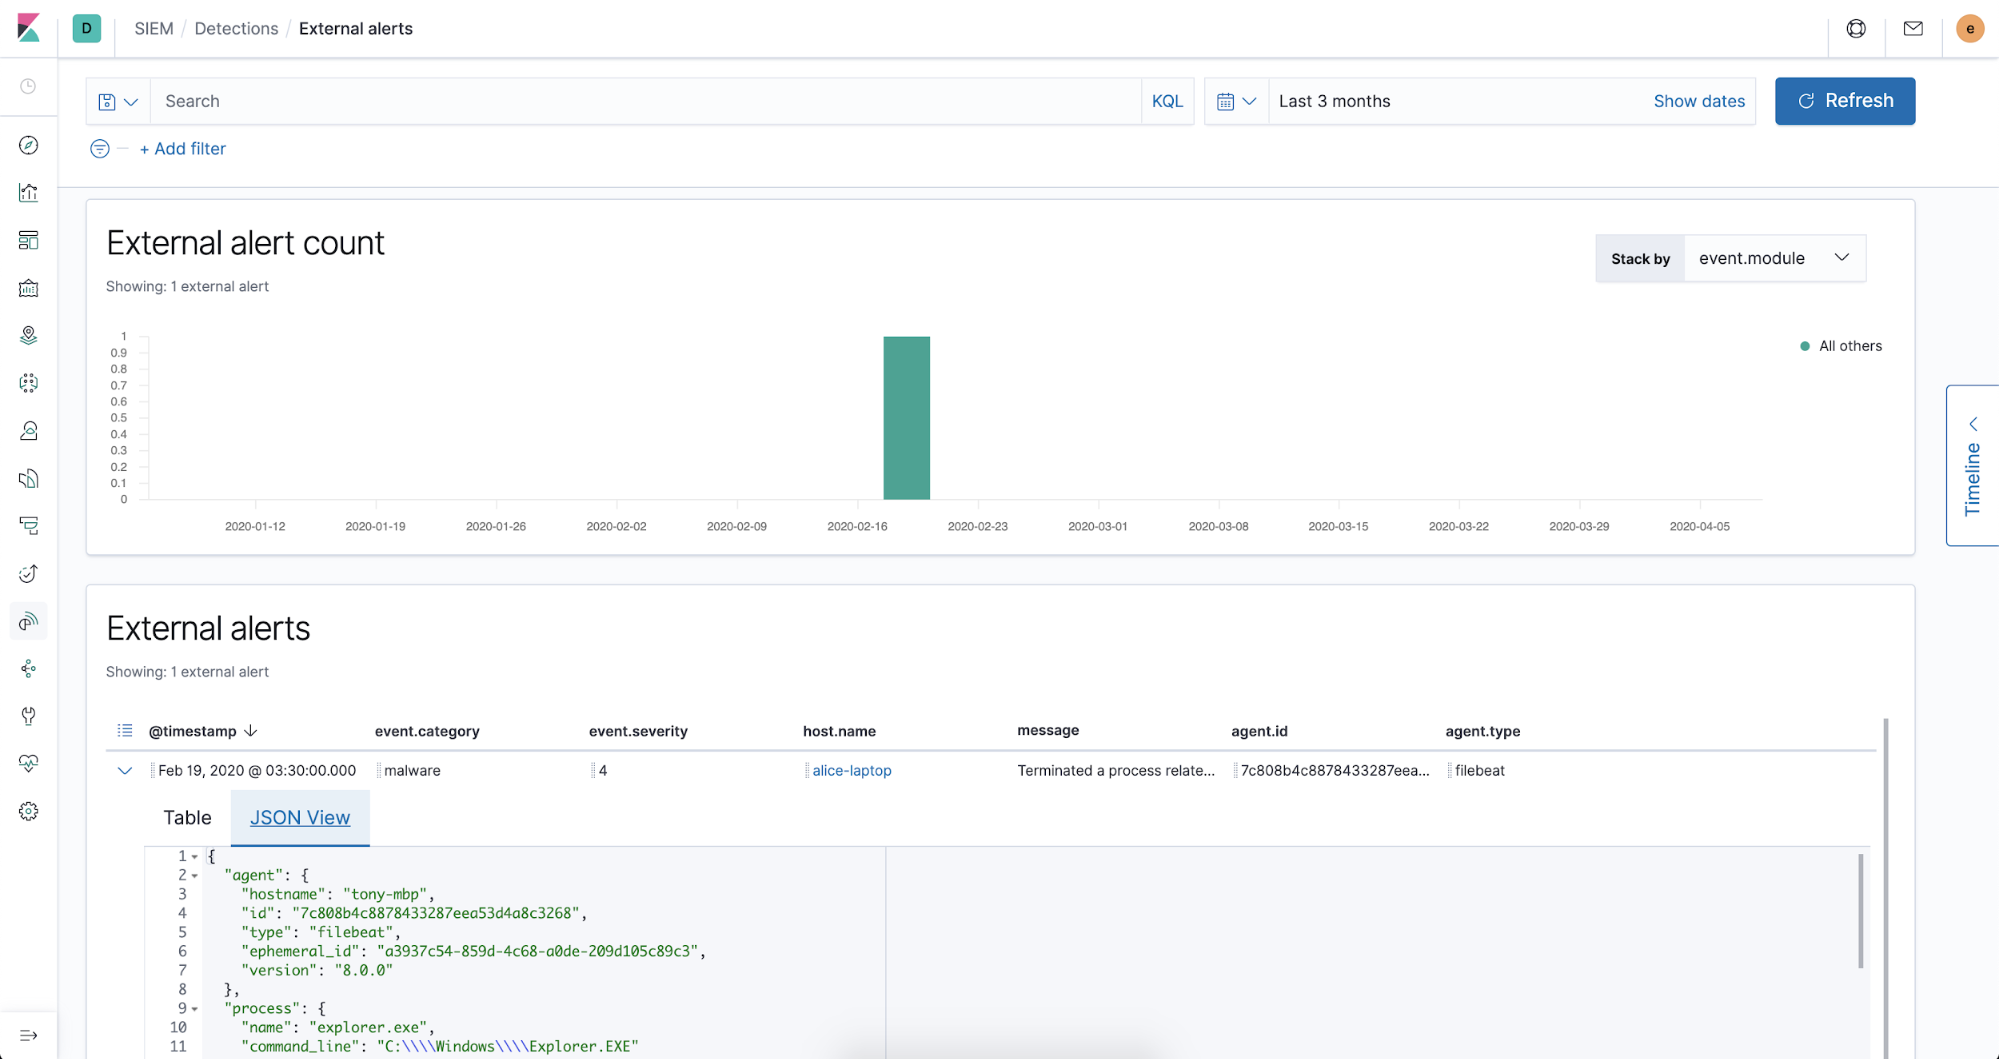
Now when we restart Filebeat, we’re ingesting CrowdStrike Falcon alerts in ECS!
Summary
In this blog post we used Filebeat to collect data from the CrowdStrike Falcon platform. And we used an ingest pipeline to convert the relevant fields to ECS. We can also use this same two-step process to add new Observability data sources, too!
In Part 2, we’ll show you how we added a Filebeat module to collect CrowdStrike Falcon data (coming in the 7.8 release) and give you a glimpse into how our community contributes new modules.
We love our awesome security community! Our community’s contributions are yet another benefit of having a free and open SIEM. If you’d like to get involved and join our community, a great way to get started is to come hang out with us in our community Slack workspace.
References